Top Market Timing Indicators Used by Institutional Investors
Institutional investors rarely depend on one chart, one economic report or one analyst’s forecast when deciding whether to increase or…
Top Market Timing Indicators Used by Institutional Investors
Institutional investors rarely depend on one chart, one economic report or one analyst’s forecast when deciding whether to increase or reduce market exposure.
Pension funds, hedge funds, sovereign wealth funds, insurers, family offices and asset managers manage capital under strict risk, liquidity and performance requirements. A poorly timed decision can increase trading costs, deepen portfolio drawdowns and make an otherwise valid investment thesis difficult to execute.
This is why professional investors use several market timing indicators together.
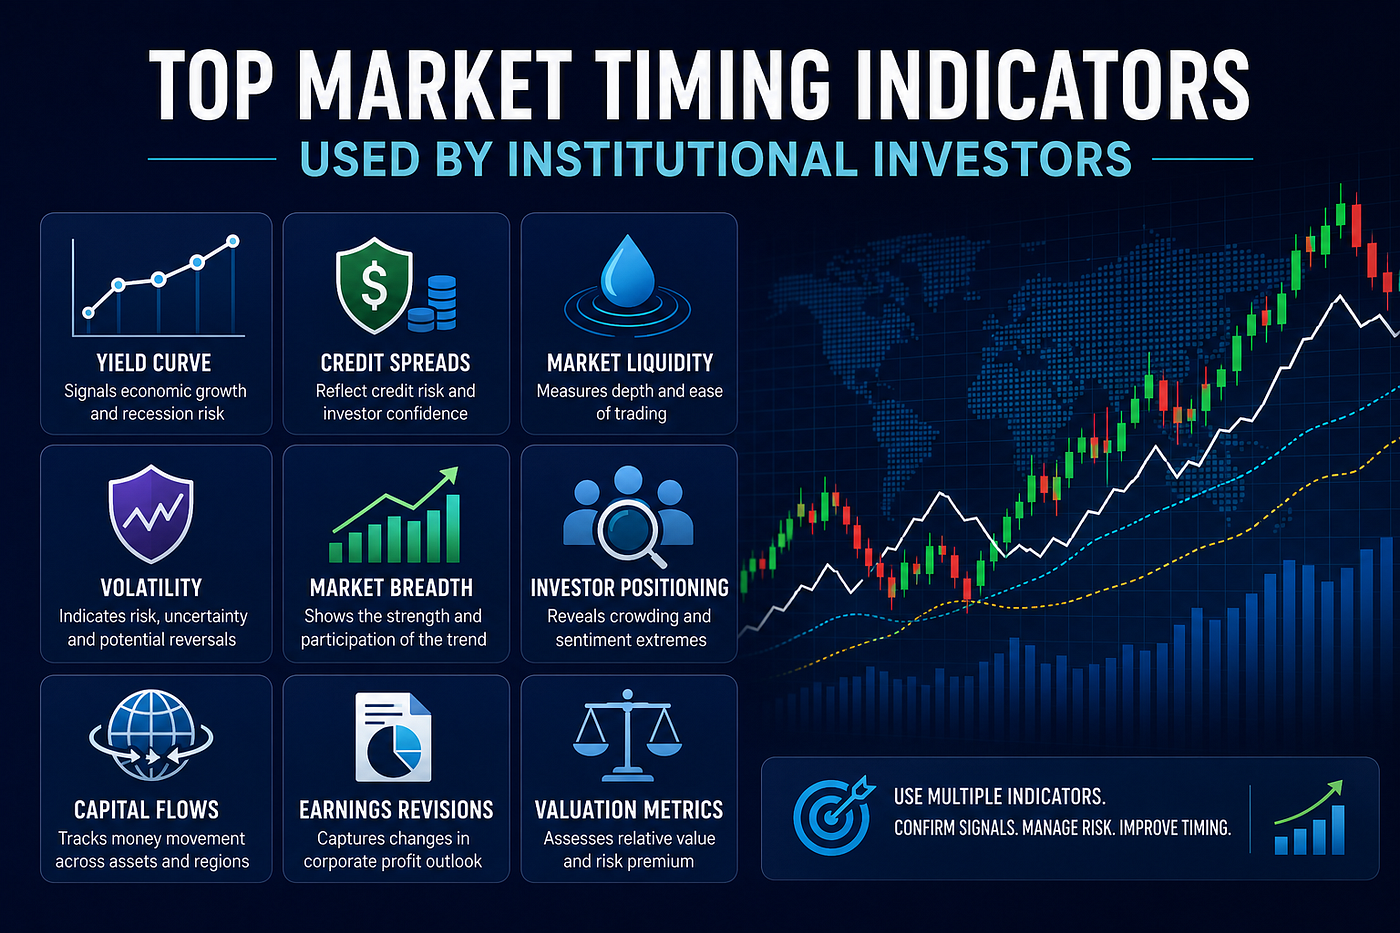
Understanding the top market timing indicators used by institutional investors requires looking beyond basic buy-and-sell signals. Institutions monitor interest rates, credit conditions, liquidity, volatility, market breadth, positioning, capital flows, earnings revisions and price trends. They use these indicators to identify the current market phase and determine whether conditions support higher exposure, stronger hedging, sector rotation or greater liquidity.
The objective is not to predict the exact market top or bottom.
The objective is to improve the probability and risk-adjusted quality of portfolio decisions.
The Institutional Market Timing framework by Rajeev Prakash is designed as a strategy-agnostic overlay for professional investors. It focuses on market phases, risk inflection points, liquidity conditions and capital rotation. The framework is intended to complement an institution’s existing research process by providing context for when to increase exposure, hedge, rotate or step aside.
No market timing indicator can guarantee investment returns.
The strongest institutional process combines several independent indicators, defines the conditions that would invalidate the outlook and controls exposure when the evidence remains uncertain.
What Is an Institutional Market Timing Indicator?
A market timing indicator is a measurable variable that helps investors assess whether the market environment is becoming more or less favourable.
Some indicators measure economic expectations.
Others evaluate liquidity, risk appetite, investor positioning, market participation or the direction of prices.
Institutional investors do not usually interpret these indicators as automatic trading commands. A yield-curve inversion does not force an institution to sell every stock. A volatility spike does not automatically justify purchasing the market. A bullish price breakout does not eliminate valuation or liquidity risk.
Instead, each indicator contributes evidence to a broader market-regime assessment.
An institution may conclude that the environment is expansionary, defensive, inflationary, disinflationary, liquid, fragile or transitioning between phases.
The portfolio response then depends on the organisation’s mandate.
A hedge fund may reduce net exposure quickly. A pension fund may rebalance gradually. An insurer may modify bond duration, while a family office may increase cash and wait for a more attractive entry period.
The Yield Curve
The Treasury yield curve is one of the most closely followed institutional market timing indicators.
It compares yields across government securities with different maturities. Institutions commonly examine the relationship between short-term yields and longer-term yields, including the two-year versus ten-year spread.
A normal yield curve generally slopes upward because investors require more compensation for lending money over longer periods. A flat or inverted curve can indicate that monetary policy is restrictive relative to expectations for future economic growth.
However, institutions do not use the curve mechanically.
Federal Reserve research has found that both traditional term spreads and near-term forward spreads have often inverted before recessions. The research also cautions that the near-term forward spread may offer a cleaner signal in some settings and that individual inversions still require economic context.
Professional investors examine why the curve is changing.
A bull steepening occurs when shorter-term yields decline faster than long-term yields, often because investors expect monetary easing.
A bear steepening occurs when longer-term yields rise faster, potentially reflecting inflation, fiscal concerns or a higher term premium.
These two developments can carry very different implications for equities, bonds, currencies and rate-sensitive sectors.
Credit Spreads and the Excess Bond Premium
Credit spreads measure the additional yield investors demand for holding corporate bonds instead of comparable government securities.
When spreads remain narrow, markets may be signalling confidence in economic growth, corporate cash flow and the availability of financing.
When spreads widen, investors may be becoming more concerned about default risk, liquidity or economic weakness.
Institutions often study investment-grade spreads, high-yield spreads and the behaviour of credit-default-swap indices. They may also examine the excess bond premium, which attempts to isolate the component of corporate spreads associated with investor risk appetite rather than expected default losses.
Federal Reserve research has found that credit-market sentiment, including the excess bond premium, can contain information about future economic activity and recession risk.
Credit can provide an important confirmation signal.
An equity index may continue rising while high-yield spreads begin widening. That divergence may suggest that risk is building beneath the surface.
Conversely, narrowing credit spreads during an equity correction may indicate that the financial system remains relatively stable and that the weakness has not developed into broad credit stress.
Market Liquidity
Liquidity measures how easily investors can buy or sell an asset without causing a large price movement.
For institutional investors, liquidity is not a secondary consideration. It determines whether a large portfolio can implement its strategy at a reasonable cost.
Professional investors monitor bid-and-ask spreads, market depth, transaction volumes, price impact and the capacity of dealers or market makers to absorb orders.
The Bank for International Settlements explains that liquidity cannot be described by one measure. A complete assessment should consider immediacy, tightness, depth, resilience and market breadth. A market can display narrow spreads while suffering from declining depth, leaving it more vulnerable to large orders or sudden stress.
This distinction is critical.
Headline prices may appear calm even while the market’s underlying ability to absorb selling pressure deteriorates.
An institution may respond by reducing position size, avoiding concentrated exits or increasing liquidity reserves.
The Rajeev Prakash Institutional Market Timing framework similarly treats liquidity and capital rotation as central parts of market-phase analysis.
Global Liquidity and Credit Availability
Domestic market liquidity provides only part of the picture.
Large institutions also monitor global liquidity, including cross-border lending, international bond issuance and foreign-currency credit.
The BIS defines global liquidity as the ease of financing in global financial markets. Its global liquidity indicators track bank lending and international debt funding to non-bank borrowers, with particular attention to credit denominated in US dollars, euros and Japanese yen outside their home currency areas.
Expanding global credit can support risk assets, emerging markets, commodities and international investment flows.
Contracting credit can produce the opposite effect.
Companies and countries that depend heavily on foreign-currency financing may face greater pressure when the dollar strengthens or global funding costs rise.
Institutional investors use these conditions to determine whether a domestic opportunity is supported by the wider financial environment.
A strong local market may still carry significant risk when global dollar liquidity is deteriorating.
Volatility and the Volatility Term Structure
Volatility measures the size and frequency of market movements.
Institutions analyse both realised volatility, based on actual price changes, and implied volatility, derived from options prices.
A low-volatility environment can support larger position sizes and carry strategies. It can also encourage leverage and complacency.
A sudden increase in volatility may represent a temporary event, a liquidity shock or the beginning of a broader regime change.
Professional investors therefore examine the source and structure of volatility.
They compare short-term implied volatility with longer-term volatility. They study skew, which reflects the relative cost of downside protection. They also examine whether volatility is limited to one sector or spreading across multiple asset classes.
Recent BIS market analysis demonstrated why institutions must look beneath index-level volatility. During late 2025 and early 2026, individual-stock volatility became substantially greater than headline index volatility while investors rotated between regions, sectors, growth companies, value stocks and smaller businesses.
A stable index can therefore hide meaningful stress or opportunity within its components.
Market Breadth
Market breadth measures how widely a market trend is supported.
An index may rise because many companies are advancing, or it may rise because a small group of heavily weighted shares is performing strongly.
These two situations do not carry the same level of market health.
Institutional investors monitor advancing and declining securities, new highs and lows, equal-weighted indices, trading volume and the percentage of stocks trading above important moving averages.
Improving breadth may indicate that a rally is becoming more durable.
Weakening breadth can suggest that leadership is narrowing and that the index depends increasingly on a small number of companies.
Breadth becomes more informative when combined with volatility, credit and earnings revisions.
A rising index, narrowing breadth and widening credit spreads may represent a more fragile environment than a rising index supported by broad participation and improving corporate expectations.
The BIS observation that major indices can remain relatively stable while individual securities experience much greater volatility reinforces the importance of analysing participation beneath the headline market.
Institutional Positioning
Positioning indicators show how different groups of investors are exposed to a market.
Institutions may analyse futures positions, options activity, short interest, dealer exposure and fund-manager surveys.
The CFTC’s Commitments of Traders reports provide a breakdown of reportable positions in futures and options markets. Its Traders in Financial Futures data separates categories such as dealers, asset managers, leveraged funds and other reportable traders.
Positioning does not reveal the exact reason behind every trade.
An asset manager may hold futures for hedging rather than speculation. A dealer’s position may reflect its role in facilitating client activity.
Nevertheless, extreme positioning can identify crowded trades.
When a large group of participants holds a similar exposure, the market may become vulnerable to rapid unwinding. A small catalyst can produce a disproportionate move when many investors attempt to exit simultaneously.
Institutions therefore compare positioning with price response.
When extremely bullish positioning no longer produces rising prices, the trend may be losing strength.
When heavily bearish positioning fails to push prices lower, selling pressure may be approaching exhaustion.
Capital Flows
Capital-flow indicators track where investors are moving money.
Institutions examine mutual-fund and exchange-traded-fund flows, cross-border investment, futures activity, bond issuance and changes in cash allocations.
Flows can identify which regions, sectors and asset classes are gaining support.
However, institutions distinguish between strategic and short-term flows.
Long-term pension or insurance capital may behave differently from leveraged hedge-fund exposure. Passive investment flows may respond to index changes rather than a new fundamental view.
Capital flows are particularly important for emerging markets and less liquid assets.
A market may perform strongly while foreign capital enters, but the same dependence can become a vulnerability when global risk appetite weakens.
Global liquidity statistics help investors understand the wider credit environment in which those flows occur.
The Institutional Market Timing service by Rajeev Prakash specifically includes liquidity and capital-rotation mapping to help identify how risk appetite migrates across assets, sectors and regions as the market phase changes.
Earnings Revisions
Institutional equity investors follow changes in analyst earnings expectations closely.
Current earnings describe what a company has already achieved.
Earnings revisions attempt to capture how expectations for the future are changing.
When analysts raise forecasts across a broad group of companies, the market may be receiving confirmation that economic or sector conditions are improving.
When estimates decline despite stable stock prices, valuation risk may be increasing.
Institutions examine the direction, size and breadth of revisions.
One company receiving a higher forecast may reflect business-specific strength. A large number of companies receiving upgrades may indicate a broader earnings cycle.
The quality of earnings matters as well.
Institutions compare revenue growth, margins, cash flow and management guidance rather than relying only on reported earnings per share.
Earnings revisions work best as an intermediate-term indicator.
They may not identify the exact entry date, but they can help investors distinguish between a price rally supported by improving fundamentals and one driven mainly by sentiment or liquidity.
Valuation and the Equity Risk Premium
Valuation does not usually provide a precise short-term timing signal.
An expensive market can continue rising, while a cheap market can remain weak for an extended period.
However, valuation affects the return investors may reasonably expect for accepting risk.
Institutional investors compare earnings yields, cash-flow yields, credit yields and government bond rates. They may estimate the equity risk premium, which represents the additional return investors expect from stocks over safer assets.
Federal Reserve financial-stability analysis uses measures such as expected equity risk premiums and excess bond premiums to evaluate asset valuations and risk appetite.
Valuation becomes more useful when combined with a catalyst.
An expensive market with declining liquidity, weakening breadth and rising real yields may carry greater risk than an expensive market supported by strong earnings and expanding participation.
A cheap market with improving credit and price structure may offer a stronger opportunity than one where fundamentals continue deteriorating.
Trend and Momentum Indicators
Price itself contains information.
Institutional investors use moving averages, breakouts, relative strength and momentum measures to determine whether market participants are confirming the fundamental outlook.
A market above a rising long-term average may remain in a constructive trend. A breakdown accompanied by weak breadth and worsening credit can indicate a more serious deterioration.
Institutions usually avoid relying on one moving-average crossover.
They examine several timeframes and compare price trends across sectors, regions and asset classes.
Relative strength is especially useful for identifying rotation.
An index may appear stable while value stocks, small caps, defensives or international markets begin outperforming previous leaders.
The 2026 BIS review documented this type of underlying shift, with value and smaller companies outperforming while richly valued technology shares faced increased scrutiny.
Trend indicators help institutions avoid acting on an economic forecast that the market has not yet confirmed.
Correlation and Cross-Asset Confirmation
Institutional portfolios contain several asset classes, so investors monitor relationships between them.
Equities, government bonds, credit, currencies and commodities can provide confirmation or contradiction.
A rising equity market accompanied by narrowing credit spreads and stable volatility may reflect improving risk appetite.
A rising equity index alongside widening credit spreads, increasing volatility and a stronger defensive currency may signal a more fragile environment.
Correlations can also change during stress.
Assets that normally diversify one another may begin moving in the same direction when investors need liquidity.
Professional investors therefore use dynamic rather than fixed correlation assumptions.
Cross-asset confirmation reduces dependence on one market signal and helps determine whether a move is isolated or part of a broader regime transition.
Financial Astrology as an Alternative Timing Indicator
Some professional investors examine alternative datasets alongside conventional economic and market indicators.
Financial astrology studies whether planetary cycles correspond with changes in collective psychology, volatility and market timing.
Its responsible institutional role is to identify potential observation windows.
A planetary cycle should not override liquidity, valuation, credit or market structure. It may instead indicate a period when an investment team should pay closer attention to confirmation signals.
The Rajeev Prakash Institutional Market Timing framework is based on cycle research and is intended to operate as an additional timing overlay rather than compete with an institution’s existing research stack.
Any alternative indicator should undergo the same testing as a conventional model.
Institutions should define the rule in advance, study both successful and unsuccessful signals and account for transaction costs and implementation constraints.
How Institutions Combine Market Timing Indicators
The top market timing indicators used by institutional investors become more valuable when organised into a repeatable framework.
An institution may begin with the economic and monetary regime.
It then examines the yield curve, credit spreads and global liquidity.
Market breadth, volatility and price trends can show whether financial markets confirm the macroeconomic view.
Positioning and capital flows can reveal crowding or unstable participation.
Earnings revisions and valuation help determine whether the expected return justifies the risk.
The institution should avoid counting correlated indicators as independent evidence.
A rising equity index, strong momentum and positive relative strength may all reflect the same underlying price movement.
Greater confirmation comes from indicators measuring different forces, such as price, credit, liquidity, earnings and positioning.
The resulting decision should remain proportional.
Mixed evidence may justify a neutral allocation. Strong agreement across several independent indicators may support a larger adjustment.
Common Market Timing Mistakes
One common mistake is searching for a single perfect indicator.
No yield spread, volatility measure or technical pattern works in every market environment.
Another mistake is overfitting a model to historical data.
A strategy may appear highly accurate because its rules were designed after seeing the outcomes.
Institutions can also react too frequently to noisy data, increasing turnover and transaction costs.
The opposite problem occurs when an organisation ignores deteriorating indicators because changing a large portfolio or official investment view feels difficult.
Another mistake is failing to define invalidation.
A market view should specify the conditions that would show that the original interpretation is no longer valid.
The strongest institutional framework accepts that every signal can fail.
Risk management determines whether a failed signal becomes a manageable cost or a damaging portfolio event.
Final Thoughts
The top market timing indicators used by institutional investors do not provide guaranteed predictions.
They provide evidence about the current market environment.
The yield curve can reveal changes in policy and growth expectations.
Credit spreads can show whether financial risk is increasing.
Liquidity measures can identify whether large transactions remain executable without excessive price impact.
Volatility and breadth can reveal developments hidden beneath a calm headline index.
Positioning can identify crowded exposure, while capital flows show where risk appetite is moving.
Earnings revisions and valuation can indicate whether fundamentals support market prices.
Trend, momentum and cross-asset confirmation help determine whether the market agrees with the investment thesis.
Institutional investors combine these indicators because every individual measure has limitations.
They seek confirmation across economic conditions, credit, liquidity, participation, positioning and price.
Alternative cycle research, including financial astrology, can provide an additional observation layer when it is tested objectively and used within established risk controls.
The objective is not to trade every fluctuation.
It is to recognise when the balance between potential return and risk has changed enough to justify action.
For institutional market-phase analysis, risk windows, liquidity and capital-rotation mapping, and a cycle-based timing overlay designed for professional investors, visit:
https://finance.rajeevprakash.com/products/institutional-market-timing/
메타데이터
- post_id
- bb6369317d92
- slug
- top-market-timing-indicators-used-by-institutional-investors-bb6369317d92
- url
- https://medium.com/@astroday/top-market-timing-indicators-used-by-institutional-investors-bb6369317d92
- canonical_url
- https://medium.com/@astroday/top-market-timing-indicators-used-by-institutional-investors-bb6369317d92
- author_url
- https://medium.com/@astroday
- status
- ok
- fetched_at
- 2026-07-20 15:17:34