Vanity Metrics Are Lying to You: The Engineer’s Guide to Cohort Analysis
If you are judging the health of your product by looking at aggregate metrics like “Total Registered Users” or standard “Monthly Active…
Vanity Metrics Are Lying to You: The Engineer’s Guide to Cohort Analysis
If you are judging the health of your product by looking at aggregate metrics like “Total Registered Users” or standard “Monthly Active Users” (MAU), you are flying blind.
Aggregate metrics are vanity metrics. They only go up and to the right, which looks great on a slide deck, but they completely mask the underlying reality of user churn. You might be acquiring 10,000 new users a month, but if 9,500 of them abandon your app after day three, you do not have a growing product — you have a leaky bucket.
To actually understand if your product is sticky, you need to stop looking at the aggregate and start looking at Cohorts.
Here is the battle-tested, pragmatic guide to implementing cohort analysis in your data warehouse, moving past the vanity numbers, and finding out what is actually happening to your users.
1. What is a Cohort (and Why Does It Matter)?
A cohort is simply a group of users who share a common characteristic within a specific time period. The most common grouping is the Acquisition Month (e.g., “Users who signed up in January”).
By tracking these specific groups over time, you isolate variables. If you release a massive UI overhaul in March, cohort analysis allows you to see if the “March Cohort” retains better in their first 30 days than the “February Cohort” did. It gives you cause and effect.
2. The Three Pillars of Setup
Before writing any SQL, you have to define your parameters. If you get these wrong, your dashboard will be useless.
- The Cohort Definition (The Grouping): How are we grouping users? Usually, this is the month they created their account.
- The Engagement Event (The Action): What defines an “active” user? Logging in is a terrible metric. You need to track the core value metric. For a B2B SaaS app, it might be
report_generated. For e-commerce, it ispurchase_completed. - The Time Interval (The Buckets): How are we measuring the passage of time? For enterprise software, Months make the most sense. For mobile gaming or consumer social media, you need Days or Weeks.
3. The SQL Architecture
You do not need an expensive product analytics tool to do this. If your data lives in a standard data warehouse (Snowflake, BigQuery, PostgreSQL), you just need a solid multi-step Common Table Expression (CTE) query.
Here is the blueprint for calculating monthly retention.
Step 1 & 2: Find the “Birth” and the “Activity”
First, we find the exact month each user signed up, and then we find every subsequent month they performed our core action.
WITH cohort_items AS (
  -- The Birth Month
  SELECT
    user_id,
    DATE_TRUNC('month', MIN(event_timestamp)) AS cohort_month
  FROM user_events
  WHERE event_name = 'account_created'
  GROUP BY 1
),
user_activities AS (
  -- The Activity Months
  SELECT
    user_id,
    DATE_TRUNC('month', event_timestamp) AS activity_month
  FROM user_events
  WHERE event_name = 'core_value_action'
  GROUP BY 1, 2
),
Step 3: Calculate the Baseline Size
To calculate a percentage later, we need to know exactly how many users were in each original cohort.
cohort_size AS (
  SELECT
    cohort_month,
    COUNT(DISTINCT user_id) AS total_users
  FROM cohort_items
  GROUP BY 1
),
Step 4: Calculate the Time Delta
This is the engine of the query. We join the user’s birth month to their activity months and calculate the difference to figure out if this was their “Month 1”, “Month 2”, or “Month 12” of activity.
retention_base AS (
  SELECT
    c.cohort_month,
    COUNT(DISTINCT a.user_id) AS active_users,
    -- Calculate the difference in months
    (EXTRACT(YEAR FROM a.activity_month) - EXTRACT(YEAR FROM c.cohort_month)) * 12 +
    (EXTRACT(MONTH FROM a.activity_month) - EXTRACT(MONTH FROM c.cohort_month)) AS month_number
  FROM cohort_items c
  LEFT JOIN user_activities a ON c.user_id = a.user_id
  GROUP BY 1, 3
)
Step 5: The Final Percentage
Finally, we bring it all together.
SELECT
  r.cohort_month,
  s.total_users,
  r.month_number,
  r.active_users,
  ROUND((r.active_users::NUMERIC / s.total_users) * 100, 2) AS retention_percentage
FROM retention_base r
JOIN cohort_size s ON r.cohort_month = s.cohort_month
WHERE r.month_number IS NOT NULL
ORDER BY 1, 3;
4. Reading the Heatmap Like an Architect
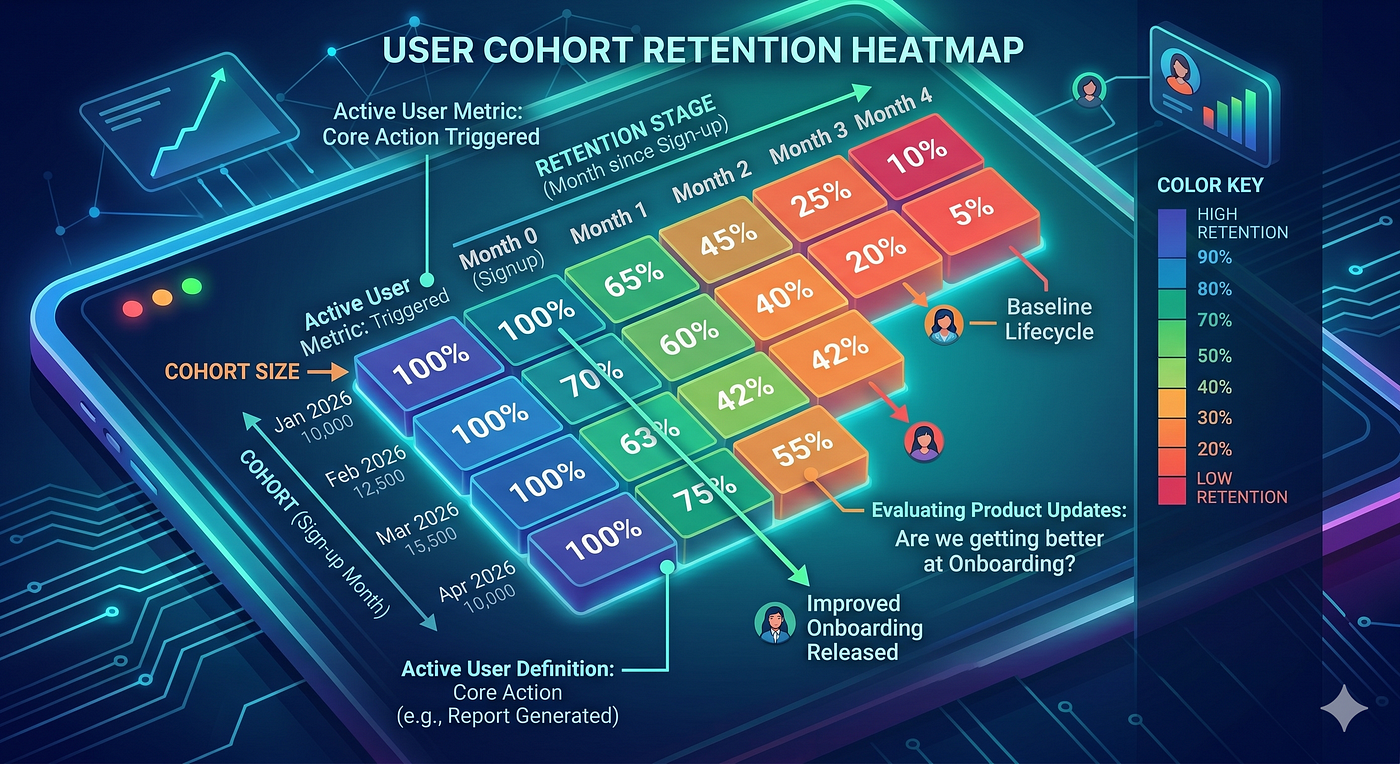
When you plug that SQL output into a BI tool (like Tableau, Looker, or Metabase) and pivot it, you get the classic Cohort Heatmap (the triangle chart).
The Y-Axis represents the Cohort (e.g., Jan 2026, Feb 2026), the X-Axis represents the Time Delta (Month 0, Month 1, Month 2), and the cells display the retention percentage.
Here is how you read it to diagnose your product:
- Read Down a Column (Evaluating Product Updates): This tells you if your product is getting better at onboarding. Look at the “Month 1” column. If the January cohort had 20% retention in Month 1, but the April cohort has 35% retention in Month 1, your recent onboarding tweaks are working.
- Read Across a Row (Evaluating Product Lifecycle): This tells you the lifecycle of a specific group. It shows you the exact month where users hit a wall. If you see a massive drop at Month 3 across all cohorts, you have a 90-day lifecycle problem. Your users are running out of value after three months, and you need to build mid-game features.
5. The Rookie Mistake: Survivorship Bias & Data Delays
There is one major trap you must avoid when sharing these dashboards with stakeholders: Incomplete Time Periods.
If today is April 20th, the “Month 0” data for the April cohort is incomplete. If you plot it blindly, it will look like the April cohort is performing terribly compared to March, which had a full 31 days to log activity. Your executives will panic.
Always filter out the current, incomplete time period in your BI tool, or add a strict WHERE clause in your SQL to only analyze fully completed months.
Stop relying on MAU. Implement a cohort model, find out exactly when your users are leaving, and start building features that actually plug the leak.
메타데이터
- post_id
- bb98b1d5609a
- slug
- vanity-metrics-are-lying-to-you-the-engineers-guide-to-cohort-analysis-bb98b1d5609a
- url
- https://medium.com/@iftikharliaquat1995/vanity-metrics-are-lying-to-you-the-engineers-guide-to-cohort-analysis-bb98b1d5609a
- canonical_url
- https://medium.com/@iftikharliaquat1995/vanity-metrics-are-lying-to-you-the-engineers-guide-to-cohort-analysis-bb98b1d5609a
- author_url
- https://medium.com/@iftikharliaquat1995
- status
- ok
- fetched_at
- 2026-06-09 15:37:30