Building a Production-Grade Observability Stack on EKS: Istio + Prometheus + Grafana + Tempo +…
How we wired together a full distributed tracing, metrics, and service mesh visibility platform on Kubernetes and every hard-won lesson…
Building a Production-Grade Observability Stack on EKS: Istio + Prometheus + Grafana + Tempo + Kiali
How we wired together a full distributed tracing, metrics, and service mesh visibility platform on Kubernetes and every hard-won lesson along the way.
Introduction
Modern microservice architectures are powerful, but they introduce a fundamental problem: when something breaks, where do you look? A single user request might touch ten services before returning a response. A 500ms latency spike could originate in any one of them. Without the right tooling, debugging production issues becomes a slow, manual process of grepping logs across dozens of pods.
This is the problem observability solves.
In this post, I’ll walk through the complete setup of a production-grade observability stack on Amazon EKS, covering:
- Istio: service mesh with automatic traffic interception and trace generation
- Prometheus: metrics collection and storage
- Grafana: unified visualization for metrics and traces
- Grafana Tempo: distributed trace storage backend (with S3)
- Kiali: live service mesh graph and topology visualization
By the end, you’ll understand not just how to set this up, but why each component exists, how they talk to each other, and how this entire stack helps you find bottlenecks and debug issues in seconds instead of hours.
The Architecture at a Glance
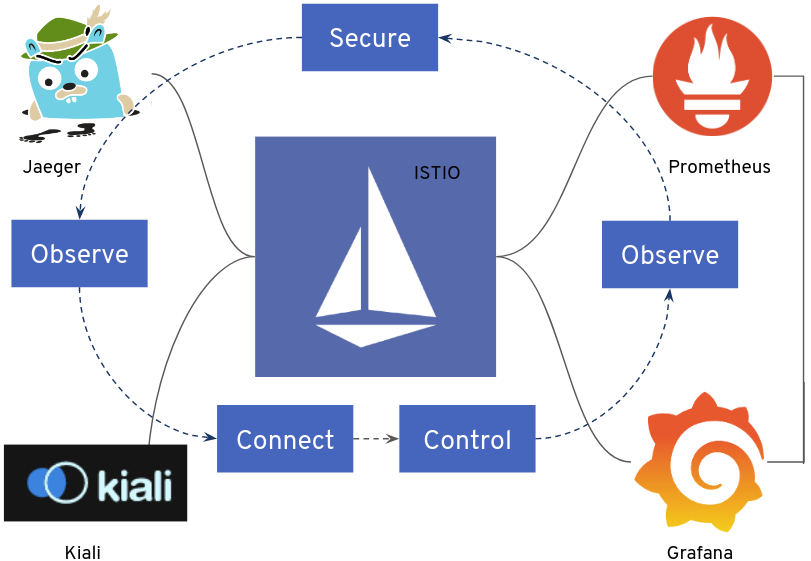
Before diving in, here is the complete picture of what we built and how every component connects:

Every component has a single, well-defined responsibility. Nothing is redundant, remove any one of them and you lose a critical dimension of visibility.
Component Deep Dive
1. Istio: The Service Mesh
Istio is the foundation of the entire stack. Without it, you’d have to instrument every application manually to get metrics and traces. Istio makes observability automatic.
How it works:
When you label a namespace with istio-injection=enabled, Istio's mutating webhook intercepts every new pod creation and injects an additional container istio-proxy running the Envoy proxy. An init container sets up iptables rules so that all network traffic in and out of the pod is redirected through Envoy before reaching the application.
Your application never changes. It still binds to localhost:8080 and makes normal outbound calls. Envoy handles everything transparently.
What Envoy does with the traffic:
- mTLS enforcement: All pod-to-pod communication is automatically encrypted and mutually authenticated. Even if a pod is compromised, it cannot impersonate another service.
- Trace span generation: For every inbound HTTP/gRPC request, Envoy creates a trace span with timing, status code, source, and destination. It forwards this span to Tempo via the Zipkin protocol on port 9411.
- Metrics exposure: Envoy exposes detailed request metrics at
localhost:15090/stats/prometheuson each pod, including request counts, latency histograms, and error rates.
Key Helm configuration:
# istiod-values.yaml
meshConfig:
  enableTracing: true
  defaultConfig:
    tracing:
      sampling: 100    # 100% for testing; use 10% in production
      zipkin:
        address: tempo-distributor.observability.svc.cluster.local:9411
    holdApplicationUntilProxyStarts: true
  outboundTrafficPolicy:
    mode: REGISTRY_ONLY    # Blocks unknown outbound traffic — security best practice
Key insight: holdApplicationUntilProxyStarts: true prevents a race condition where your application starts sending traffic before Envoy is ready, causing dropped spans at startup.
2. Prometheus: Metrics Collection
Prometheus is a pull-based time-series database. It periodically scrapes HTTP endpoints that expose metrics in the OpenMetrics format, stores them with timestamps, and makes them queryable via PromQL.
What it scrapes in this setup:
- Istio’s Envoy sidecars (
istio_requests_total,istio_request_duration_milliseconds, etc.) - Kubernetes node and pod metrics via
kube-state-metricsandnode-exporter - Tempo’s own operational metrics (ingestion rate, block flush times)
- Kiali’s health computation metrics
Prometheus is deployed via the kube-prometheus-stack Helm chart in the monitoring namespace, which bundles Prometheus, Alertmanager, and several pre-built Kubernetes dashboards.
What Prometheus does NOT do:
Prometheus only handles numbers, it has no concept of individual requests or traces. That’s Tempo’s job. The two systems are complementary, not overlapping.
3. Grafana Tempo: Distributed Trace Storage
Tempo is the heart of our tracing setup. It receives spans from Istio, stores them in S3, and serves trace queries to Grafana and Kiali.
Why Tempo over Jaeger or Zipkin?

Tempo is index-free by design, it stores raw trace data as parquet files in S3 and uses bloom filters for fast lookup. This means storage cost is simply your S3 bill, not an expensive database cluster.
Tempo’s distributed components:
In production, Tempo runs as separate microservices that form a ring using a gossip protocol called memberlist:
distributor → receives incoming spans, routes to ingesters ingester → buffers spans in memory + WAL, flushes to S3 compactor → merges and compacts old S3 blocks, enforces retention querier → handles trace lookup, reads from S3 query-frontend→ the public API that Grafana and Kiali query
The memberlist problem, and the full error journey:
This was by far the most painful part of the entire setup. What looked like a simple configuration problem turned into a multi-layered debugging marathon spanning five distinct errors. Each fix revealed the next problem. Here is the complete journey, in the exact order it happened.
Error 1: invalid service state: Stopping, expected: Running
The very first error we saw, happening within milliseconds of every pod starting:
level=error caller=app.go:228 msg="module failed" module=memberlist-kv
err="starting module memberlist-kv: invalid service state: Stopping, expected: Running"
level=info caller=app.go:214 msg="Tempo stopped"
The symptom was deceptive, all pods were in CrashLoopBackOff but the logs showed no obvious root cause. The process was starting and dying in under 1 millisecond. This ruled out networking issues, DNS, or S3 connectivity. Something was failing before Tempo even attempted to bind a port.
My first hypothesis was that memberlist was failing to bind port 7946. I suspected Istio’s mTLS was intercepting the gossip traffic. I applied a PeerAuthentication exception for port 7946 and pod annotations to exclude it from iptables:
global:
  podAnnotations:
    traffic.sidecar.istio.io/excludeInboundPorts: "7946"
    traffic.sidecar.istio.io/excludeOutboundPorts: "7946"
This made no difference. After checking the namespace labels, I confirmed Istio injection was never enabled on the observability namespace, the sidecars were never there in the first place. Istio was not the cause.
The real cause only became visible when we ran the logs without filtering:
level=warn caller=module_service.go:118 msg="module failed with error" module=memberlist-kv
err="service memberlist_kv failed: failed to create memberlist:
Failed to get final advertise address: no private IP address found,
and explicit IP not provided"
The actual underlying error was being swallowed by the generic invalid service state message. Our EKS cluster uses pod IPs in the 40.40.x.x range. Memberlist's address auto-detection scans all network interfaces, finds 40.40.x.x, and rejects it because it is not in an RFC 1918 private range (10.x.x.x, 172.16-31.x.x, 192.168.x.x). With no valid IP to advertise, memberlist fails to initialize and immediately transitions to Stopping state before the module manager can register it as Running producing the misleading error message.
Error 2: field bindPort not found in type memberlist.KVConfig
With the root cause identified, I added a memberlist block to tempo.extraConfig:
tempo:
  extraConfig: |
    memberlist:
      bind_port: 7946        # ← wrong: using string block (pipe)
      bind_addr: ["0.0.0.0"]
The pods immediately crashed with a new error:
failed parsing config: failed to parse configFile /conf/tempo.yaml:
yaml: unmarshal errors:
  line 53: field bindPort not found in type memberlist.KVConfig
The problem was twofold. First, I used | (a YAML string block) for extraConfig, which made the entire value a raw string. Tempo's YAML parser then double-deserialised it and rejected the camelCase field names. Second, even with correct syntax, Go's YAML unmarshaler is strict, all config fields use snake_case, not camelCase. bindPort → bind_port, bindAddr → bind_addr.
Fixed syntax:
tempo:
  extraConfig:        # ← YAML object, not a string block — no pipe character
    memberlist:
      bind_port: 7946
      bind_addr:
        - "0.0.0.0"
Error 3: flag provided but not defined: -memberlist.bind-addr
Config parsing was now succeeding, but I still needed to pass advertise_addr to memberlist. Based on general Kubernetes patterns, I tried passing it as a CLI flag via extraArgs:
ingester:
  extraArgs:
    - -memberlist.bind-addr=$(POD_IP)
Every pod immediately failed:
flag provided but not defined: -memberlist.bind-addr
Usage of /tempo: ...
Checking the actual Tempo v2.9.0 flag reference, -memberlist.bind-addr does not exist as a CLI flag. The valid memberlist flags are only -memberlist.bind-port and -memberlist.host-port. The bind_addr field only exists in the config file, not as a CLI flag. I removed all extraArgs for memberlist.
Error 4 — tempo.extraConfig is silently ignored
With flags removed and config in extraConfig, I expected the memberlist block to be configured correctly. But checking the rendered ConfigMap after every helm upgrade showed the same output every time:
memberlist:
  bind_addr: []          # ← our override never appeared
  bind_port: 7946
  join_members:
    - dns+tempo-gossip-ring:7946    # ← default, not our value
The grafana/tempo-distributed chart (v1.61.3) generates the entire memberlist block from its own Helm template. When you provide values in tempo.extraConfig, the chart performs a shallow merge at the top level. Because memberlist already exists as a key in the base template, the chart's value wins and your override is silently dropped. There is no error, no warning, your config simply never reaches the pod.
This forced me to bypass Helm entirely. I wrote a Python post-install patch script that directly modifies the generated ConfigMap after each helm upgrade:
# patch-tempo-config.sh — run after every helm upgrade
python3 -c "
import json, subprocess

result = subprocess.run(
    ['kubectl', 'get', 'cm', 'tempo-config', '-n', 'observability', '-o', 'json'],
    capture_output=True, text=True
)
cm = json.loads(result.stdout)
yaml_content = cm['data']['tempo.yaml']

if 'advertise_addr' in yaml_content:
    print('Already patched, skipping')
    exit(0)

yaml_content = yaml_content.replace(
    'bind_addr: []',
    'bind_addr:\n  - \"0.0.0.0\"'
)
yaml_content = yaml_content.replace(
    'bind_port: 7946',
    'advertise_addr: \"\${POD_IP}\"\n  advertise_port: 7946\n  bind_port: 7946'
)
patch = json.dumps({'data': {'tempo.yaml': yaml_content}})
subprocess.run(
    ['kubectl', 'patch', 'cm', 'tempo-config', '-n', 'observability',
     '--type=merge', '-p', patch],
    check=True
)
print('Done')
"
kubectl rollout restart deployment -n observability -l app.kubernetes.io/name=tempo
kubectl rollout restart statefulset -n observability -l app.kubernetes.io/name=tempo
The ${POD_IP} variable gets substituted at runtime because I also added -config.expand-env=true to each component's extraArgs, telling Tempo to expand environment variables when reading the config file.
This worked, pods came up healthy. But it introduced a fragile dependency: every helm upgrade overwrites the ConfigMap and requires re-running the patch script.
Error 5: Maximum connections must be greater than 0
With Tempo running, I noticed memcached was crashlooping with:
Maximum connections must be greater than 0The cause was subtle. To apply -config.expand-env=true to all Tempo components at once, I had added it to global.extraArgs. Looking at the chart's scope documentation:
# scope: admin-api, compactor, distributor, ingester, memcached, ...
extraArgs: []
global.extraArgs applies to memcached as well. Memcached is a completely different binary, it does not understand Tempo's CLI flags. When it received -config.expand-env=true as an argument, its own argument parser failed, which caused the connection limit to be parsed as 0, which memcached immediately rejected.
The fix was to remove -config.expand-env=true from global.extraArgs and add it explicitly to each Tempo component, leaving memcached's extraArgs containing only valid memcached flags:
# ✅ Per-component — never global
ingester:
  extraArgs:
    - -config.expand-env=true
distributor:
  extraArgs:
    - -config.expand-env=true
querier:
  extraArgs:
    - -config.expand-env=true
compactor:
  extraArgs:
    - -config.expand-env=true
queryFrontend:
  extraArgs:
    - -config.expand-env=true

# ✅ memcached gets only its own flags
memcached:
  extraArgs:
    - -c 1024    # max connections
    - -m 1024    # memory limit in MB
The permanent fix: migrating to grafana-community/tempo-distributed
The patch script solved the problem but was not a sustainable solution. Every helm upgrade required running it manually, and it was a fragile text manipulation on a YAML file.
The root cause was the chart itself. grafana/tempo-distributed was deprecated in January 2026 and moved to grafana-community/helm-charts. The community chart introduced tempo.structuredConfig a deep merge that takes precedence over the chart's base config at the field level, not the top level. This is exactly what extraConfig should have done but never did.
After migrating:
helm repo add grafana-community https://grafana-community.github.io/helm-charts
helm repo update
helm uninstall tempo -n observability
helm install tempo grafana-community/tempo-distributed \
  -n observability -f tempo-values.yaml
The values became clean:
tempo:
  structuredConfig:
    memberlist:
      bind_addr:
        - "0.0.0.0"
      advertise_addr: "${POD_IP}"    # ✅ properly deep-merged, takes precedence
      advertise_port: 7946
      join_members:
        - dns+tempo-gossip-ring.observability.svc.cluster.local:7946
The ConfigMap now shows the correct values after install. No patch script. No manual intervention after upgrades. The error that started as a cryptic one-liner turned out to require understanding RFC 1918 address ranges, Helm merge strategies, Go YAML unmarshaling, Tempo’s CLI flag surface, and how global.extraArgs scoping works in this specific chart. Each layer had to be peeled back before the next one became visible.
S3 backend and IRSA configuration:
storage:
  trace:
    backend: s3
    s3:
      bucket: eks-tempo-traces-bucket
      region: us-west-2
      endpoint: s3.us-west-2.amazonaws.com
Authentication uses IRSA (IAM Roles for Service Accounts) the Tempo service account is annotated with an IAM role ARN, and EKS automatically injects temporary credentials via a projected service account token. No static AWS credentials are ever stored in the cluster.
serviceAccount:
  annotations:
    eks.amazonaws.com/role-arn: "arn:aws:iam::ACCOUNT_ID:role/TempoS3Role"
4. Grafana: Unified Visualization
Grafana is the single pane of glass for the entire observability stack. It connects to both Prometheus (for metrics) and Tempo (for traces) as datasources and provides:
- Dashboards: pre-built and custom panels for Istio service metrics, Kubernetes cluster health, Tempo ingestion stats
- Explore: ad-hoc query interface for both metrics (PromQL) and traces (TraceQL)
- Datasource linking: trace IDs embedded in metric panels (exemplars) let you jump from a latency spike directly to the trace that caused it
Tempo datasource configuration in Grafana:
# grafana-tempo-datasource.yaml
apiVersion: v1
kind: ConfigMap
metadata:
  name: grafana-tempo-datasource
  namespace: monitoring
  labels:
    grafana_datasource: "1"
data:
  tempo-datasource.yaml: |
    apiVersion: 1
    datasources:
      - name: Tempo
        type: tempo
        url: http://tempo-query-frontend.observability.svc.cluster.local:3200
        access: proxy
        isDefault: false
Querying traces in Grafana Explore:
# Find all traces from the frontend service
{ resource.service.name = "frontend.default" }

# Find slow traces (over 500ms)
{ duration > 500ms }

# Find traces with errors
{ status = error }

# Find traces for a specific endpoint
{ .http.url =~ ".*checkout.*" && duration > 200ms }
5. Kiali: Service Mesh Observability Console
Kiali is the live operational view of your service mesh. It answers questions that neither Grafana nor raw logs can answer easily:
- Which services are talking to each other right now?
- Which service is the source of elevated error rates?
- Is mTLS enforced on all connections?
- Are my Istio configs (VirtualServices, DestinationRules) valid?
How Kiali gets its data:
Kubernetes API  → knows what services, deployments, and Istio configs exist
Prometheus      → knows traffic rates, error rates, latency per service pair
Tempo           → links each service node to its distributed traces
Kiali combines these three sources into a real-time graph where:
- Each node is a service or workload
- Each edge is live traffic with RPS, error rate, and latency
- Colors indicate health (green = healthy, red = errors, yellow = degraded)
- Clicking any node opens the Tempo traces for that service inline
Kiali Helm configuration connecting all services:
helm install kiali-server kiali/kiali-server \
  -n istio-system \
  --set auth.strategy=anonymous \
  --set external_services.prometheus.url="http://prometheus-kube-prometheus-prometheus.monitoring.svc.cluster.local:9090" \
  --set external_services.tracing.enabled=true \
  --set external_services.tracing.internal_url="http://tempo-query-frontend.observability.svc.cluster.local:3200" \
  --set external_services.tracing.provider=tempo \
  --set external_services.tracing.use_grpc=false \
  --set external_services.grafana.enabled=true \
  --set external_services.grafana.internal_url="http://prometheus-grafana.monitori
The Complete Request Lifecycle
Let’s trace exactly what happens when a user hits your application — and how this stack captures every detail:
Step 1: Request enters the cluster
User browser → AWS Load Balancer → Istio Ingress Gateway → frontend podThe Istio Ingress Gateway is the entry point. It routes the request to the frontend service based on your VirtualService configuration.
Step 2: Envoy intercepts and starts tracing
The frontend pod’s Envoy sidecar intercepts the inbound request. It:
- Checks mTLS certificate of the caller
- Creates a root span with a unique
traceID - Adds trace context headers (
X-B3-TraceId,X-B3-SpanId,traceparent) to the request before forwarding it to your application
Step 3: Application makes downstream calls
Your frontend application calls the backend service. Envoy intercepts this outbound call and:
- Creates a child span using the same
traceID - Injects trace headers into the outbound request
- The backend pod’s Envoy receives the request, reads the trace headers, and creates another child span
This trace context propagation is what links all the spans from different services into a single trace tree.
Step 4: Spans are sent to Tempo
As each request completes, Envoy sends the completed span to Tempo’s distributor on port 9411 (Zipkin protocol). The distributor:
- Validates and routes the span to one of the ingesters based on a consistent hash of the
traceID - The ingester buffers the span in memory and writes it to a WAL (Write-Ahead Log) for durability
- Every 30 minutes, the ingester cuts a block and flushes it to S3 as parquet files
Step 5: Metrics are scraped
Simultaneously, Prometheus scrapes the Envoy sidecar’s metrics endpoint every 15 seconds. It records:
istio_requests_total{
  source_app="frontend",
  destination_app="backend",
  response_code="200"
} = 1547
Step 6: You query the data
When you open Kiali or Grafana to investigate an issue:
Kiali graph      ← Prometheus (traffic rates per service pair)
                 ← Kubernetes API (topology)
                 ← Tempo (trace links per service)

Grafana Explore  ← Tempo query-frontend (trace search by service/duration/status)
                 ← Prometheus (correlated metrics)
How This Stack Helps You Find Issues
Scenario 1: Latency spike
Your Grafana dashboard shows p99 latency for the checkout service jumped from 80ms to 2400ms at 14:32.
Investigation path:
- Grafana → Explore → Tempo query:
{ resource.service.name = "checkout" && duration > 1s } - Click any slow trace → see the full span waterfall
- The waterfall shows
payment-serviceis taking 2300ms — all other spans are normal - Kiali → Services → payment-service → Traces tab → confirms the pattern
- Drill into a payment-service trace → see it’s waiting on a database span for 2200ms
- Root cause: a missing database index causing a full table scan
Without this stack: You’d grep logs across multiple pods, manually correlate timestamps, and probably spend 2–3 hours finding what took 5 minutes above.
Scenario 2: Intermittent 503 errors
Your error rate dashboard shows 0.3% of requests to the frontend are returning 503s, but only from certain source IPs.
Investigation path:
- Kiali graph → frontend node → red edge to
product-catalog - Click the edge → see 0.3% error rate on that specific service pair
- Kiali → Istio Config → check DestinationRule for product-catalog
- Found: a circuit breaker with
consecutiveGatewayErrors: 1set too aggressively - Tempo query:
{ .http.status_code = 503 }→ traces show circuit breaker trips - Fix: adjust circuit breaker threshold
Scenario 3: A deployment caused a regression
You deployed a new version of the recommendation service. Within minutes, Kiali’s graph turns yellow on that service.
Investigation path:
- Kiali → Workloads → recommendation-v2 → Metrics tab
- See error rate jumped from 0% to 4% immediately after deploy
- Tempo query:
{ resource.service.name = "recommendation" && status = error } - Trace detail shows a NullPointerException in the span attributes
- Immediate rollback:
kubectl rollout undo deployment/recommendation
Key Lessons Learned
1. EKS pod IP ranges matter for memberlist. If your VPC uses non-RFC 1918 CIDR blocks for pods, Tempo’s memberlist will fail to start silently. Always inject POD_IP via the Downward API and configure advertise_addr explicitly.
2. Never use global.extraArgs for Tempo-specific flags. The scope includes memcached, which will misinterpret Tempo CLI flags and crash.
3. Deprecated charts have real technical limitations. The grafana/tempo-distributed chart's shallow merge for extraConfig is a design flaw that forces workarounds. The community chart's structuredConfig with deep merge is the correct solution.
4. Start with 100% sampling for testing, then reduce. You need to verify traces are flowing before you can debug sampling configuration. Always test at 100% first, then drop to 1–10% for production based on your volume and S3 budget.
5. IRSA is the right way to give Tempo S3 access. No IAM user credentials, no static access keys, just a service account annotation and an IAM role trust policy. Credentials rotate automatically.
6. holdApplicationUntilProxyStarts: true is essential. Without it, your application emits requests before Envoy is ready, those spans are never captured, and you get gaps in your traces especially during pod restarts.
The Final Helm Values Reference
tempo-values.yaml (production-ready):
serviceAccount:
  create: true
  name: tempo
  annotations:
    eks.amazonaws.com/role-arn: "arn:aws:iam::ACCOUNT_ID:role/TempoS3Role"

storage:
  trace:
    backend: s3
    s3:
      bucket: your-tempo-traces-bucket
      region: us-west-2
      endpoint: s3.us-west-2.amazonaws.com

traces:
  otlp:
    grpc:
      enabled: true
    http:
      enabled: true
  zipkin:
    enabled: true

global:
  extraEnv:
    - name: POD_IP
      valueFrom:
        fieldRef:
          fieldPath: status.podIP

tempo:
  structuredConfig:
    memberlist:
      bind_addr:
        - "0.0.0.0"
      advertise_addr: "${POD_IP}"
      advertise_port: 7946
      join_members:
        - dns+tempo-gossip-ring.observability.svc.cluster.local:7946

ingester:
  replicas: 2
  extraArgs:
    - -config.expand-env=true

distributor:
  replicas: 2
  extraArgs:
    - -config.expand-env=true

querier:
  replicas: 2
  extraArgs:
    - -config.expand-env=true

compactor:
  replicas: 1
  extraArgs:
    - -config.expand-env=true
  config:
    compaction:
      block_retention: 720h    # 30 days

queryFrontend:
  extraArgs:
    - -config.expand-env=true

memcached:
  enabled: true
  extraArgs:
    - -c 1024
    - -m 1024
What’s Next
This stack gives you a solid observability foundation. Here is what to build on top of it:
OpenTelemetry Collector as a buffer: Put an OTel Collector between Istio and Tempo. It adds batching, retry logic, and the ability to fan out to multiple backends (Tempo + Datadog simultaneously) without changing any application config.
Application-level instrumentation: Istio only traces the network hop between services. To see database queries, cache hits, and external API calls inside your code, add the OpenTelemetry SDK to your applications. The trace context Istio propagates via HTTP headers links application spans to Istio spans automatically.
Trace-to-metrics exemplars: Configure Prometheus to scrape exemplars from your applications. Each metric data point can carry a trace_id, letting you jump from a Grafana latency spike directly to the trace responsible for it.
Alertmanager rules on Istio metrics: Create alerts on istio_requests_total error rates:
- alert: ServiceHighErrorRate
  expr: |
    rate(istio_requests_total{response_code=~"5.."}[5m])
    / rate(istio_requests_total[5m]) > 0.01
  for: 2m
  annotations:
    summary: "{{ $labels.destination_service }} error rate > 1%"
Tempo metrics-generator: Enable Tempo’s built-in metrics generator to derive RED metrics (Rate, Errors, Duration) directly from trace data, without any Prometheus instrumentation on your applications.
Conclusion
What we built is not just a monitoring setup, it’s a unified observability platform that gives you three complementary views of your system simultaneously:
- Metrics (Prometheus + Grafana) tell you something is wrong
- Traces (Tempo + Grafana Explore) tell you exactly where and why
- Service mesh graph (Kiali) tells you which services are affected and how they’re connected
The combination of these three means that when your on-call engineer gets paged at 2am, they have everything they need in a single browser tab, the latency graph, the offending trace, and the service topology to diagnose and fix the issue in minutes.
The hardest part wasn’t the architecture. It was the details: non-RFC 1918 pod IPs breaking memberlist, Helm chart shallow merges silently dropping config, CLI flags bleeding into the wrong binary. These are the kinds of problems that documentation doesn’t warn you about. Hopefully this post saves you the hours we spent finding each one.
All Helm charts and values files referenced in this post are available in the configuration snippets above. The setup was validated on EKS 1.29 with Istio 1.21, Tempo 2.10.4, Prometheus 2.x (kube-prometheus-stack), Grafana 10.x, and Kiali 2.x.
Tags: kubernetes eks istio observability distributed-tracing grafana prometheus tempo kiali devops platform-engineering service-mesh
메타데이터
- post_id
- bbb06fa4a4eb
- slug
- building-a-production-grade-observability-stack-on-eks-istio-prometheus-grafana-tempo-bbb06fa4a4eb
- url
- https://medium.com/@abhinavdadhich833/building-a-production-grade-observability-stack-on-eks-istio-prometheus-grafana-tempo-bbb06fa4a4eb
- canonical_url
- https://medium.com/@abhinavdadhich833/building-a-production-grade-observability-stack-on-eks-istio-prometheus-grafana-tempo-bbb06fa4a4eb
- author_url
- https://medium.com/@abhinavdadhich833
- status
- ok
- fetched_at
- 2026-06-24 18:57:25


