Migrating SSAS Tabular Models to Snowflake with Cortex Code: A Complete Walkthrough
If you have been asked to migrate your SSAS Tabular models to Snowflake and are wondering where to even start — this post is for you.
Migrating SSAS Tabular Models to Snowflake with Cortex Code: A Complete Walkthrough
If you have been asked to migrate your SSAS Tabular models to Snowflake and are wondering where to even start — this post is for you.
Migrating SSAS Tabular is uniquely challenging because there is no one-to-one mapping in Snowflake. SSAS is not just a database — it is a tightly integrated semantic engine where the data model, query language, security rules, and BI connectivity are all fused together. When you try to move it somewhere else, you are immediately confronted with questions that do not have obvious answers:
- Where do DAX measures go? There is no CREATE MEASURE in SQL. Do you rewrite them as SQL views? Stored procedures? Something else entirely?
- What replaces VertiPaq? SSAS serves sub-second queries from in-memory columnar storage. A standard data warehouse will not match that latency without specific architectural choices.
- How do you handle relationships? SSAS models have declared relationships that drive automatic filter propagation. SQL databases use explicit JOINs. Who writes the JOINs, and where do they live?
- What about calculated columns that reference other tables? RELATED() in DAX traverses relationships at row level. There is no equivalent syntax in SQL — you need JOINs baked into views.
- How do 200 Power BI reports keep working? They expect exact table names, exact column names, exact measure names. Change one alias and you have broken dashboards across the org.
- What happens to row-level security? DAX filter expressions like [Region] = USERNAME() need to become something Snowflake understands.
Without Cortex Code, you would be looking at weeks of manual work — writing SQL for every DAX measure, building views to preserve column names, manually mapping relationships, and hoping nothing breaks when Power BI reconnects. There is no standard tooling for this. No SnowConvert equivalent for SSAS as of now. No “export to Snowflake” button in SSMS.
Snowflake’s Cortex Code changes that equation. Its skill-based approach turns this into a guided, automated workflow — the AI handles the DAX-to-SQL translation, the column reconciliation, the semantic view generation, and the Power BI view creation. You focus on reviewing and approving decisions, not writing boilerplate.
This post walks through a migration I ran using Cortex Code ssas-tabular-migration custom skill. In this blog the focus is on what the skill actually does, the architecture decisions it makes, and the artifacts it produces. I will show what worked, what tripped me up, and the workflow that took a 7-table model with 100 million rows and 23 DAX measures from SSAS to Snowflake.
GitHub link for custom skill — https://github.com/sfc-gh-praj/cortex-skills/tree/main/ssas-tabular-migration
Migration Skill: One Input, Three Outputs
The ssas-tabular-migration skill is a custom Cortex Code skill that orchestrates the entire SSAS migration workflow. You point it at your SSAS model .bim or .xmla file, and it gives you three production-ready outputs:
- Schema DDL — Your tables deployed as Snowflake views, regular tables, or Interactive Tables depending on your latency and concurrency requirements.
- Power BI Views — DirectQuery-ready views so your existing PBI reports can reconnect with zero changes
- Semantic View — A Cortex Analyst-compatible semantic layer (so you can query your data in plain English)
One skill. Three outputs. Your SSAS model fully migrated.
Here is what you type:
Migrate my SSAS Tabular model to SnowflakeThat is all you need. You provide the path to your .bim or .xmla file, and the skill takes over.
Migration Flow
The skill runs a 9-phase, fully resumable workflow:
- Assess — Parse your BIM/XMLA file, extract tables, measures, relationships, hierarchies
- Workload Score — Score each table for Interactive Table vs Regular Table suitability
- DAX DAG — Build a dependency graph of all measures (because [Total Sales] depends on [Unit Price] × [Quantity], and you need to translate them in order)
- Migration Plan — Generate a human-readable markdown plan explaining exactly what is about to happen
- Schema DDL — Create Interactive Tables with CLUSTER BY keys and auto-refresh
- DAX Translation — Convert DAX measures to SQL (pattern matching + Cortex LLM for the gnarly ones)
- Semantic View — Build and deploy the YAML semantic model for Cortex Analyst
- Power BI Views — Create migration views matching your original SSAS schema exactly
- Security & Validate — Map RLS/OLS rules and run validation queries
And here is the kicker: you can pause at any phase. Every phase has a human-in-the-loop approval gate. You review, you approve, you proceed. No black boxes.
The SSAS → Snowflake Concept Map
One of the hardest parts of any migration is the mental model shift. What do SSAS concepts become in Snowflake?
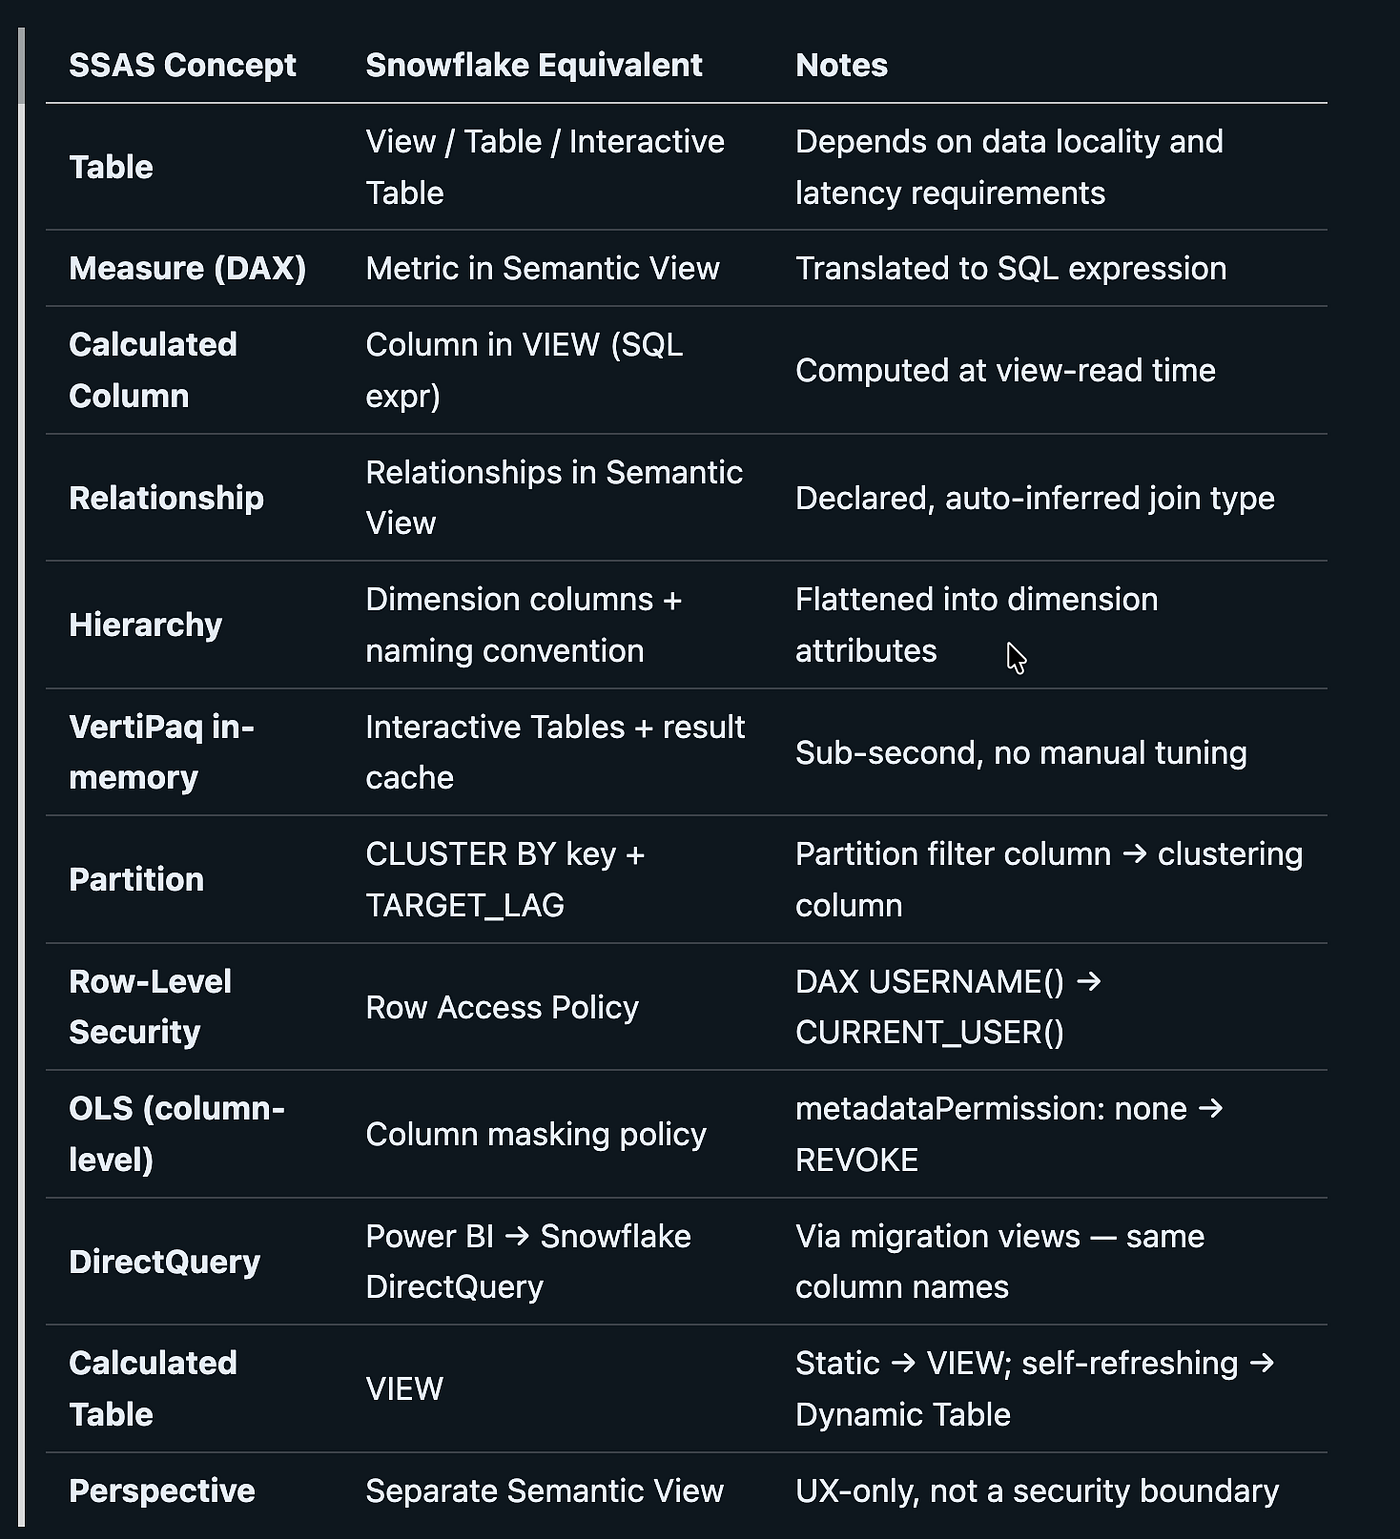
This is the mapping the skill implements.
Demo: The Internet Sales Tabular Model
To test the skill, I set up a migration scenario using the AdventureWorksDW2022 Internet Sales model — scaled to 100 million rows in the fact table. Here is how it played out.
Source model: InternetSales_updated.xmla from AdventureWorksDW2022 Tables: 7 (including FactInternetSales with 100,060,398 rows — 3.9 GB) Measures: 23 (mix of simple aggregations and compound time intelligence) Calculated Columns: 4 Relationships: 8 Hierarchies: 4
Phase 1–3: Assessment
The skill parsed the .xmla and immediately flagged:
- 27 DAX expressions to translate (23 measures + 4 calculated columns)
- 136-node dependency graph with 40 edges
- 10 compound measures (measures that reference other measures — the tricky ones)
It also enriched the inventory with actual Snowflake row counts since our data was already loaded:
FACTINTERNETSALES:      100,060,398 rows  (3,993.71 MB)
DIMCUSTOMER:                 50,000 rows  (2.95 MB)
DIMPRODUCT:                  20,000 rows  (2.76 MB)
DIMPRODUCTCATEGORY:          20,000 rows  (0.38 MB)
DIMPRODUCTSUBCATEGORY:       20,000 rows  (0.43 MB)
DIMGEOGRAPHY:                   655 rows  (0.02 MB)
DIMDATE:                      3,652 rows  (0.05 MB)
The skill also performed column reconciliation — mapping each SSAS column name to its Snowflake physical name. This is critical because SSAS models often rename columns (e.g. FullDateAlternateKey becomes Date in the model). Without this mapping, your semantic view would reference columns that don’t exist.
Phase 4–5: Schema DDL — Views Over Existing Tables
Since the data was already in Snowflake (in the DBO schema), the skill was smart enough to emit CREATE VIEW statements instead of CREATE TABLE — zero data movement:
-- Source data already in Snowflake — wrapping as a view
CREATE OR REPLACE VIEW ADW2022_LOAD_MILLION_ROWS_FORBLOG.powerbi.FACTINTERNETSALES AS
SELECT
    PRODUCTKEY, ORDERDATEKEY, DUEDATEKEY, SHIPDATEKEY, CUSTOMERKEY,
    PROMOTIONKEY, CURRENCYKEY, SALESTERRITORYKEY, SALESORDERNUMBER,
    SALESORDERLINENUMBER, REVISIONNUMBER, ORDERQUANTITY, UNITPRICE,
    EXTENDEDAMOUNT, UNITPRICEDISCOUNTPCT, DISCOUNTAMOUNT,
    PRODUCTSTANDARDCOST, TOTALPRODUCTCOST, SALESAMOUNT, TAXAMT,
    FREIGHT, CARRIERTRACKINGNUMBER, CUSTOMERPONUMBER, ORDERDATE, DUEDATE, SHIPDATE,
    SALESAMOUNT - TOTALPRODUCTCOST AS "Margin"  -- calculated column, inline SQL
FROM ADW2022_LOAD_MILLION_ROWS_FORBLOG.dbo.FACTINTERNETSALES;
Notice that Margin (a calculated column with DAX [SalesAmount]-[TotalProductCost]) is resolved inline in the view definition. No separate calculation step needed.
The CLUSTER BY rationale is worth explaining — the skill maps it directly from how VertiPaq processes your DAX:
In SSAS, VertiPaq uses dictionary-based column lookups when a filter runs (e.g. CALCULATE([Revenue], DimDate[Year] = 2024)). Snowflake achieves equivalent selectivity through micro-partition pruning. The columns that VertiPaq filters via dictionary lookups are the same columns that should be Snowflake CLUSTER BY keys.
So ORDERDATEKEY becomes a cluster key because every time intelligence DAX expression filters on it.
When Latency Requirements Are Strict: Interactive Tables
For scenarios where sub-second query response is non-negotiable (high-concurrency dashboards, 100+ concurrent users), the skill also provides the option to deploy Interactive Tables instead of views. During the workload assessment phase, it asks about concurrency, query patterns, and response time requirements — and if the scores justify it, generates CREATE INTERACTIVE TABLE DDL with an attached Interactive Warehouse:
CREATE INTERACTIVE TABLE ADW2022_LOAD_MILLION_ROWS.powerbi.FACTINTERNETSALES
  CLUSTER BY (ORDERDATEKEY, DUEDATEKEY, SHIPDATEKEY)
  TARGET_LAG = '1 hour'
  WAREHOUSE = maintenance_wh
AS SELECT * FROM ADW2022_LOAD_MILLION_ROWS.dbo.FACTINTERNETSALES;
CREATE OR REPLACE INTERACTIVE WAREHOUSE bi_serving_wh
TABLES (DIMDATE, DIMGEOGRAPHY, DIMPRODUCT, DIMCUSTOMER, FACTINTERNETSALES)
WAREHOUSE_SIZE = 'MEDIUM';Interactive Tables are Snowflake is the closest equivalent to SSAS VertiPaq in-memory — data is pre-loaded, queries skip disk I/O entirely, and response times stay under a second even at 100M+ rows. The tradeoff: the Interactive Warehouse has a 24-hour minimum auto-suspend, so it’s always-on billing. The skill flags this cost warning and lets you decide.
Phase 6: DAX → SQL Translation
This is where most migration projects die. DAX and SQL are not the same language. At all.
The skill uses a two-tier approach:
Tier 1 — Pattern matching (~25 regex patterns handle the simple stuff):
DAXSQLSUM(Table[Col])SUM(col)DISTINCTCOUNT(Table[Col])COUNT(DISTINCT col)DIVIDE(a, b)IFF(b = 0, NULL, a / b)TODAY()CURRENT_DATE()EOMONTH(d, 0)LAST_DAY(d)
Tier 2 — Cortex LLM (for CALCULATE, FILTER, time intelligence, RELATED, RANKX):
Original DAX:
DaysCurrentQuarterToDate = COUNTROWS( DATESQTD( 'DimDate'[Date]))Translated SQL:
COUNT(DISTINCT IFF(
  Date >= DATE_TRUNC('QUARTER', CURRENT_DATE())
  AND Date <= CURRENT_DATE(), Date, NULL
))
Another example — a calculated column using RELATED() (cross-table lookup):
ProductSubcategoryName = RELATED('DimProductSubcategory'[EnglishProductSubcategoryName])Resolved via LEFT JOIN in the Power BI migration view:
LEFT JOIN DimProductSubcategory dim
    ON p.PRODUCTSUBCATEGORYKEY = dim.PRODUCTSUBCATEGORYKEY
-- Then: dim.ENGLISHPRODUCTSUBCATEGORYNAME AS "ProductSubcategoryName"Results: 2 auto-pattern, 25 via LLM, 0 manual review. Everything passed.
The DAX dependency graph is crucial here — the skill translates measures in topological order. So when [InternetCurrentQuarterSalesPerformance] references [InternetPreviousQuarterSales], the dependency’s SQL is already available as context for the LLM. No metric-referencing-metric errors.
Phase 7: Semantic View — Query Your Data in English
name: internet_sales_updated
tables:
  - name: dimdate
    base_table:
      database: ADW2022_LOAD_MILLION_ROWS_FORBLOG
      schema: dbo
      table: DIMDATE
    dimensions:
      - name: date
        expr: FULLDATEALTERNATEKEY
        data_type: TIMESTAMP
      - name: englishmonthname
        expr: ENGLISHMONTHNAME
        data_type: TEXT
      - name: monthcalendar
        expr: "RIGHT(CONCAT(' ', TO_CHAR(MONTHNUMBEROFYEAR, '00')), 2) || ' - ' || ENGLISHMONTHNAME"
        data_type: TEXT
        data_type: TEXT
    metrics:
      - name: dayscurrentquartertodate
        expr: "COUNT(DISTINCT IFF(Date >= DATE_TRUNC('QUARTER', CURRENT_DATE()) AND Date <= CURRENT_DATE(), Date, NULL))"
Deployed to ADW2022_LOAD_MILLION_ROWS_FORBLOG.POWERBI.INTERNET_SALES_UPDATED — 7 tables, 57 dimensions, 55 facts, 23 metrics, 6 relationships.
Then we tested with Cortex Analyst:
“What are total internet sales?” → $1.75 trillion ✓ (sub-second)
“Show me internet sales by calendar year” → Automatically generates JOIN between FACTINTERNETSALES and DIMDATE, groups by year, sorts descending. No SQL written.
That is the future. Your finance team asking questions in English and getting correct answers. No Power BI, no DAX, just… questions and answers.
Phase 8: Power BI Views — Keep Everything Running
The skill generated 7 Power BI migration views — these use exact SSAS table names and column aliases so existing reports reconnect without modification:
-- Power BI Zero-Break Migration View: DimProduct
-- Resolves RELATED() calculated column via LEFT JOIN
CREATE OR REPLACE VIEW ADW2022_LOAD_MILLION_ROWS_FORBLOG.powerbi.DIMPRODUCT AS
SELECT
    PRODUCTKEY, PRODUCTALTERNATEKEY, PRODUCTSUBCATEGORYKEY,
    ENGLISHPRODUCTNAME, STANDARDCOST, COLOR, LISTPRICE, MODELNAME,
    PRODUCTSTATUS AS "Status",
    dim.ENGLISHPRODUCTSUBCATEGORYNAME AS "ProductSubcategoryName"
FROM ADW2022_LOAD_MILLION_ROWS_FORBLOG.dbo.DIMPRODUCT p
LEFT JOIN ADW2022_LOAD_MILLION_ROWS_FORBLOG.dbo.DIMPRODUCTSUBCATEGORY dim
    ON p.PRODUCTSUBCATEGORYKEY = dim.PRODUCTSUBCATEGORYKEY;
Notice how RELATED(‘DimProductSubcategory’[EnglishProductSubcategoryName]) — a DAX cross-table lookup — becomes a LEFT JOIN in the view. And Status (reserved word in Snowflake) is safely aliased from the physical column PRODUCTSTATUS.
Short-term path: Update Power BI data source from SQL Server → Snowflake powerbi schema. Zero report changes.
Long-term path: Snowflake Semantic View becomes the single source of truth. Power BI connects directly. No DAX duplication.
What About Calculation Groups, KPIs, and Bidirectional Relationships?
These are the questions every SSAS developer asks. Here is how the skill handles them:
Calculation Groups (Compat 1200+)
If your model uses calculation groups (e.g. “Time Intelligence” with items like YTD, PY, PY-YTD), the skill expands them. Each calculation group item × each base measure becomes an individual metric in the semantic view.
So if you have 3 calculation group items and 10 base measures, you get 30 metrics. This is intentional — Snowflake’s semantic views do not have a native “calculation group” concept, so expansion into discrete metrics is the correct translation. The DAX dependency graph ensures they’re translated in the right order.
KPIs
The SSAS model in our demo had 2 KPIs (Internet Revenue and Internet Revenue Growth). In Snowflake, there is no native KPI object. The skill translates the KPI value measure as a regular metric in the semantic view. The goal and status expressions are preserved as annotations/comments in the YAML for reference, but you will need to handle threshold visualization in Power BI or your BI layer.
Bidirectional Relationships
SSAS bidirectional cross-filtering (CrossFilteringBehavior: BothDirections) translates differently depending on where it is consumed:
- Semantic View: relationships are declared — Cortex Analyst infers join type from the data
- Power BI Views: the skill uses INNER JOIN instead of LEFT JOIN when the original relationship was bidirectional
- In practice, most models use bidirectional on bridge tables (many-to-many). Review these joins manually — these are flagged in the migration plan.
Power BI Reconnection
Once the migration is done, your Power BI reports need to point at Snowflake instead of SSAS. Two paths:
Path A: Patch the .bim and deploy to Power BI Premium (Short-term)
This keeps all your DAX measures intact — zero rewriting:
-
Open your .bim in Tabular Editor
-
Update the data source — change the connection from SQL Server to Snowflake.
-
Deploy to Power BI Premium via XMLA endpoint.
4. Update PBIX connections — change from asazure://… to powerbi://api.powerbi.com/…
All measures, relationships, hierarchies travel as-is. The powerbi schema views use exact SSAS column names, so M-queries resolve without mapping.
Path B: DirectQuery to Snowflake (Long-term)
- Open Power BI Desktop → Get Data → Snowflake
- Point to: ADW2022_LOAD_MILLION_ROWS_FORBLOG.powerbi
- Select tables (they match your SSAS table names exactly)
- Rebuild relationships in Model view (or import from your .bim)
- Measures can be recreated in DAX locally, or you rely on the Snowflake Semantic View for metrics
Snowflake Semantic View is the single source of truth. New metrics are defined once in YAML and consumed by both Cortex Analyst and Power BI(in future). No DAX duplication.
Gotchas & Lessons
1. Reserved words will bite you. Our DimDate table had a column literally named Date. The skill caught it and aliased it via FULLDATEALTERNATEKEY AS “Date” in the views. Similarly Status on DimProduct was mapped from the physical PRODUCTSTATUS column. Check your model for DATE, ORDER, STATUS, USER.
2. RELATED() columns need LEFT JOINs. SSAS calculated columns using RELATED() cannot be inlined as simple SQL expressions — they need cross-table joins. The skill detects these and resolves them via LEFT JOIN in the Power BI views.
3. Compound DAX measures need dependency ordering. If you translate [AvgOrderValue] before translating [TotalSales] and [OrderCount] that it depends on, you will get metric-referencing-metric errors in the semantic view. The DAX DAG phase solves this.
4. Data already in Snowflake = zero data movement. When you pass — source-db, the skill emits CREATE VIEW over existing tables instead of CREATE TABLE. No copying, no ETL, just a thin semantic layer on top.
5. Snowflake-only columns are auto-excluded. The source tables had Spanish/French translation columns that were not exposed in the SSAS model. The skill detects these and excludes them from the Power BI views — only SSAS-exposed columns make it through.
Key Takeaways
- One skill handles almost everything — from .bim/.xmla to deployed Snowflake objects. No manual SQL authoring needed.
- DAX translation is the hardest part — Pattern matching for the simple stuff, Cortex LLM for the complex stuff, dependency graph for ordering. 27/27 measures translated, 0 manual review.
- Interactive Tables are the SSAS equivalent — Sub-second queries, auto-refresh, CLUSTER BY derived from your DAX patterns.
- Power BI continuity is non-negotiable — and the migration views handle it. Same column names, same table names, zero report changes.
- The semantic view is the future — Plain English → SQL → results. Once you see it work, you will wonder why we have been writing DAX for a decade.
- The 9-phase flow with approval gates means no surprises — You review, you approve, you proceed. Or you stop and adjust.
How to Get Started
Prerequisites
- Cortex Code CLI installed (download here)
- A Snowflake account with a configured connection
- uv package manager installed (brew install uv or curl -LsSf https://astral.sh/uv/install.sh | sh)
- The ssas-tabular-migration skill installed from GitHub:
  git clone https://github.com/sfc-gh-praj/cortex-skills.git
cp -r cortex-skills/ssas-tabular-migration ~/.snowflake/cortex/skills/- Your SSAS model exported as .bim or .xmla (compatibility level 1200+ required — models below 1200 use the legacy multidimensional format and are not supported)
Steps
- Export your SSAS model as .bim (from Visual Studio/SSDT) or .xmla (from SSMS → Script Database As → CREATE TO → File)
- Launch Cortex Code CLI
- Say: “Migrate my SSAS Tabular model to Snowflake”
- Provide: file path, target schema, Snowflake connection
- Review the migration plan at Phase 4 — then let it rip
The skill generates everything as plain-text files (SQL, YAML, markdown). You can inspect every line, edit anything you disagree with, and re-run specific phases.
If your data is already in Snowflake (migrated from SQL Server), pass the — source-db flag and the skill will create views over existing tables instead of copying data. Zero data movement.
Output Artifacts Generated:
- ssas_inventory.json — parsed model inventory with column reconciliation
- deployment_assessment.json — per-table workload scoring
- dax_dag.json — 136-node DAX dependency graph
- MIGRATION_PLAN.md — full migration plan with CLUSTER BY rationale
- ssas_ddl.sql — schema DDL (7 views over existing DBO tables)
- ssas_measures_translated.json — all 27 DAX → SQL translations
- ssas_semantic_view.yaml — Cortex Analyst semantic model
- powerbi_views.sql — 7 Power BI DirectQuery-ready views
- MIGRATION_MAPPING.md — complete table/column/measure mapping report
References
- Cortex Code CLI — Command-line interface for Cortex Code
- Snowflake Interactive Tables — Sub-second query performance
- Snowflake Semantic Views — Cortex Analyst semantic layer
- Cortex Analyst — Natural language querying
- GitHub Link for SSAS Tabular Model migration Custom Skill
The views and opinions expressed in this post are my own and do not represent those of Snowflake Inc. All technical observations, recommendations, and conclusions are based on my personal experience working with these tools.
메타데이터
- post_id
- bc82a6a04774
- slug
- migrating-ssas-tabular-models-to-snowflake-with-cortex-code-a-complete-walkthrough-bc82a6a04774
- url
- https://medium.com/@phaniraj2112/migrating-ssas-tabular-models-to-snowflake-with-cortex-code-a-complete-walkthrough-bc82a6a04774
- canonical_url
- https://medium.com/@phaniraj2112/migrating-ssas-tabular-models-to-snowflake-with-cortex-code-a-complete-walkthrough-bc82a6a04774
- author_url
- https://medium.com/@phaniraj2112
- status
- ok
- fetched_at
- 2026-06-17 08:20:12