Debugging in Windbg
A Practical Walkthrough of an executable file analyze with WinDbg
Debugging in Windbg
A Practical Walkthrough of an executable file analyze with WinDbg
For the sake of the learning purpose I´ve been playing with the arp.exe and there is absolutely no specific purpose of the choice of the executable beside learning how to debug the windows based executable.
Before diving into the debugging lets cover some important topics to master. At any steps where you would like to clear and have a clean terminal, run the .cls command.
Also, if you want to get a full list of commands you can push “f1” and it will give you a full list of available commands:

There are two different methods of loading the executable into the debugger:

Or you can start it from PowerShell:

To be able to run the Windbg command in my lab machine it was installed with the PowerShell command: winget install Microsoft.WinDbg, the detals can be found *here.*
The executable being loaded into the debugger now, and first thing first lets find out the loaded modules:

You can also run the verbose command “lmv” to get more info about the modules. If you find the “private pdb symbos” then you will for instance get local variables or stuff that normally are not provided by the public symbols, hence those are very interesting to dig into.
Next, getting more info about a specific module which in this case is arp:

Windbg is pretty cool that let you click that blue clickable and it will load tons of info which is really useful.
After getting info about the specific module you can get all exported function call names by examining the module even further:

By using the ‘’ wildcard it will it will dump everything available…*
with “ctrl+f” you can search for the main function:

Found main, lets put the breakpoint on main before running the application

bp for breakpoint and g for go to start executing the process/thread
To find the exports/imports and other file headers of the executable run the dh command:

!dh -? to get the help
And the -f of the executable header that will be useful for later debugging:

Next to see where the call stack is, we can run the ‘k’ command:

If you somehow didn't put the breakpoint on main but rather capturing the call stack and all you see is a lot of ntdlls calls like below, it means that the process is still inside the Windows loader(not always true though) and has not reached the program’s entry point yet:

and most important if you see the ntdll!ntterminateprocess that means: A thread requested the OS to terminate the process and that would have been caused by either:
. main() returning normally
. exitprocess() been called
. exception occured
. a crash triggers process termination or just simply the user terminaed the process
I experienced the termianteprocess several times before i could understand what was causing the executable running away from me that quick :)
Now while mentioning threads, lets jump over threads and cover them as well
Starting with getting the threads:

the ‘~’ sign is loading the threads
The ‘.’ sing suggest current threads being executed. If you want to jump in between threads:

What is each section of the thread info tell us?
The numbers 0,1,2,3,4 are index numbers of the threads
State unfrozen: suggest that the thread is running
suspend 1: means the thread is not actively executing but can be resumed
ID 88d8.2510: it is the combination of the processID & threadID. So the “88d8” which is the same among all 5 threads, suggests the processID and we an also display that in task manager:

One cool feature of Windbg is the ‘?’ which is the evaluate command. This smart feature of the tool figures out what we give it and calculate the result as in this case it knows the value ‘88d8’ is hexadecimal and prints out the decimal value which we can see in the task manager is the actual decimal value of the arp.exe´s processID.
Task manager itself is not gonna display the actual threadIDs but you can enable display the amount of threads by right click the columns and enable the threads. If you want to see the threadID in another way, you can use the teb command:

Since the thread execution is put on num 4 it dispalys the same info in the clientID field.
We can also copy the address of each thread to query the teb :

same result as previous
Now regardless of each threads structure info, we can get the actual structure of these guys and get a better understanding of how they are built. For this task the command ‘dt’ will be used

The dt command displays information about a local variable, global variable or data type. It will display information about simple data types, as well as structures and unions. You can learn more about hte topic **here**
Looking at the result of the ‘~’ command, previously I explaiend majority of the fields but I didn't cover the ‘TEB’ column. With the dt command that field can be queried to get a better understanding

Lets take an example from the output, “LasterrorValue”:

Inside the _TEB structure, at offset 0x68 (always same value), there is a 4-byte field called LastErrorValue, a blueprint of an examle code such as:
typedef struct _TEB {
…
ULONG LastErrorValue; // offset 0x68
…
} TEB;
And to make it a bit more interesting so we understand what that code is doing:

the 0x068 is evaluated as hex and another decimal value is returned from the query
now we have the decimal value of the hex +0x068. That means:

and if you want to learn more about the api calls, some may be covered some may not, they can be found **here**
And lastly for the teb we can use

We get the same structure but with values now. and here is also hyperlinks if you want to follow into the deep:)
While covering Threads, the _teb (Thread Environment Block) command is necessary to understand, but there is also something else called ***peb ***(Process Environment block), and I´ll leave it to you for further investigating into the topic by your own but here is a simple output of the command:

One field of interest in the above output is the “Ldr”. This one is important to understand:

the 00007ffa39db7440 points to the loader data structure that contains the lnked lists fo all loaded DLLs
In shellcode and malware analysis, Ldr is commonly traversed to locate important modules such as kernel32.dll or ntdll.dll without calling Windows APIs. This technique helps avoid detection and works even when API imports are unavailable.
There are tons of interesting fields in there and for instance the “BeingDebugged” field. Why is that so interesting? hopefully your getting curious!? if yes, see this example from **mitre**
….OK Buckle up, its getting geeky now :D More info of the ldr can be found **here ( and [this ](https://www.geoffchappell.com/studies/windows/km/ntoskrnl/inc/api/ntpsapi_x/peb_ldr_data.htm)**amazing place), where according to the documentation it is a struct with this code:

Where:
Reservered[8] and Reservered[3]: are used by the operating system and the InMemoryOrderModuleList: suggest to be “a head of a doubly-linked list that contains the loaded modules for the process”. We can dig into this further because its vital to know how they work and how the DLLs are loaded (in which order)
Lets go through the technical details step by step starting by viewing the peb structure

The 0x00007ffa39db7440 is the starting point of the loaded modules
Before proceeding some explanation of the command:
dt: display type (Shows field of data structure)
ntdll!_PEB: The structure type _peb, defined in ntdll.dll, represeting the process environment containing key information like loaded modules, heaps, image base, process parameters and debug flags.
@$peb : The address of current process PEB. its a pseudo-register that automatically points to the PEB of the process being debugged. the @ sign tells the debugger to interpret it as an expression or address
The +0x018 is the offset of the ldr. That offset can be queried with the dq.

If you want to know what´s existing at a specific address:
Getting the address of the peb first:

Now run the !address <memory address> command :

if you follow along, click the more info and you should see the same info as I got earlier:

Now back to the actual topic that was to dig into the ldr and loaded dlls.
The loader data structure at 0x00007ffa`39db7440 has linked lists of all loaded DLLs:

The output:

Click on InLoadOrderModuleList:

Flink & Blink, the F stands for Forward and the B stands for backward link.
Now the result displays the _LIST_ENTRY [ 0x000001c7b36a4b90–0x000001c7b36a94b0 ], where 0x000001c7`b36a4b90 is the start list.
Click on the InLoadOrderModuleList and it will dispaly the first Flink which is the same address as the one in the above data in the bracket:

As explained by **Geoff **the LDR_DATA_TABLE_ENTRY structure is NTDLL’s record of how a DLL is loaded into a process. Dumping the first address:

Follow the “FullDllName”, it suggest being arp.exe.
To get the next list look at the InLoadOrderLinks

The result:

The next upcoming entry.
To follow and see which dll is loaded next, just repeat the same query but change the address as dispalyed according to the above image:

So far many important topics and commands have been covered. Lets dig into the next section which is how to find the actual breakpoint of the executable. Yes before we put the breakpoint but what if you couldn't find it. always have several methods of actions.
First, get the base address of arp.exe:

command: lm m arp
Second, get the address of the entry point:

With those two fields available to us we can calculate the actual breakpoint address:

Use the expression evaluator to not mis-calculate!
And here is the proof that we hit the main:

Lets inspect the callstack again:

arp!mainCRTStartup is the C Runtime (CRT) entry point where execution transitions from the Windows loader to the program’s runtime initialization before calling main().
And Also we can see the kernel32 and ntdll that comes next which suggest the same result from earlier activity where we were digging into the loaded modules. both modules where noticed while investigating the flink and blink…
A word about ntdll!RtlUserThreadStart+0x28 and KERNEL32!BaseThreadInitThunk+0x1d
- Thread Execution Entry Point: Every new thread in a Windows process starts here, ensuring the thread routine (such as
ThreadProc) is properly initialized. - Startup Sequence: After
ntdll.dllcreates a thread, it typically callsBaseThreadInitThunkto set up parameters before executing the user-defined code. source
Ok, next lets capture what's happening inside my arp.exe while hitting main.

The ‘t’ command executes a single instruction
The arp!security_init_cookie function is a global, random security cookie at program startup. This cookie is later used to verify, at function exit, that the stack has not been corrupted, helping detect buffer overflows or malicious overwrites of return addresses. source!
After calling the security_init_cookie hitting the ‘step over’ several times leads to the next instructions which is the jmp to the mainCRTStartup:

Inside the executable, it is interesting to find strings, and figure out what the application is actually doing.
Among several other techniques, we can use different commands to display text.
The da (Display ascii) command

If no ascii found, it will print out strange unreadable output
earlier during the examination I realized I used several breakpoints, and maybe its good to know how to display all breakpoints:

‘bl’ command
Run bc and the number index of the breakpoint to remove the specific bp:

‘bc ’for clear and ‘bd ’for disable the breakpoint
While containing many function calls, it was interesting how the application is actually calling and printing the IP Addresses, so a breakpoint on the printing function that was found earlier is enabled:

keep stepping over and the first IP Address eventually will appear.
Before leaving this section, if you want to know all the function calls by arp, you can run:

The ‘x’ for examine symbols, gives you a full list of function calls which is helpful if you want to put your breakpoint on a specific call…
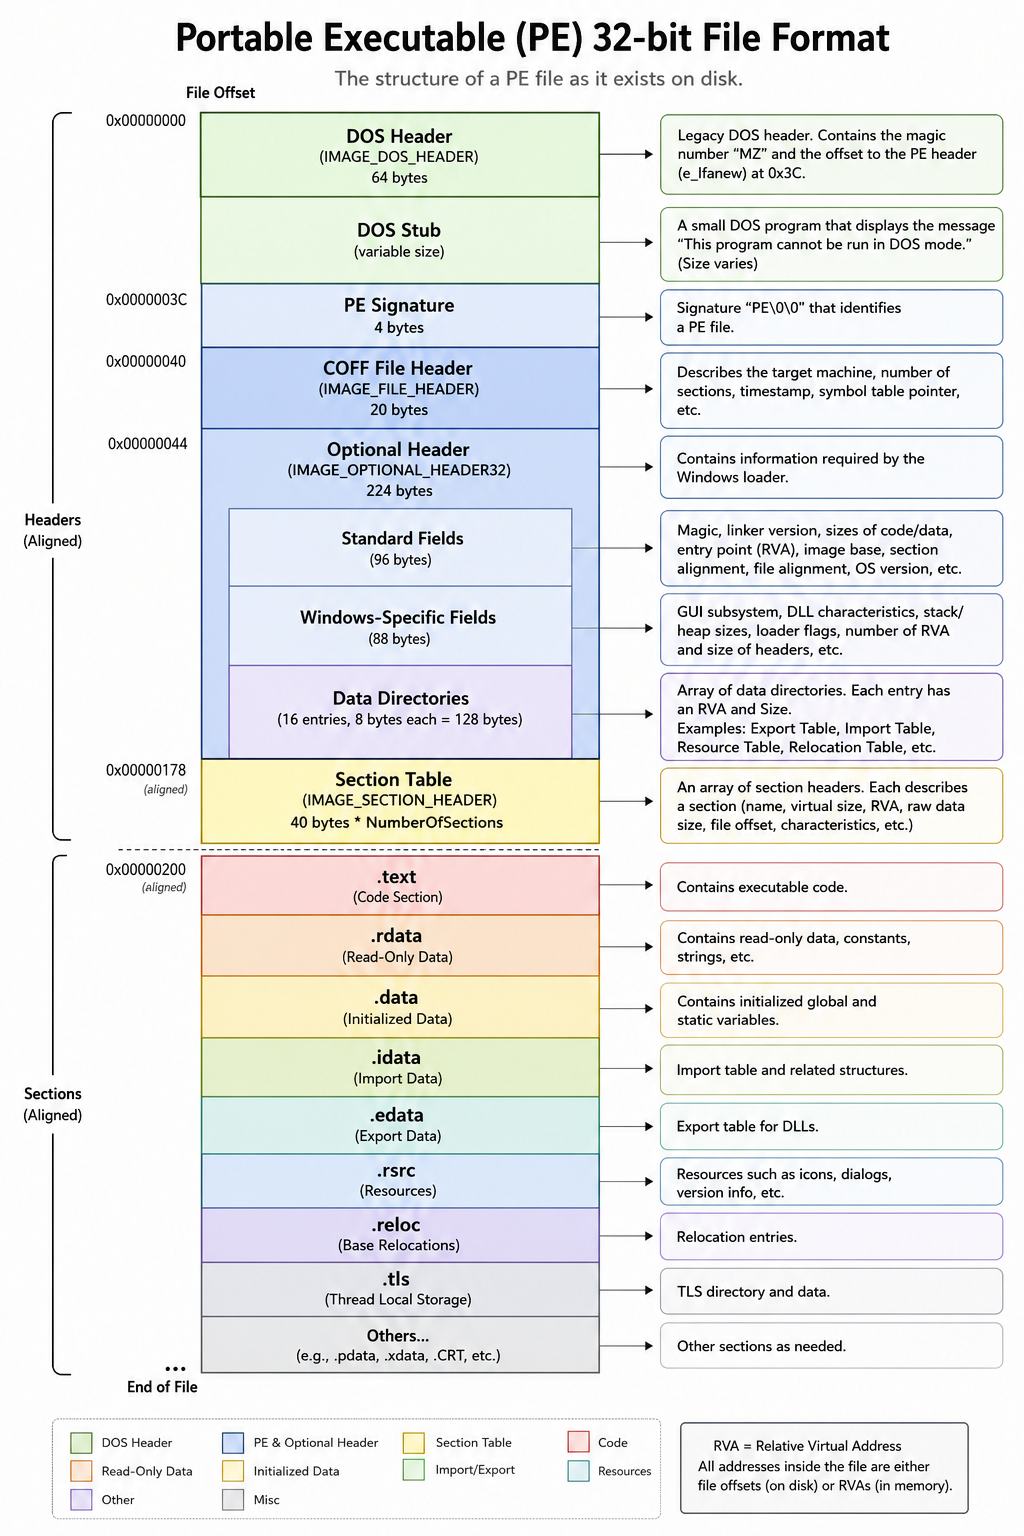
Next covering the PE Section headers. For people doing malware analysis or vulnerability research, the PE Header is essential. knowing which sections are present, what is their permission and how they are laid out, it can reveal how the program might be exploited or camouflaged.
Initial command that displays the headers:

The dh dump header command dumps the 6 sections of the PE file
To calculate and find each section, we need the image base address and address entry point. and again we can use the evaluation command to calculate its value:

The ‘u’ command for disassembly will display the text section:

next section is the .rdata section which typically contains:
Constant strings
Import lookup tables
Virtual function tables (C++)
RTTI metadata
The same approach as before is been take to find the section:

The calc of .rdata is based on virtual address + image base address:

Each section can be calculated as displayed above…
One of the interesting sections are the .rsrc section.
The .rsrc section containing icons, manifest, version info dialog templates.
Although primarily intended for user interface resources, the .rsrc section can also store arbitrary data structures, making it relevant during binary analysis.
Since larger payloads cannot be stored in the .data & .rdata sections due to size limitations, it is cleaner method of putting the payload in .rsrc. I will cover this in separate article and display how each section looks like depending on where the payload is put.
Time for some small demo after learning all this information about the debugger and the Windows PE Files different structures.
Be warned!!!
If you going to replicate the below step, you need to be aware of the actual IP Address is a malicious IP and you should not try this in a real machine. So please make sure its been done in a safe lab environment!!!
First thing first verifying the executable is attached correct:

The executables memory location is mapped with a start and end address.
next thing to do quickly is to see if there is any potential commands. Since I know the curl command is in there, which is also displayed above to the left side, I can search for that specific string:

The command:
‘s’: searches through memory to find a specific byte pattern
‘-a’: ascii
‘00400000': start memory address
‘00411000’: end end address
‘curl’: the ascii text to look for
Before proceeding with further inspections, I was curious if the code will get blocked by my AV, which it didn't but running the code in Virustotal, the result is indeed very interesting. Remember that the curl command towards the IP is a real malicious endpoint :) and the result is:

Its scary that only 10 out of 71 found it as malicious. It should be red everywhere :D
Now lets find in which section the code resides.
First calculate the relative virtual address:

running the !dh test command to inspect the PE header sections, we can tell that the string is in .rdata section:

The .rdata range calc:

And the evaluation of the result:
VA of string: 0x5064
Range of the .rdata : 0x5308
That means the 0x5064 is in this range of the .rdata section
Fruthermore, with different memory dump commands such as db, dc, dd, da du we can see the actual string in the memory:

If you want to do the same steps as we´ve done here, the tool PE-BEAR is another amazing utility that displays all covered steps.
Now with the knowledge we gained. what if we put the code in another section!? where are the AV looking into to find bad stuff!?
Lets figure that out in the next article. until then if you want to read about something really interesting, heck this one out: https://unit42.paloaltonetworks.com/unusual-malware/
메타데이터
- post_id
- bd26fe57bbe2
- slug
- debugging-in-windbg-bd26fe57bbe2
- url
- https://medium.com/@stackghost007/debugging-in-windbg-bd26fe57bbe2
- canonical_url
- https://medium.com/@stackghost007/debugging-in-windbg-bd26fe57bbe2
- author_url
- https://medium.com/@stackghost007
- status
- ok
- fetched_at
- 2026-07-15 18:16:01