Understand Problem and Get Better Results Using Exploratory Data Analysis in Python: A Hands-On…
This article shows how systematic Exploratory Data Analysis with Python empowers you to understand your problem more deeply, avoid common…
Nilimesh Halder, PhD
in
Data Analytics Mastery
· 2025-08-05 07:48
· 41 claps
· 2.5 min read
paywalled
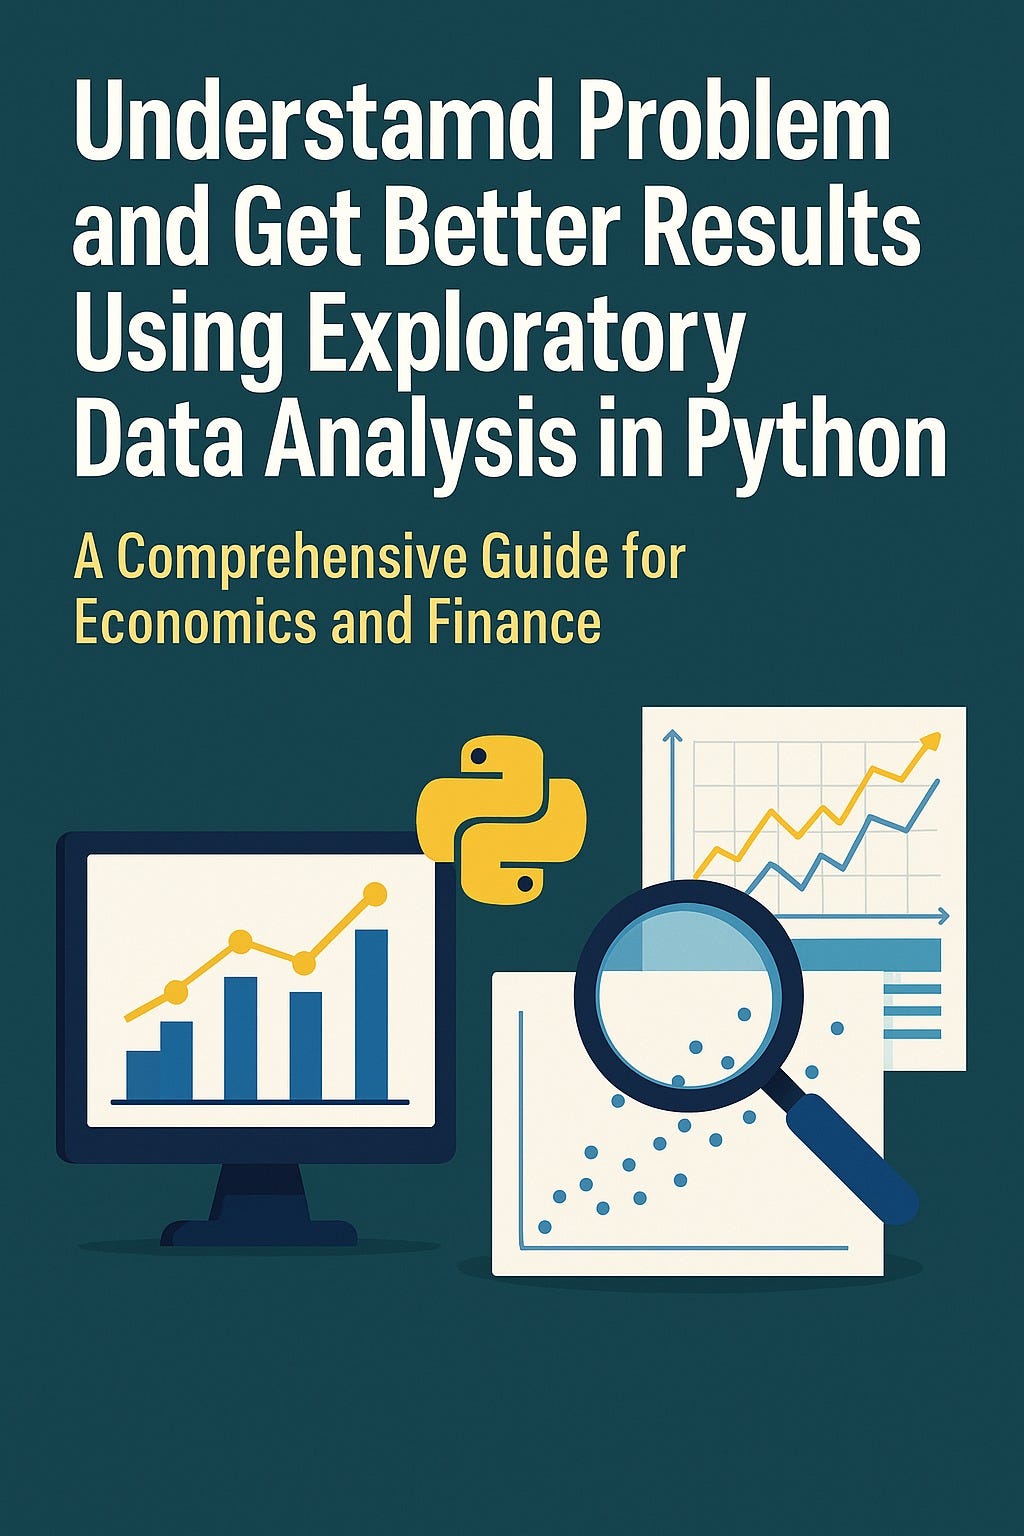
Understand Problem and Get Better Results Using Exploratory Data Analysis in Python: A Hands-On Guide

This article shows how systematic Exploratory Data Analysis with Python empowers you to understand your problem more deeply, avoid common pitfalls, and achieve more reliable and insightful analytical outcomes.
Article Outline:
Introduction
- The significance of fully understanding your data and problem before modeling.
- What is Exploratory Data Analysis (EDA), and why is it crucial for robust results?
- The strengths of Python for performing effective EDA in research and industry.
Foundations of Exploratory Data Analysis
- The goals and philosophy of EDA in data science.
- Key techniques: descriptive statistics, visualization, pattern recognition, and hypothesis generation.
- How EDA fits into the broader data science workflow.
Preparing and Structuring Data for EDA in Python
- Importing data and creating DataFrames using pandas.
- Handling missing values, data types, and initial cleaning.
- Inspecting structure and first-glance summary of the dataset.
Core EDA Techniques and Visualisations
- Calculating summary statistics and detecting anomalies.
- Creating and interpreting histograms, boxplots, scatterplots, and correlation matrices.
- Grouped analysis and comparing data segments.
End-to-End EDA Example in Python
- Building a sample dataset and loading it into pandas.
- Step-by-step workflow: from initial inspection to deep dives into features and relationships.
- Using matplotlib, seaborn, and pandas for comprehensive visualisations.
- Drawing insights and preparing for the modeling phase.
Best Practices and Pitfalls in EDA
- Documenting your workflow and making EDA reproducible.
- Common mistakes to avoid and the role of domain expertise.
- Ensuring findings from EDA guide and validate future modeling.
Conclusion
- Summary of how EDA can clarify your analytical problem and improve the quality of your results.
- Encouragement to adopt EDA as a foundational skill for all data-driven projects.
Download the article … … …
End-to-End Python Example: EDA Workflow with Simulated Data
## End-to-End Python Example: EDA Workflow with Simulated Data

import numpy as np
import pandas as pd
import matplotlib.pyplot as plt
import seaborn as sns
import warnings
warnings.filterwarnings("ignore")

# Simulate data
np.random.seed(42)
n = 160
farms = [f'Farm_{i}' for i in range(1, 11)]
years = np.random.choice(range(2017, 2023), size=n, replace=True)
farm_names = np.random.choice(farms, size=n, replace=True)
fertilizer = np.round(np.random.normal(120, 32, n)).astype(int)
rain = np.round(np.random.normal(430, 65, n)).astype(float)
yield_t_ha = (2 + 0.045 * fertilizer + 0.0028 * rain - 0.00009 * fertilizer**2 +
             np.random.normal(0, 0.7, n))
for idx in np.random.choice(range(n), size=6, replace=False):
    yield_t_ha[idx] = np.nan
for idx in np.random.choice(range(n), size=5, replace=False):
    rain[idx] = np.nan

df = pd.DataFrame({
    'farm': farm_names,
    'year': years,
    'fertilizer_kg_ha': fertilizer,
    'rain_mm': rain,
    'yield_t_ha': yield_t_ha
})

# Initial exploration
print(df.info())
print(df.describe())
print(df.isnull().sum())

# Clean: Drop rows with missing values for EDA
df_clean = df.dropna().reset_index(drop=True)

# Distribution plots
plt.figure(figsize=(7, 4))
sns.histplot(df_clean['fertilizer_kg_ha'], kde=True, bins=20)
plt.title('Distribution of Fertilizer')
plt.show()

plt.figure(figsize=(7, 4))
sns.histplot(df_clean['yield_t_ha'], kde=True, bins=20, color='salmon')
plt.title('Distribution of Yield')
plt.show()

plt.figure(figsize=(8, 4))
sns.boxplot(x='farm', y='yield_t_ha', data=df_clean)
plt.title('Yield by Farm')
plt.xticks(rotation=45)
plt.show()

# Scatter and regression
plt.figure(figsize=(7, 4))
sns.scatterplot(x='fertilizer_kg_ha', y='yield_t_ha', hue='farm', data=df_clean, palette='Set2')
plt.title('Yield vs Fertilizer (by Farm)')
plt.show()

plt.figure(figsize=(7, 4))
sns.regplot(x='fertilizer_kg_ha', y='yield_t_ha', data=df_clean, scatter_kws={'alpha':0.5})
plt.title('Yield vs Fertilizer with Linear Fit')
plt.show()

sns.lmplot(x='fertilizer_kg_ha', y='yield_t_ha', data=df_clean,
           order=2, aspect=1.5, height=5, scatter_kws={'alpha':0.6})
plt.title('Yield vs Fertilizer with Quadratic Fit')
plt.show()

# Correlation matrix
corr = df_clean[['fertilizer_kg_ha', 'rain_mm', 'yield_t_ha']].corr()
print(corr)

plt.figure(figsize=(5,4))
sns.heatmap(corr, annot=True, cmap='coolwarm', fmt=".2f")
plt.title('Correlation Matrix')
plt.show()

# Grouped analysis
mean_yield_by_farm = df_clean.groupby('farm')['yield_t_ha'].mean().sort_values(ascending=False)
print(mean_yield_by_farm)

plt.figure(figsize=(8, 4))
sns.boxplot(x='year', y='yield_t_ha', data=df_clean)
plt.title('Yield by Year')
plt.show()

# Outlier detection
Q1 = df_clean['yield_t_ha'].quantile(0.25)
Q3 = df_clean['yield_t_ha'].quantile(0.75)
IQR = Q3 - Q1
outliers = df_clean[(df_clean['yield_t_ha'] < Q1 - 1.5 * IQR) |
                    (df_clean['yield_t_ha'] > Q3 + 1.5 * IQR)]
print("Potential outliers:\n", outliers)
메타데이터
- post_id
- bd78dd2bc734
- slug
- understand-problem-and-get-better-results-using-exploratory-data-analysis-in-python-a-hands-on-bd78dd2bc734
- url
- https://medium.com/analytics-mastery/understand-problem-and-get-better-results-using-exploratory-data-analysis-in-python-a-hands-on-bd78dd2bc734
- canonical_url
- https://medium.com/analytics-mastery/understand-problem-and-get-better-results-using-exploratory-data-analysis-in-python-a-hands-on-bd78dd2bc734
- author_url
- https://medium.com/@HalderNilimesh
- status
- ok
- fetched_at
- 2026-06-13 16:00:06