Open Telemetry
OpenTelemetry (often abbreviated as OTel) is an open-source observability framework made up of a collection of tools, APIs, and SDKs. It is…
Open Telemetry
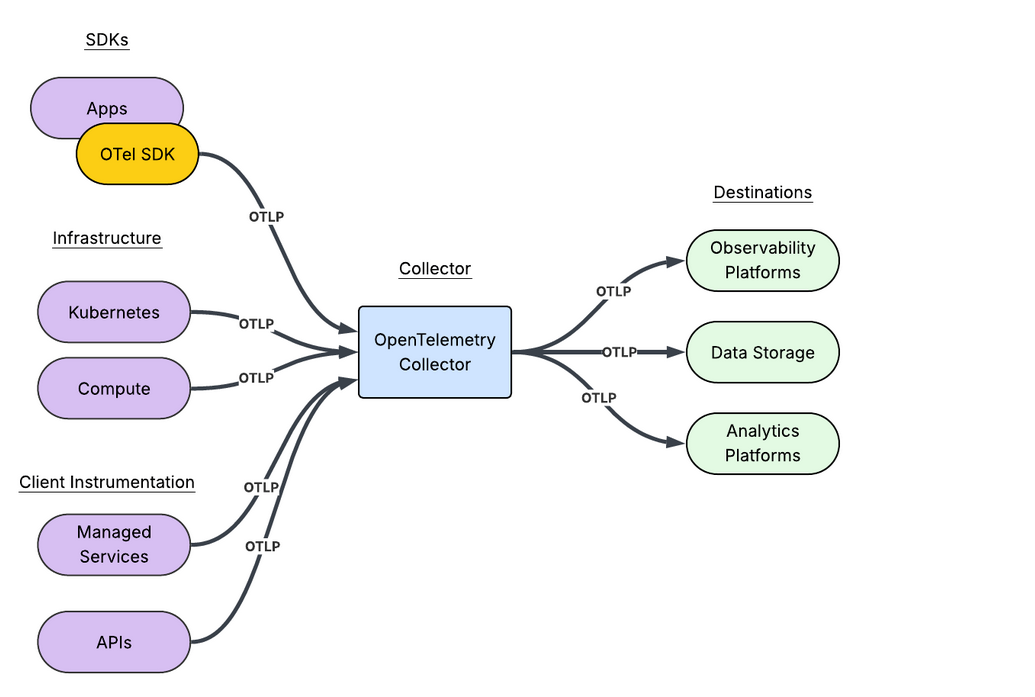
OpenTelemetry (often abbreviated as OTel) is an open-source observability framework made up of a collection of tools, APIs, and SDKs. It is used to instrument, generate, collect, and export telemetry data (metrics, events, logs, traces) to help you analyze your software’s performance and behavior.
Currently a by the Cloud Native Computing Foundation (CNCF) graduate project , it is the industry standard for making systems observable.The easiest way to understand OpenTelemetry is to look at the specific problem it solves: vendor lock-in.
Before OTel, if you wanted to monitor your application using a tool like Datadog, New Relic or Splunk, you had to write your code using their specific, proprietary agents and SDKs. If you ever wanted to switch to a different monitoring tool, you had to rewrite a massive amount of code to rip out the old vendor’s SDK and replace it with the new one.
OpenTelemetry provides a single, universally accepted standard. You write your instrumentation code once using OpenTelemetry, and you can then point that data to any backend tool you want without changing your code.
Core Components
To actually use OpenTelemetry in your applications, you rely on a few distinct pieces of the framework working together:
- APIs: These are the universal “interfaces” you use to instrument your code. They don’t actually generate the data. They just define how the data should be structured.
- SDKs: These are language-specific libraries (available for Java, Python, Go, Node.js, etc.) that do the heavy lifting of actually gathering the data defined by the APIs.
- The OpenTelemetry Collector: This is the most powerful piece of the puzzle. It is a standalone service (often deployed as a sidecar or a central gateway) that receives the telemetry data from your apps, processes it (filters, batches, or scrubs sensitive data), and then exports it to your backend analysis tools (like Prometheus, Datadog, AWS X-Ray, etc.).
Why use OpenTelemetry
- Vendor Neutrality: You own your data. You can switch observability platforms by simply changing a configuration file in the OTel Collector, rather than rewriting application code.
- Unified Data: Because traces, metrics, and logs are all generated by the same framework, it is much easier to correlate an abnormal metric spike directly to a specific log line or trace.
- Future-Proof: As the second most active CNCF project (behind only Kubernetes), it is supported by almost every major cloud provider and monitoring tool on the market.
Sample Use Case
Imagine you have an e-commerce application. Users are complaining that clicking the “Checkout” button sometimes takes too long.
You want to use OpenTelemetry to track exactly how long the process_checkout function takes, capture the specific Order ID being processed, and record the steps inside that function. Instead of sending this data to a paid tool right away, we will just export it directly to the console to see how it works.
To run this, you would first install the basic OpenTelemetry libraries (pip install opentelemetry-api opentelemetry-sdk).
import time
from opentelemetry import trace
from opentelemetry.sdk.trace import TracerProvider
from opentelemetry.sdk.trace.export import ConsoleSpanExporter, SimpleSpanProcessor

# 1. Setup: Tell OpenTelemetry how to process and where to send the data.
# In a real app, you would send this to the OTel Collector. Here, we print to the console.
provider = TracerProvider()
processor = SimpleSpanProcessor(ConsoleSpanExporter())
provider.add_span_processor(processor)
trace.set_tracer_provider(provider)

# 2. Get a Tracer: This is what you use to actually instrument your code.
tracer = trace.get_tracer(__name__)

def process_checkout(order_id):
    # 3. Create a Span: A span represents a single unit of work (the checkout process).
    with tracer.start_as_current_span("checkout_transaction") as span:

        # 4. Add Attributes: Attach business context so you can search for this exact trace later.
        span.set_attribute("order.id", order_id)
        span.set_attribute("payment.method", "credit_card")

        print(f"Processing order {order_id}...")

        # Simulate a database call or contacting a payment gateway
        time.sleep(1)

        # 5. Add Events: Log specific milestones within the span.
        span.add_event("Payment authorized by gateway")

        print("Order complete!")

# Run the simulated checkout
process_checkout("ORD-98765")
When the code executes, the OpenTelemetry SDK silently tracks the start time, the end time, and all the custom data you injected. Because we used the ConsoleSpanExporter, it generates a standard JSON object in your terminal that looks something like this:
{
    "name": "checkout_transaction",
    "context": {
        "trace_id": "0x5b8aa5a2d2c872e8416... (A unique ID for this entire request)",
        "span_id": "0x12345abcdef..."
    },
    "start_time": "2026-05-31T18:06:18.000000Z",
    "end_time": "2026-05-31T18:06:19.000000Z",
    "attributes": {
        "order.id": "ORD-98765",
        "payment.method": "credit_card"
    },
    "events": [
        {
            "name": "Payment authorized by gateway",
            "timestamp": "2026-05-31T18:06:19.000000Z"
        }
    ]
}
This is powerful because if you change your setup to send this data to a tool like Datadog, Jaeger, or New Relic (simply by swapping out the ConsoleSpanExporter for an OTLPExporter), this raw JSON is automatically converted into a visual timeline chart. You will immediately see that the checkout took exactly 1.0 seconds, search for it using the specific ORD-98765 tag, and instantly know that the payment authorization was successful.
OpenTelemetry with Kubernetes Operator
Instead of having developers import OpenTelemetry SDKs into their source code, the Kubernetes Operator intercepts your pods as they are spinning up and automatically injects the necessary tracing libraries into them at runtime.
Operator installation
First, you install the OpenTelemetry Operator into your Kubernetes cluster (typically using Helm or a standard YAML manifest). This operator runs in the background and watches for specific instructions (cluster-scoped).
Instrumentation Rules
You create a K8s crd of kindInstrumentation. This file tells the cluster how to instrument your apps and wher to send the gathered data (like to your OTel Collector).
apiVersion: opentelemetry.io/v1alpha1
kind: Instrumentation
metadata:
  name: my-instrumentation
  namespace: my-app-namespace
spec:
  exporter:
    # Tell the auto-instrumentation where to send the traces
    endpoint: "http://my-otel-collector-service:4318"
  sampler:
    type: always_on
Annotate Application
This is where the magic happens. You take your existing, completely unmodified application deployment and simply add a single annotation to the Pod template. The operator supports Java, Python, Node.js, Go, .NET, and more.
If you have a standard Python web application, you just add instrumentation.opentelemetry.io/inject-python: "true" to your metadata:
apiVersion: apps/v1
kind: Deployment
metadata:
  name: standard-python-app
spec:
  replicas: 1
  template:
    metadata:
      annotations:
        # This single line triggers the auto-instrumentation
        instrumentation.opentelemetry.io/inject-python: "true"
    spec:
      containers:
      - name: application-container
        image: your-company/python-app:latest
        ports:
        - containerPort: 8080
When you deploy that YAML file to Kubernetes, the OpenTelemetry Operator sees the annotation and intercepts the pod creation using an Admission Webhook.
It automatically injects an initContainer into your pod. This init-container copies the OpenTelemetry Python agents into a shared volume. The operator then automatically modifies your pod's environment variables (like PYTHONPATH) so that when your actual application container starts, it is seamlessly wrapped by OpenTelemetry.
OTel Collector
If OpenTelemetry SDKs are the tools that generate the data inside your application, the Collector is the postal sorting facility that figures out what to do with that data.
While you can technically send telemetry data straight from your application to a backend tool (like Datadog or Prometheus), placing the OTel Collector in the middle is the industry standard best practice.
Otel Collector Deployment Flavors
In a cloud-native environment like Kubernetes, the Collector is typically deployed in one of two ways (and often both):
- As an Agent (Sidecar / DaemonSet): The Collector runs directly alongside your application on the same machine. Your app sends data to
localhost, and this local Collector does light processing before forwarding it on. - As a Gateway: A dedicated, scalable cluster of Collectors sits at the edge of your network. All the local agents forward their data to this central gateway, which handles heavy processing, API key management, and routing to external vendors.
Some Metrics Collected
Assuming your app uses standard, supported frameworks, the operator automatically generates metrics governed by OpenTelemetry Semantic Conventions. This is a strict naming standard enforced by OTel so that your data looks uniform regardless of what language generated it.
HTTP / Web Metrics
Whenever your app receives a web request or makes an API call to another service, the operator automatically tracks:
- Request Duration (
http.server.request.duration): How long it took your app to process an incoming request. - Active Requests (
http.server.active_requests): The number of concurrent requests currently in flight. - Client Duration (
http.client.request.duration): How long your app waited for an external API (like a payment gateway) to respond. - Payload Sizes: The byte size of the request and response bodies.
DB metrics and messaging
If your app connects to a database (like Postgres, MySQL, or MongoDB) or a message queue (like Kafka or RabbitMQ) using a standard client library, the operator hooks into that client to pull:
- Connection Pools: How many database connections are currently idle, active, or maxed out.
- Operation Duration: How long a specific database query or queue publish took to execute.
- Business Context: The metrics are tagged with the database system (
postgresql), the operation type (SELECT,INSERT), and sometimes the sanitized query statement itself.
Runtime Metrics
These are the internal health metrics of the specific language engine your app is running on. This is where the output varies wildly depending on your stack:
- Java: JVM garbage collection pauses (
jvm.gc.pause), heap memory usage (jvm.memory.used), and active threads. - Node.js: Event loop lag, V8 engine memory heap statistics, and active handles.
- Go/Python: Goroutine counts, memory allocation, and active thread counts.
Because auto-instrumentation relies on a hardcoded list of recognized libraries, it can sometimes lead to silent failures.
If you deploy a pod using an unsupported framework (for example, a bleeding-edge or obscure async web framework), the Kubernetes Operator will successfully inject the OTel container, and the pod will start normally. However, because the agent doesn’t recognize the framework, it won’t know how to intercept the traffic. You will get baseline CPU/Memory/Runtime metrics, but you will see zero HTTP or database metrics in your dashboard.
If you aren’t seeing the metrics you expect, always check the official OpenTelemetry registry to ensure the specific version of the library your app uses is officially supported by the auto-instrumentation agent.
메타데이터
- post_id
- bddc17d554d0
- slug
- open-telemetry-bddc17d554d0
- url
- https://medium.com/@litombeg/open-telemetry-bddc17d554d0
- canonical_url
- https://medium.com/@litombeg/open-telemetry-bddc17d554d0
- author_url
- https://medium.com/@litombeg
- status
- ok
- fetched_at
- 2026-06-22 17:31:34