The GraphRAG Cost Cliff: How $33,000 Became $33 in Eighteen Months
In early 2024, indexing a single dataset for GraphRAG cost $33,000. By mid-2025, Microsoft Research had reduced that to 0.1%. The cost…
The GraphRAG Cost Cliff: How $33,000 Became $33 in Eighteen Months

In early 2024, indexing a single dataset for GraphRAG cost $33,000. By mid-2025, Microsoft Research had reduced that to 0.1%. The cost cliff changes the economics of everything we’ve argued about knowledge graphs — and finally puts the ontology investment question in dollar terms.
Here’s a number I couldn’t have written eighteen months ago: $33,000.
That’s what it cost to index a single 5-gigabyte legal case dataset for Microsoft’s GraphRAG in early 2024. Not the ongoing query costs. Not the infrastructure. Just the initial indexing step — the one-time LLM processing required to extract entities, build a knowledge graph, summarize communities, and make the corpus queryable through graph-augmented retrieval.
For most enterprise teams evaluating GraphRAG against plain vector search, the conversation ended right there. Vector search indexes the same dataset for a few dollars. The accuracy gains from graph-structured retrieval are real — we’ll get to those — but a 10,000× cost premium on indexing is not a conversation most engineering leads survive in a budget review.
I’ve been writing about ontology-grounded knowledge graphs for over a year now. Across a series of articles, we’ve argued that context blindness in RAG is fundamentally a knowledge representation problem, that AI agents need formal ontologies to coordinate memory, that ontology drift is silently killing enterprise KG projects, and that the economics of ontology engineering — the “ontology tax” — are the real barrier to adoption. Every one of those arguments assumed that the graph itself was worth building if you could afford it.
What changed between 2024 and 2026 is that the cost structure collapsed. Not incrementally. Not by half. By orders of magnitude. And the data supporting this collapse is now peer-reviewed, benchmarked, and — critically — reproducible.
This article maps the cost cliff, examines what drove it, and shows how the new economics validate (and complicate) the arguments we’ve been making.
The $33,000 Problem
To understand the cliff, you have to understand what made GraphRAG expensive in the first place.
Microsoft’s original GraphRAG pipeline (April 2024) processes a corpus through five LLM-intensive stages: entity extraction from each text chunk, relationship extraction for each entity pair, entity summarization that aggregates mentions across the corpus, relationship summarization that aggregates interactions, and community detection with report generation for each cluster. Graph extraction alone constitutes approximately 75% of the total indexing cost.
Every stage requires an LLM call. At GPT-4-Turbo pricing — the model available when GraphRAG launched — the cost per token made this prohibitive at scale. The 5GB legal dataset that cost $33,000 wasn’t an outlier. It was the baseline. Enterprise corpora run to hundreds of gigabytes. Scale linearly, and you’re looking at indexing costs that exceed the annual budget of most data teams before a single query is answered.
The irony was evident: GraphRAG delivered dramatically better answers for complex, multi-hop questions than vector search. But the indexing cost meant you couldn’t afford to build the graph that would deliver those answers. The technology worked. The economics didn’t.
This is a pattern we identified across the broader ontology space. In the ontology tax article, we documented how the total cost of enterprise knowledge graphs — $10–$20 million at full scale (Cutter Consortium) — is dominated not by software licenses but by the human labor of schema design, construction, and maintenance. GraphRAG’s indexing cost was the automated version of the same problem: the cost of structuring knowledge is the bottleneck, whether it’s humans building ontologies or LLMs building graphs.
The Cliff
Between mid-2024 and mid-2025, four independent approaches attacked the GraphRAG cost problem from different angles. Each achieved order-of-magnitude reductions. Together, they redrew the cost landscape.
LazyGraphRAG (Microsoft Research, June 2025) is the headline result. Full GraphRAG pays upfront: process everything, summarize everything, build everything, then answer queries cheaply. LazyGraphRAG inverts this entirely — index cheaply using lightweight NLP, then invokes the LLM only at query time, only for the portions of the graph relevant to that specific question.
The result: indexing cost drops to 0.1% of full GraphRAG — effectively identical to vector search indexing. Query costs drop by 700× compared to GraphRAG global search, while matching its answer quality. A single tunable parameter — a “relevance test budget” — lets operators trade cost for depth on a per-query basis. The $33,000 corpus costs roughly $33 to index. For most enterprise workloads, where the corpus is large, but any given query touches a small fraction, this inversion is transformative.
KET-RAG (ACM SIGKDD 2025) took a different path. Instead of full extraction, it builds a skeletal knowledge graph combined with text-keyword mappings — enough structure for graph-augmented retrieval without the cost of complete entity summarization. The result: 32.4% better generation quality than full GraphRAG at 20% lower indexing cost, outperforming 13 competing RAG methods across MuSiQue and HotpotQA multi-hop benchmarks. This parallels something we argued in the hybrid retrieval article: the winning pattern isn’t “complete graph OR no graph” but a deliberate mixing of structured and unstructured representations at different granularities.
Fast-GraphRAG (CircleMind AI) attacked the extraction cost directly, substituting LLM-based entity extraction with traditional NLP for the initial pass. Per-operation cost drops from $0.48 to $0.08 — a 6× reduction. The trade-off is a noisier graph, which we quantified in our extraction benchmark article: local 7B models achieve 0.52–0.73 Triple F1, compared with GPT-4’s near-perfect extraction. The production choice depends on whether you’re optimizing for cost or precision.
LightRAG closed the loop on maintenance. Where GraphRAG required complete re-indexing when the corpus changed, LightRAG introduced incremental processing at approximately 1/100th the cost of a full rebuild. When your corpus changes daily, the difference between “re-index everything” and “add the delta” is the difference between viable and not.
The Cost Landscape, Redrawn
Here’s what the combined effect looks like in dollar terms:
  Approach               Indexing Cost (5GB corpus)   Per-Query Cost           Annual Cost (10K queries/day)
 ---------------------- ---------------------------- ------------------------ -------------------------------
  Full GraphRAG (2024)   ~$33,000                     High (all communities)   Variable, substantial
  LazyGraphRAG (2025)    ~$33 (0.1%)                  700× lower               Near vector search level
  KET-RAG (2025)         ~$6,600 (80% reduction)      Lower                    20% below full GraphRAG
  Fast-GraphRAG          ~$5,500 (83% reduction)      6× lower                 Significantly reduced
  Vector RAG             $2–5                         Low                      ~$3,650 (ArangoDB benchmark)
  KG-based RAG           One-time graph build         $0.0005/query            ~$1,825 (ArangoDB benchmark)
That last row deserves attention. ArangoDB published a direct comparison of knowledge-graph-based RAG versus vector-database RAG for identical workloads: 10,000 queries per day. The graph approach costs $1,825 annually. The vector approach costs $3,650 — exactly double. Annual maintenance adds $15,000 for the graph system versus $20,000 for vector stores, with graph costs being more predictable (no surprises from embedding regeneration).
These are not theoretical projections. They’re operational costs from a production-grade graph database vendor benchmarking their own system against the vector alternative. The methodology includes query processing, infrastructure, storage, and compute — the full stack.
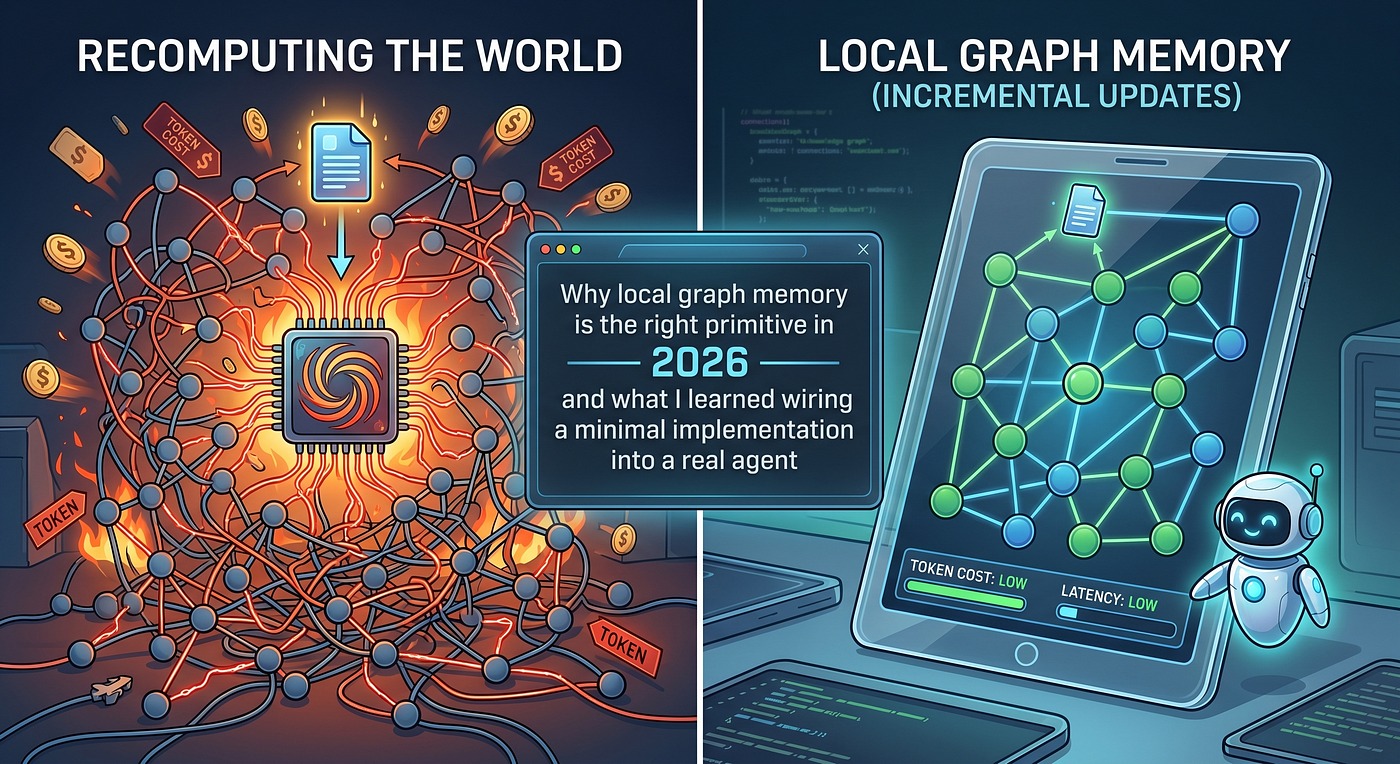
The inversion is complete. In 2024, the narrative was prohibitive indexing cost — graph retrieval as a luxury only well-funded teams could explore. In 2026, the narrative is that graph-based retrieval costs half as much as vector search at operational scale, with more predictable economics and lower maintenance overhead. The cost objection didn’t shrink. It flipped sides.
The Accuracy Payoff You Can Now Afford
We always knew the accuracy case was settled — graph-structured retrieval wins on every meaningful benchmark. The cost cliff just made it economical to collect that win.
The numbers are consistent across independent studies. Amazon Neptune’s GraphRAG benchmark: 90.63% accuracyversus 46.88% for vector-only retrieval on industry sector classification — the difference between a system that’s right nine times out of ten and one that’s wrong more often than it’s right. The data.world benchmark (Sequeda, Allemang, Jacob — GRADES-NDA 2024) provides the most methodologically rigorous comparison: using GPT-4 with zero-shot prompting against an enterprise insurance domain, SQL alone achieved 16.7% accuracy while SPARQL against a properly modeled knowledge graph achieved 54.2% — a 3.25× improvement that scaled with query complexity.
But the finding that crystallizes why this matters came from the Diffbot/FalkorDB benchmark: vector RAG scored literally 0% on Metrics & KPIs and Strategic Planning queries. Not “low.” Zero. The questions that matter most for enterprise decision-making — questions requiring relationship traversal, not text similarity — are precisely the questions vector search cannot answer at all. Additional benchmarks from our series tell the same story at different angles: OG-RAG’s 40% correctness gain (EMNLP 2025), TaxoGlimpse’s 30% LLM performance drop without domain ontologies (VLDB 2024), and the 82% error reduction from neurosymbolic guardrails.
What the cost cliff change does is affect the denominator. When the indexing cost drops by 99.9%, the accuracy gains that were always real become economically accessible for the first time.
What This Means for the Ontology Tax
In the ontology tax article, we mapped the full cost structure of enterprise knowledge graphs and argued that LLM automation was reducing tax costs by 40–60%, with governance emerging as the dominant remaining cost. The GraphRAG cost cliff accelerates that argument — but also complicates it in a way we didn’t fully anticipate.
The complication: the cost cliff enables a mode of graph-augmented retrieval that bypasses formal ontology entirely. LazyGraphRAG and KET-RAG build skeletal graphs from text without requiring a predefined schema. They don’t need an ontology engineer. They don’t need ONTOCOM cost estimation. They don’t need governance processes. They just index the text, build a lightweight graph structure, and answer queries against it.
This is the “bottom-up ontology” approach that Bijit Ghosh (CTO, Deutsche Bank) described in December 2025 — systems that avoid the ontology tax altogether by letting structure emerge from data rather than being imposed by experts. Kan Yuenyong went further in his provocatively titled piece, “The Death of Ontology Engineering,” arguing that LLMs' implicit learning of relationships from data makes manual ontological encoding economically indefensible.
We think they’re half right. The cost cliff makes it irrational to spend $200K–$500K on manual ontology construction for use cases where a skeletal graph achieves adequate accuracy. For exploration, prototyping, and single-domain question answering, the new economics decisively favor the bottom-up approach.
But “adequate accuracy” is doing a lot of work in that sentence.
Where Bottom-Up Breaks
It breaks down precisely where enterprises need graphs most. The zero-percent accuracy on Metrics & KPIs queries isn’t a retrieval failure. It’s a representation failure. These queries require formal semantic structure — defined relationships between entities, typed properties, and cardinality constraints. A skeletal graph extracted from text can tell you that “Company X” and “Revenue” appear in the same document. It cannot tell you that Q3 revenue is a temporal slice of annual revenue, that revenue excludes deferred income under ASC 606, or that revenue growth is measured year-over-year against the restated baseline.
Those distinctions require an ontology. Not necessarily a heavyweight OWL 2 formalization — but a formal enough structure that the graph encodes semantics, not just co-occurrence.
The data.world benchmark makes this explicit. The 54.2% accuracy achieved via SPARQL against a knowledge graph used a properly modeled schema — classes, properties, constraints. The query didn’t just find relevant text. It reasoned over typed relationships. That reasoning is what produces the 3.25× accuracy improvement, and it’s not available from a skeletal text-extracted graph.
The neurosymbolic guardrail article documented a related failure mode: logical constraint violations that no amount of retrieval improvement can catch. A clinical decision support system that recommends ibuprofen for a patient on warfarin is textually consistent with retrieved documents about pain management. It’s also medically dangerous. The constraint — warfarin + NSAID = bleeding risk — lives in the formal structure of clinical ontologies (SNOMED CT), not in any individual document. No bottom-up graph extraction will discover it from text alone.
Amazon Neptune’s 90.63% vs. 46.88% accuracy split shows where this matters at scale. The 43.75 percentage-point gap is not noise. It’s the gap between systems that encode semantic structure and systems that approximate it through text similarity. For enterprise applications where wrong answers have consequences — regulatory compliance, clinical decision-making, financial reporting — that gap justifies the ontology tax.
The New Break-Even
The cost cliff changes the break-even calculation we proposed in the ontology tax article.
Previously, we argued that the ontology tax is justified at 5–10+ heterogeneous data sources, in regulated industries, and for multi-agent coordination. The cost cliff introduces a gradient where one previously didn’t exist:

Below the break-even (skip the ontology, use skeletal GraphRAG): Single-domain question answering. Exploration and prototyping. Internal knowledge bases where “good enough” accuracy is acceptable. The cost: effectively identical to vector search indexing (LazyGraphRAG) with meaningful accuracy improvements on relationship and multi-hop queries. No ontology engineers needed.
At the break-even (lightweight upper ontology + automated graph): Multi-domain integration with 5–10 data sources. Applications where accuracy on relationship-heavy queries matters, but a full formal ontology is overkill. The hybrid sweet spot we described: pay the ontology tax for cross-cutting concepts (what “customer” means, what “revenue” means), let LLMs handle domain-specific structure. Cost: 40% of the traditional ontology tax for roughly 80% of the value.
Above the break-even (full ontology investment, graph-augmented everything): Regulated industries. Multi-agent systems. Applications where the 90% vs. 47% accuracy split has dollar consequences. The cost is still real — governance doesn’t automate — but the construction and indexing components are now so cheap that the total investment is dominated by the organizational work of agreeing on what things mean.
The MIT NANDA report (“The GenAI Divide,” July 2025) adds context to this gradient. Their finding that 95% of enterprise organizations got zero return from AI efforts — based on 52 structured interviews, 300+ public initiatives analyzed, and surveys across 4 major conferences — suggests that the break-even isn’t primarily a technology question. It’s an integration question. The organizations in the 5% that succeeded weren’t using better models. They had better data integration — which is another way of saying they paid the ontology tax, whether they called it that or not.
The Extraction Bottleneck Remains
The cost cliff solved the indexing problem. It did not solve the extraction problem.
We benchmarked this directly in a previous article, testing four local small LLMs (Qwen 2.5 7B, Llama 3.1 8B, Mistral 7B, Gemma 2 9B) on structured entity-relationship extraction. The finding that still stands: entity recognition is solved (F1 0.78–0.91), but relation extraction is not (best result: 0.732 Triple F1, most configurations between 0.52–0.60). The gap between “finding things” and “understanding how things connect” is the central quality bottleneck.
This bottleneck matters more, not less, after the cost cliff. When indexing is cheap, you can afford to index everything. But if the extraction quality produces a noisy graph — wrong relationships, missed relationships, hallucinated connections — the graph-augmented retrieval inherits those errors. Fast-GraphRAG’s 6× cost reduction comes at the cost of noisier extraction. LightRAG’s 100× cost reduction relies on NLP-level extraction, which misses subtle relationships.
The quality gradient maps directly: cheap extraction produces graphs good enough for exploration and general-purpose QA. High-quality extraction — still requiring either expensive frontier LLM calls or carefully fine-tuned domain-specific models — produces graphs capable of the 90%+ accuracy that enterprise applications require. The cost cliff compressed the indexing dimension. The extraction quality dimension is still wide open.
This is where the ontology drift argument re-enters. In the drift article, we documented how schemas degrade silently over time as the domain evolves and the ontology doesn’t. With cheap indexing, teams will rebuild graphs more frequently — weekly, daily, even continuously. But if the extraction quality doesn’t improve commensurately, frequent rebuilds just propagate extraction errors faster. The drift becomes extraction drift: the graph faithfully represents what the LLM extracted, but the extraction doesn’t faithfully represent the domain.
This is where formal drift detection becomes critical. You’re rebuilding graphs faster than ever; you need automated quality signals to catch when those rebuilds are propagating extraction errors rather than tracking real domain changes. The tools exist — SemaDrift’s 4-dimension measurement framework (2019), OntoDrift’s structural analysis (2020), and the newer Dynamic KG Evaluation Framework (2025), adding syntactic metrics suited to frequently-rebuilt modern graphs. What doesn’t yet exist is widespread adoption. Most teams are still manually reviewing graph quality, which doesn’t scale to daily rebuilds.
Where This Leaves Us
Eighteen months ago, the economics of graph-augmented retrieval were prohibitive. Today, they’re favorable. That’s not hype — it’s math. LazyGraphRAG’s 0.1% indexing cost. KET-RAG’s 32.4% quality improvement at 20% lower cost. ArangoDB’s $1,825 vs. $3,650 annual operational comparison. Neptune’s 90.63% vs. 46.88% accuracy. These are published, reproducible numbers from Microsoft Research, ACM SIGKDD, and production database vendors.
What does this mean in practice? Three things.
If you’re currently running vector-only RAG, the upgrade path to graph-augmented retrieval is now cost-neutral. LazyGraphRAG indexes at vector-search prices while delivering graph-quality answers for relationship and multi-hop queries. The question is no longer “can we afford GraphRAG?” It’s “can we afford not to, given the accuracy gap?” For most teams, the answer is to start with LazyGraphRAG on your existing corpus and measure the accuracy delta on your actual query patterns.
If you’re evaluating the ontology investment, the cost cliff reframes the calculation entirely. Construction costs — the phase that traditionally consumed $200K–$500K and 6–12 months — are approaching near-zero. The remaining investment is governance: agreeing on what “customer” means across departments, testing backward compatibility of schema changes, verifying regulatory compliance of ontological constraints. That work is still expensive and still human. But it’s now the only expensive part, which makes it easier to budget for, easier to justify, and easier to evaluate against the 300–600% ROI that Forrester TEI studies show for mature implementations.
If you’re managing a production knowledge graph, the new bottleneck is extraction quality, not indexing cost. When rebuilding the graph becomes cheap enough to do daily, the question shifts from “can we afford to rebuild?” to “is the extraction good enough to be worth rebuilding?” The 0.52–0.73 Triple F1 range we measured for local models means that frequent rebuilds with cheap extraction will propagate errors faster unless you invest in extraction quality or formal drift detection. This is where SemaDrift’s 4-dimension measurement framework and the newer Dynamic KG Evaluation Framework (2025) become essential infrastructure — automated quality signals for a world where graphs rebuild faster than humans can review them.
The cost cliff doesn’t eliminate the ontology tax. It reshapes it. Construction is approaching free. Maintenance is largely automatable. Governance was always the hard part — the cost cliff just reveals it by making everything else cheap.
When building a graph is cheap, everyone will build one. The differentiator won’t be who has a graph. It will be who has a graph with semantic structure accurate enough to answer the questions that matter.
For the 95% of enterprises that MIT found getting zero return from AI: the graph is now cheap enough to build. The question is whether you’ll invest in the structure that makes it worth querying.
This article extends a series on ontology-grounded AI systems. Previous articles covered context blindness in RAG and the case for ontology-grounded knowledge graphs, why AI agents need ontology-grounded graph memory, hybrid vector-graph retrieval patterns, local LLM extraction benchmarks for GraphRAG, ontology drift as the silent killer of KG projects, self-evolving ontologies, the neurosymbolic guardrail, and the ontology tax — the real cost of enterprise knowledge graphs. The cost data in this article draws on Microsoft Research (LazyGraphRAG), ACM SIGKDD 2025 (KET-RAG), ArangoDB operational benchmarks, Amazon Neptune GA benchmarks, the Diffbot/FalkorDB accuracy study, data.world’s KG accuracy benchmark (Sequeda, Allemang, Jacob), and the MIT NANDA “GenAI Divide” report (July 2025).
Key references:
GraphRAG Cost Research
- LazyGraphRAG: Setting a New Standard for Quality and Cost — Microsoft Research (June 2025). 0.1% of full GraphRAG indexing cost, 700× lower query cost.
- KET-RAG: Multi-Granular Graph-Augmented Retrieval — ACM SIGKDD 2025. 32.4% quality improvement, 20% indexing cost reduction, outperforms 13 competing solutions.
- Fast-GraphRAG — CircleMind AI. $0.08/op vs. $0.48 (6× cost reduction) using NLP-based extraction.
- LightRAG — Dual-layer retrieval at ~1/100th GraphRAG cost with incremental processing.
Accuracy Benchmarks
- ArangoDB: RAG with Vector Databases vs. GraphRAG with Knowledge Graphs — $1,825/yr (KG) vs. $3,650/yr (vector) for 10K queries/day.
- Amazon Neptune GraphRAG — 90.63% accuracy vs. 46.88% vector RAG on industry sector classification.
- GraphRAG Accuracy: Diffbot/FalkorDB Benchmark — 3.4× overall accuracy gain; 0% vector RAG accuracy on Metrics & KPIs.
- Benchmarking the Accuracy of LLMs with Knowledge Graph — Sequeda, Allemang, Jacob (data.world/GRADES-NDA 2024). 16.7% SQL vs. 54.2% KG accuracy.
Industry Context
- MIT NANDA: The GenAI Divide — 95% of enterprise AI pilots deliver zero ROI (July 2025).
- Bijit Ghosh: “Why Ontology, Context Graphs, and Decision Traces Are the New AI Substrate” — Deutsche Bank CTO on “ontology tax” (December 2025).
- Kan Yuenyong: “The Death of Ontology Engineering” — Contrarian position on manual ontology construction (January 2025).
Semantic Drift Measurement
- SemaDrift: Measuring Semantic Drift in Ontologies — Journal of Web Semantics (2019). 4-dimensional measurement framework.
- OntoDrift — MEPDaW@ISWC 2020. Structural-level drift analysis.
- Dynamic Knowledge Graph Evaluation Framework — TechRxiv (2025). Syntactic + semantic metrics for KG change evaluation.
메타데이터
- post_id
- be1b0fbe37e4
- slug
- the-graphrag-cost-cliff-how-33-000-became-33-in-eighteen-months-be1b0fbe37e4
- url
- https://medium.com/graph-praxis/the-graphrag-cost-cliff-how-33-000-became-33-in-eighteen-months-be1b0fbe37e4
- canonical_url
- https://medium.com/graph-praxis/the-graphrag-cost-cliff-how-33-000-became-33-in-eighteen-months-be1b0fbe37e4
- author_url
- https://medium.com/@shereshevsky
- status
- ok
- fetched_at
- 2026-06-09 15:37:30