Generational ZGC: How Java 21 cuts pause times without sacrificing throughput
Your application just hit 10TB of heap. G1 starts pausing for seconds at a time. You switch to ZGC and pause times drop to microseconds…
Generational ZGC: How Java 21 cuts pause times without sacrificing throughput
Your application just hit 10TB of heap. G1 starts pausing for seconds at a time. You switch to ZGC and pause times drop to microseconds; but now you’re burning through memory and CPU trying to keep up with garbage collection. The problem? ZGC treats all objects the same, collecting everything every time it runs.
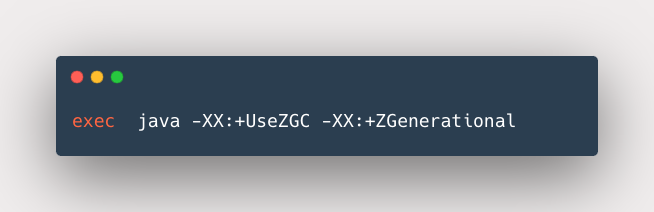
Java 21 changes that. Generational ZGC separates young objects (which die quickly) from old objects (which stick around), letting the collector focus on the high-yield work. You get the same sub-millisecond pauses, but with lower memory overhead, fewer allocation stalls, and less CPU waste.
This isn’t a theoretical improvement. The weak generational hypothesis has proven itself across decades of GC research: most objects die young. By collecting young objects more frequently, Generational ZGC reclaims more memory with fewer resources. The result is ZGC that works better for most applications, without manual tuning.
Here’s what you need to know to use it effectively.
Why ZGC needed generations
ZGC solved the latency problem. Since JDK 15, it’s delivered sub-millisecond pause times, regardless of whether your heap is 500MB or 5TB. For applications where latency matters more than anything else, ZGC is the answer.
But there’s a catch. Non-generational ZGC collects all objects every time it runs. Your application creates thousands of short-lived request objects, session tokens, and temporary buffers; ZGC scans through long-lived configuration objects, connection pools, and caches to collect them. This works fine when you have CPU and memory to spare. When resources get tight, you see allocation stalls, higher memory usage, and increased CPU overhead.
The problem isn’t ZGC’s design. It’s that treating all objects equally wastes resources on objects that don’t need frequent collection.
public class DunderMifflinServer {
    // Long-lived objects: survive for hours
    private static final Map<String, Employee> employeeDirectory = new ConcurrentHashMap<>();
    private static final ConnectionPool salesforceConnections = new ConnectionPool(50);
    private static final Config serverConfig = Config.load("application.properties");

    // Short-lived objects: die within milliseconds
    public Response handleSalesRequest(Request request) {
        // These objects become garbage before the response completes
        RequestContext context = new RequestContext(request);
        ValidationResult validation = validator.validate(context);
        SalesData data = repository.findSales(validation.getCustomerId());

        // Response object also becomes garbage quickly
        return new Response(data.toJson(), 200);
    }
}
In this Dunder Mifflin paper company server, employeeDirectory, salesforceConnections, and serverConfig stick around for the application's entire lifecycle. Meanwhile, context, validation, data, and the response object become garbage within milliseconds. Non-generational ZGC scans through all the long-lived employee records and connection pools every time it needs to collect those temporary request objects.
Most objects die within milliseconds of allocation. Configuration loaded at startup? Still there hours later. HTTP request object? Gone before the response completes. Generational ZGC exploits this pattern by splitting the heap into two logical generations and collecting the profitable young generation more frequently.
How the generational hypothesis saves resources
The weak generational hypothesis states: young objects tend to die young, while old objects tend to stick around.
This observation, backed by decades of production systems, explains why generational collection works. Scanning through gigabytes of old objects to find dead young objects wastes CPU. Keeping memory reserved for old objects that might stick around wastes heap space. Collecting young objects separately yields more memory per CPU cycle spent.
Think of it like organizing the warehouse at Dunder Mifflin. The paper reams from last year’s inventory? Still valuable, neatly stacked. The torn shipping boxes and coffee cups from this morning? Trash. You don’t reorganize the entire warehouse to throw away today’s garbage.
Generational ZGC applies this principle:
- Young generation: holds recently allocated objects
- Old generation: holds objects that survived several young collections
- Each generation collects independently
- Young collections happen frequently (high yield, low cost)
- Old collections happen only when needed (low yield, high cost)
The result: lower allocation stalls (young generation frees memory quickly), lower heap overhead (memory reclaimed more efficiently), and lower CPU overhead (less work scanning old objects).
Here’s what this looks like in practice:
public class PaperOrderProcessor {
    // Old generation candidates: survive multiple young collections
    private final PricingEngine pricingEngine = new PricingEngine();
    private final InventoryCache inventory = new InventoryCache();

    public OrderConfirmation processOrder(Customer customer, List<String> items) {
        // Young generation objects: die before method returns
        BigDecimal subtotal = BigDecimal.ZERO;
        List<OrderLine> lines = new ArrayList<>();

        for (String item : items) {
            PaperProduct product = inventory.lookup(item);
            BigDecimal price = pricingEngine.calculatePrice(product, customer);
            lines.add(new OrderLine(product, price));
            subtotal = subtotal.add(price);
        }

        // These temporary calculations become garbage immediately
        BigDecimal tax = subtotal.multiply(new BigDecimal("0.07"));
        BigDecimal total = subtotal.add(tax);

        return new OrderConfirmation(customer, lines, total);
    }
}
When Generational ZGC runs a young collection, it focuses on subtotal, lines, price, tax, total, and the temporary OrderLine objects. The pricingEngine and inventory objects sit safely in the old generation, untouched. This targeted collection reclaims memory faster and uses less CPU than scanning everything.
Enabling Generational ZGC in Java 21
Java 21 ships with both non-generational and Generational ZGC. Non-generational ZGC remains the default for backward compatibility, but Generational ZGC is the future.
# Enable Generational ZGC
java -XX:+UseZGC -XX:+ZGenerational -Xmx16g DunderMifflinApp
That’s it. Two flags: -XX:+UseZGC to select ZGC, and -XX:+ZGenerational to enable generational mode. No heap sizing beyond -Xmx, no generation ratios, no tenuring thresholds. Generational ZGC configures itself.
The migration path is clear:
- Java 21: Generational ZGC is opt-in via
-XX:+ZGenerational - Future release: Generational ZGC becomes default;
-XX:-ZGenerationalopts out - Later release: Non-generational ZGC removed;
ZGenerationalflag becomes obsolete
This phased approach lets teams test Generational ZGC in production before it becomes the default.
# Non-generational ZGC (current default in Java 21)
java -XX:+UseZGC -Xmx16g DunderMifflinApp

# Generational ZGC (opt-in in Java 21)
java -XX:+UseZGC -XX:+ZGenerational -Xmx16g DunderMifflinApp

# Future: Generational ZGC will be default
# java -XX:+UseZGC -Xmx16g DunderMifflinApp  # Will use generational mode

# Future: Opt out of generational mode
# java -XX:+UseZGC -XX:-ZGenerational -Xmx16g DunderMifflinApp
Notice what’s missing: no -Xmn for young generation size, no -XX:NewRatio for generation proportions, no -XX:MaxTenuringThreshold for promotion age. Generational ZGC handles all of this automatically based on your application's allocation patterns.
How Generational ZGC maintains sub-millisecond pauses
Generational ZGC preserves everything that makes ZGC powerful: concurrent collection, sub-millisecond pauses, and support for multi-terabyte heaps. The generational split adds complexity, but the core mechanisms remain.
Colored pointers and concurrent collection
ZGC uses colored pointers: 64-bit object references that encode both the object’s address and metadata about its state. The metadata describes whether the object is known to be alive, whether its address is current, and other information the collector needs.
When ZGC runs concurrently with your application, it reads and modifies the object graph at the same time your code does. Colored pointers let ZGC give your application a consistent view of the heap, even while objects move and metadata changes.
// Illustrative representation of colored pointer concept
// (actual bit layout is implementation-specific)

// A colored pointer combines object address with GC metadata
// The metadata bits track marking and relocation status

// Example: Reference to an Employee object
// Address:  0x00007F8A4C2B1000
// Metadata: Marked, not relocated, young generation
// Combined into single 64-bit pointer
The colored pointer tells ZGC whether the object at that address is marked as live, whether it’s been relocated during collection, and which generation it belongs to. Your application never sees this metadata; load barriers intercept reference reads and handle the bookkeeping transparently.
Load barriers and store barriers
Generational ZGC injects two types of barriers into your application code:
Load barriers execute when your code reads an object reference from a field. The barrier interprets the colored pointer’s metadata and updates the address if the object moved. After the first load barrier updates a reference, subsequent loads see the updated metadata and skip the check.
Store barriers execute when your code writes an object reference into a field. Generational ZGC uses store barriers to track references between generations. If an old object points to a young object, the collector needs to know about it during young generation collection. Store barriers record these inter-generational pointers efficiently.
public class SalesTeam {
    private Employee manager;  // Old generation object
    private List<SalesPerson> team;  // Old generation collection

    public void assignNewHire(SalesPerson newHire) {
        // Store barrier fires here
        // ZGC records: old object (team) now references young object (newHire)
        team.add(newHire);
    }

    public Employee getManager() {
        // Load barrier fires here
        // ZGC checks: has manager been relocated? Update reference if needed
        return manager;
    }
}
The barriers sound expensive, but Generational ZGC optimizes them heavily. Colored pointers let store barriers check metadata bits to determine if work is needed, avoiding unnecessary bookkeeping. Moving marking work from load barriers to store barriers reduces load barrier overhead, which matters because loads typically execute more frequently than stores.
Independent generation collection
The young and old generations collect independently. When Generational ZGC runs a young collection, it scans references from the old generation into the young generation (tracked via store barriers), then collects only young objects. Old objects remain untouched.
Objects that survive several young collections get promoted to the old generation. Generational ZGC handles this automatically; no configuration needed.
// Allocation and collection timeline

// T0: Application starts
Employee michael = new Employee("Michael Scott");  // Allocated in young gen

// T1: First young collection
// michael survives (still referenced) - stays in young gen

// T2: Second young collection
// michael survives again - stays in young gen

// T3: Third young collection
// michael survives - promoted to old gen (proven to be long-lived)

// T4-T100: Many young collections happen
// michael stays in old gen, not scanned during young collections

// T101: Full collection (young + old)
// michael still alive - remains in old gen
Old collections still happen, but less frequently. Since old objects die slowly, old collections yield less memory and happen only when the old generation fills.
Pro tip: Young collections typically complete in hundreds of microseconds. Full collections (young + old) take longer but still maintain sub-millisecond pause times. The key is that young collections happen far more frequently, keeping allocation stalls low.
Performance improvements you can measure
Generational ZGC delivers three concrete improvements over non-generational ZGC:
- Lower allocation stalls: Young collections reclaim memory quickly and frequently, reducing the chance that your application threads block waiting for free memory.
- Lower heap overhead: More efficient memory reclamation means you need less total heap size for the same application. JEP 439 notes that Generational ZGC reduces required heap memory overhead compared to non-generational ZGC.
- Lower GC CPU overhead: Collecting young objects frequently (cheap) instead of all objects equally often (expensive) reduces total CPU spent on garbage collection. More CPU remains available for application work.
# Example GC log output (format may vary by Java version)
# Non-generational ZGC - collects entire heap each cycle

[2025-12-31T10:15:23.456-0500] GC(142) Garbage Collection (Warmup)
[2025-12-31T10:15:23.457-0500] GC(142) Pause Mark Start 0.024ms
[2025-12-31T10:15:23.512-0500] GC(142) Concurrent Mark 54.234ms
[2025-12-31T10:15:23.513-0500] GC(142) Pause Mark End 0.031ms
[2025-12-31T10:15:23.623-0500] GC(142) Concurrent Relocate 55.432ms
[2025-12-31T10:15:23.623-0500] GC(142) Memory: 22G(23G)->18G(23G)

# Generational ZGC - young collections complete faster

[2025-12-31T10:15:23.456-0500] GC(142) Young Collection
[2025-12-31T10:15:23.457-0500] GC(142) Pause Mark Start 0.019ms
[2025-12-31T10:15:23.478-0500] GC(142) Concurrent Mark 20.123ms
[2025-12-31T10:15:23.479-0500] GC(142) Pause Mark End 0.022ms
[2025-12-31T10:15:23.512-0500] GC(142) Concurrent Relocate 32.891ms
[2025-12-31T10:15:23.512-0500] GC(142) Memory: 22G(23G)->16G(23G)
These improvements matter most for applications with allocation-heavy workloads: web servers creating request objects, data processing pipelines building temporary structures, or streaming applications with high object churn.
The Dunder Mifflin paper ordering system processes thousands of orders per second. Each order creates temporary validation objects, pricing calculations, and response builders. With non-generational ZGC, every collection scans through the entire inventory cache and customer database. With Generational ZGC, young collections focus on the short-lived order processing objects, reclaiming memory faster and using less CPU.
Watch out: Generational ZGC still requires sufficient CPU and memory resources. The improvements reduce overhead, but you can’t run with zero headroom. If your application barely keeps up with non-generational ZGC, Generational ZGC helps but won’t eliminate the resource constraint.
What you don’t need to configure
One of ZGC’s strengths is minimal configuration. Generational ZGC maintains this principle. You don’t need to tune:
- Generation sizes: Generational ZGC determines young and old generation sizes dynamically based on allocation patterns and collection results. No
-Xmnor ratios to set. - GC thread counts: The collector selects the appropriate number of concurrent and parallel threads based on your system. No manual tuning required.
- Tenuring thresholds: Generational ZGC decides when to promote objects from young to old automatically. No
-XX:MaxTenuringThresholdneeded. - Heap regions: Unlike G1, you don’t configure region sizes or counts. Generational ZGC handles this internally.
# G1 configuration (lots of tuning knobs)
java -XX:+UseG1GC \
     -Xmx16g \
     -Xmn4g \
     -XX:MaxGCPauseMillis=200 \
     -XX:G1HeapRegionSize=16m \
     -XX:InitiatingHeapOccupancyPercent=45 \
     -XX:G1ReservePercent=10 \
     -XX:MaxTenuringThreshold=15 \
     DunderMifflinApp

# Generational ZGC configuration (minimal)
java -XX:+UseZGC \
     -XX:+ZGenerational \
     -Xmx16g \
     DunderMifflinApp
The only required configuration is the heap size (-Xmx), which you'd set for any collector. Everything else is automatic.
Common mistakes to avoid
- Mistake 1: Applying G1 tuning patterns to ZGC
G1 benefits from tuning pause time goals, region sizes, and generation ratios. ZGC doesn’t. If you’re migrating from G1, resist the urge to carry over tuning flags. Start with just -XX:+UseZGC -XX:+ZGenerational and measure.
# Wrong - trying to tune Generational ZGC like G1
java -XX:+UseZGC \
     -XX:+ZGenerational \
     -Xmx16g \
     -Xmn4g \                          # Ignored - ZGC sets young size dynamically
     -XX:MaxGCPauseMillis=10 \         # Ignored - ZGC doesn't use pause time goals
     -XX:G1HeapRegionSize=16m \        # Wrong collector
     DunderMifflinApp

# Right - let Generational ZGC configure itself
java -XX:+UseZGC \
     -XX:+ZGenerational \
     -Xmx16g \
     DunderMifflinApp
2. Mistake 2: Assuming Generational ZGC eliminates resource requirements
Generational ZGC reduces overhead, but concurrent collection still needs CPU headroom and memory overhead. If you’re running at 95% CPU utilization with non-generational ZGC, Generational ZGC helps but won’t magically solve the capacity problem.
3. Mistake 3: Forgetting the -XX:+UseZGC flag
-XX:+ZGenerational alone doesn't enable ZGC. You need both -XX:+UseZGC and -XX:+ZGenerational. Without the first flag, the JVM uses the default collector and ignores the generational flag.
# Wrong - missing -XX:+UseZGC
java -XX:+ZGenerational -Xmx16g DunderMifflinApp
# Uses G1 (default collector), ignores ZGenerational flag

# Right - both flags present
java -XX:+UseZGC -XX:+ZGenerational -Xmx16g DunderMifflinApp
4. Mistake 4: Over-monitoring GC behavior
ZGC’s concurrent design means GC activity happens constantly in the background. Don’t panic when you see ongoing GC work; that’s normal. Focus on pause times and allocation stall rates, not the frequency of GC cycles.
When to use Generational ZGC
Generational ZGC makes sense for applications where:
- Latency requirements are strict: If your SLA demands sub-10ms response times, Generational ZGC’s sub-millisecond pauses prevent GC from becoming the bottleneck. The Dunder Mifflin order API promises sub-5ms p99 latency; Generational ZGC delivers.
- Heap sizes are large: Multi-gigabyte to multi-terabyte heaps benefit most. For small heaps (under 1GB), the default G1 collector often performs well enough.
- Allocation rates are high: Applications that create and discard many short-lived objects (web servers, stream processors, request handlers) see the biggest gains from generational collection.
- Resources are constrained: If you’re trying to reduce heap size or CPU usage without increasing pause times, Generational ZGC’s efficiency improvements help.
// Good candidate for Generational ZGC
public class HighThroughputOrderService {
    // Large heap needed for customer cache and inventory
    private final Cache<String, Customer> customerCache =
        CacheBuilder.newBuilder()
            .maximumSize(10_000_000)  // 10M customers
            .build();

    // High allocation rate - processes 50K orders/second
    public CompletableFuture<OrderResult> processOrder(OrderRequest request) {
        // Creates many temporary objects per request
        ValidationContext ctx = new ValidationContext(request);
        PricingContext pricing = calculatePricing(ctx);
        ShippingContext shipping = calculateShipping(ctx);
        PaymentContext payment = processPayment(ctx, pricing);

        return CompletableFuture.completedFuture(
            new OrderResult(pricing, shipping, payment)
        );
    }
}
Generational ZGC might not be the best choice if your application has:
- Small heaps (under 1GB) where G1 performs well
- Extremely tight memory constraints where Serial GC’s low overhead matters
- Workloads with minimal allocation where GC isn’t the bottleneck
Verifying Generational ZGC is active
After enabling Generational ZGC, verify it’s running correctly. The JVM logs at startup indicate which collector is active.
# Run with GC logging enabled
java -XX:+UseZGC \
     -XX:+ZGenerational \
     -Xlog:gc*:file=gc.log \
     -Xmx16g \
     DunderMifflinApp

# Example startup log (format may vary)
[0.123s][info][gc] Using The Z Garbage Collector
[0.124s][info][gc] Min Heap Size: 16M
[0.124s][info][gc] Max Heap Size: 16384M
[0.125s][info][gc] Concurrent GC Threads: 4
[0.125s][info][gc] Parallel GC Threads: 8
Look for confirmation that ZGC is enabled. The exact log format depends on your Java version and logging configuration.
GC logs confirm generational behavior. You’ll see young collections happening frequently and old collections happening less often. Monitor your logs to observe the collection patterns.
# Example GC log showing generational collection pattern
# (actual format and labels may vary by Java version)

[12.456s][info][gc] GC(45) Young Collection
[12.457s][info][gc] GC(45) Pause Mark Start 0.018ms
[12.489s][info][gc] GC(45) Pause Mark End 0.023ms
[12.512s][info][gc] GC(45) Young: 2048M->512M
[18.234s][info][gc] GC(46) Young Collection
[18.235s][info][gc] GC(46) Pause Mark Start 0.021ms
[18.267s][info][gc] GC(46) Pause Mark End 0.019ms
[18.289s][info][gc] GC(46) Young: 2048M->498M
[45.678s][info][gc] GC(47) Old Collection
[45.679s][info][gc] GC(47) Pause Mark Start 0.034ms
[45.823s][info][gc] GC(47) Pause Mark End 0.041ms
[46.012s][info][gc] GC(47) Heap: 14336M->8192M
Monitoring tools like JMX or GC log parsers show pause time distributions, allocation rates, and heap usage patterns. Look for pause times consistently under 1ms and frequent young collections with infrequent old collections.
Where to go from here
Generational ZGC is production-ready in Java 21. The improvements over non-generational ZGC make it suitable for most latency-sensitive applications with large heaps.
Start by testing Generational ZGC in a staging environment. Measure pause times, throughput, and resource usage compared to your current collector. In most cases, you’ll see lower pause times and reduced memory overhead without configuration changes.
When you’re ready to deploy, the migration path is straightforward: add -XX:+ZGenerational to your existing -XX:+UseZGC configuration. Monitor the results, but resist the urge to tune. Generational ZGC configures itself.
The official resources provide deeper technical details:
- JEP 439: Generational ZGC — Complete specification and design rationale
- Java Platform, Standard Edition HotSpot Virtual Machine Garbage Collection Tuning Guide — Oracle’s official GC tuning documentation
Generational ZGC represents the next evolution of low-latency garbage collection in Java. By focusing on young objects, it delivers better performance with the same operational simplicity that made ZGC successful. The Dunder Mifflin paper company runs on it. Your application can too.
메타데이터
- post_id
- bfb72efa767c
- slug
- generational-zgc-how-java-21-cuts-pause-times-without-sacrificing-throughput-bfb72efa767c
- url
- https://blog.stackademic.com/generational-zgc-how-java-21-cuts-pause-times-without-sacrificing-throughput-bfb72efa767c
- canonical_url
- https://blog.stackademic.com/generational-zgc-how-java-21-cuts-pause-times-without-sacrificing-throughput-bfb72efa767c
- author_url
- https://medium.com/@sarathm09
- status
- ok
- fetched_at
- 2026-06-14 11:28:49