Grafana, ClickHouse & Go for Income and Expense Analytics
Some time ago I switched from DeutscheBank to C24 Bank. C24 offers better service (specifically for me) and better opportunities for…
Grafana, ClickHouse & Go for Income and Expense Analytics
Some time ago I switched from DeutscheBank to C24 Bank. C24 offers better service (specifically for me) and better opportunities for analyzing expenses and income. The mobile/web application also provides a good dashboard to break transactions into categories and analyze them.
But I wanted to have more flexible features:
- the ability to group transactions into small categories;
- create custom categories;
- or not take into account some transactions, for example, transfers between accounts.
So the idea came up to create this service in order to analyze transactions as I want.
That’s exactly what c24-expences, a lightweight project achieves—by weaving together Go, ClickHouse, and Grafana into a seamless pipeline for expense tracking and visualization.
Why This Stack?
- ClickHouse: A high-performance analytical database known for rapid queries over massive datasets.
- Grafana: The go-to dashboarding platform, great for building interactive visualizations and alerting.
- Go (Golang): Efficient, strongly typed, and perfect for writing fast data parsers and processing
Project Architecture & Workflow
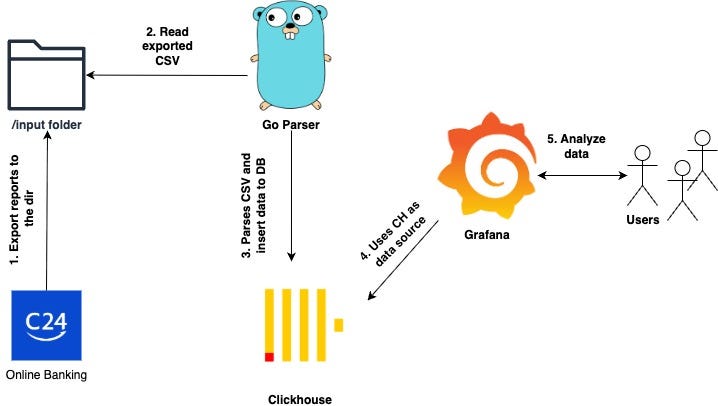
1. Input & Parsing (Go)
You start by exporting transactions from your C24 bank (CSV format) and dropping them into an ./input/ directory. How to export data can be found by the next link.
The Go parser located in pkg/c24parser then takes over—reading, cleaning, and categorizing each entry. It even maps German terms to English to standardize your data. Right now it’s all hardcoded to my needs, but later I want to add the ability to configure it through configs.
2. Storage (ClickHouse) Once parsed, transactions are ingested into ClickHouse, optimized for analytical workloads and fast aggregations.
3. Visualization (Grafana)
Grafana is preconfigured in the grafana/ folder—including dashboards and data source provisioning. Imporant! You'll need the Grafana ClickHouse plugin, with data stored under dist/grafana-clickhouse-datasource.
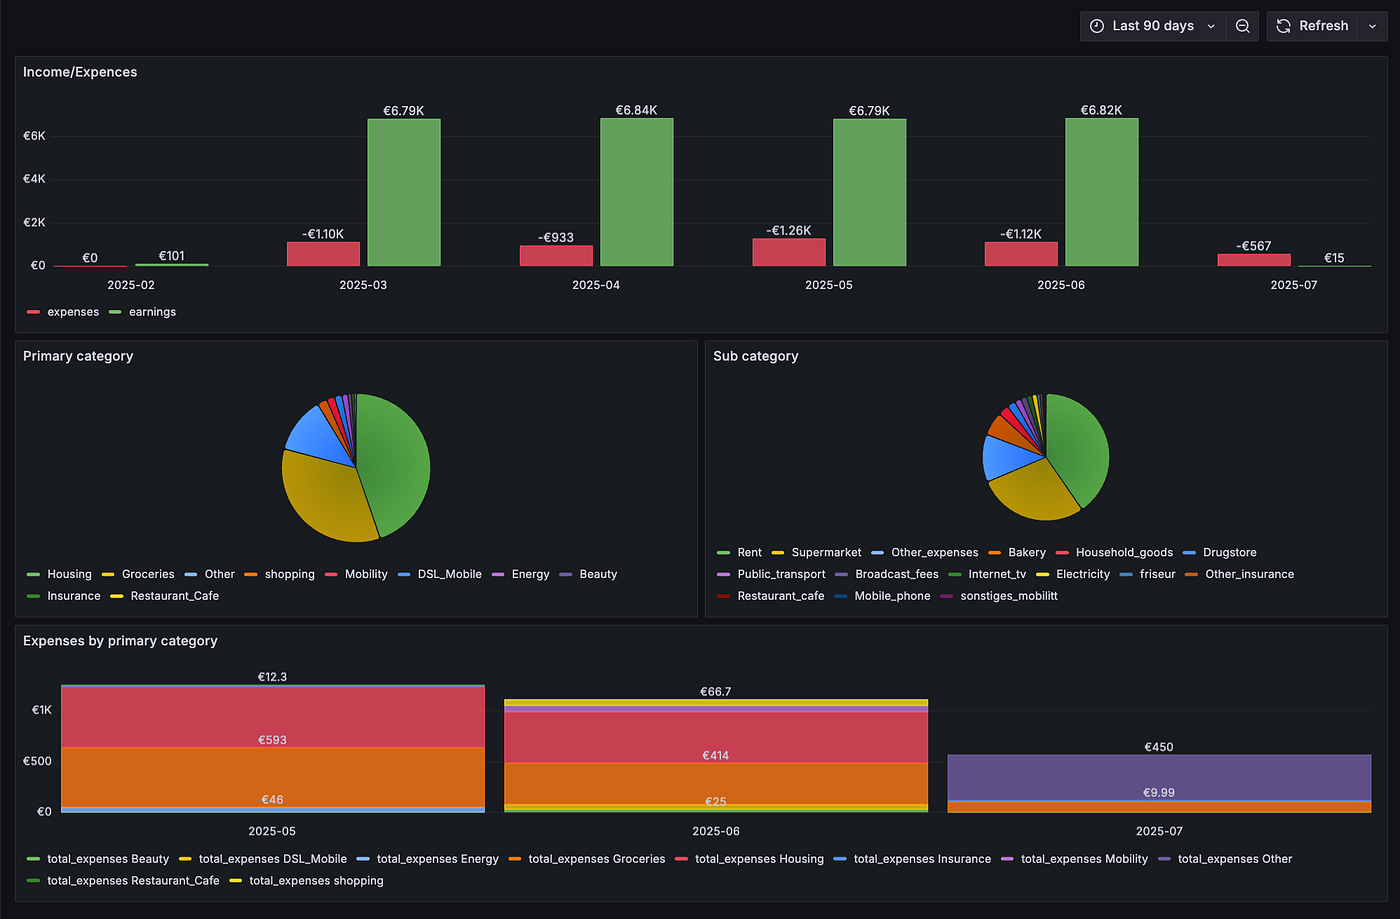
Grafana dashboard
4. Orchestration (Docker + Make) Everything runs in containers. Use commands like:
make setup     # Install dependencies, configure
make run       # Launch docker-compose and start containers
make stop      # Stop everything
Then open up Grafana at http://localhost:3000 to see your dashboards instantly.
What’s Next?
A few enhancements of c24-expences that I plan to do:
- UI-based Configuration: Currently, parser logic lives in
categoriser.go. Building a UI or config layer would let for everyone tweak categories without touching Go code. - Add New Data Sources: Expand to ingest transaction data from other banks or formats( but it can be complicated because I don’t have a lot of bank accounts)
Final Thoughts
The c24-expences project demonstrates how modern tech—Go for parsing, ClickHouse for data crunching, and Grafana for visuals—can transform raw financial data into a dynamic, interactive financial dashboard
Let me know if you’d like help enhancing the parser UI, adding new data sources, or crafting more Grafana visualizations — I’d be happy to assist!
Links
- Github repo: https://github.com/13excite/c24-expences
- Clickhouse: https://clickhouse.com/clickhouse
- Grafana-clickhouse-datasource: https://grafana.com/grafana/plugins/grafana-clickhouse-datasource/
- C24 Online Banking: https://www.c24.de/online-banking
- How to export transactions CSV from C24: https://hilfe.c24.de/hc/de/articles/8082169487250-Wie-kann-ich-meine-Transaktionen-exportieren
메타데이터
- post_id
- bfbcd2d00962
- slug
- grafana-clickhouse-go-for-income-and-expense-analytics-bfbcd2d00962
- url
- https://medium.com/@originalrad50/grafana-clickhouse-go-for-income-and-expense-analytics-bfbcd2d00962
- canonical_url
- https://medium.com/@originalrad50/grafana-clickhouse-go-for-income-and-expense-analytics-bfbcd2d00962
- author_url
- https://medium.com/@originalrad50
- status
- ok
- fetched_at
- 2026-07-18 06:18:28