Outlier Detection with the IQR Method: A Complete Guide
Dealing with outliers is a crucial step in data preprocessing. Extreme values can distort statistical insights, degrade model performance…
Outlier Detection with the IQR Method: A Complete Guide
Dealing with outliers is a crucial step in data preprocessing. Extreme values can distort statistical insights, degrade model performance, and skew interpretations. One of the most robust and widely used techniques for detecting outliers — especially in skewed distributions — is the Interquartile Range (IQR) method.
What Are Outliers?
An outlier is a data point that significantly deviates from the rest of the data. Outliers can arise due to:
- Errors in data entry or measurement (e.g., faulty sensors).
- Rare events or legitimate extremes (e.g., market anomalies, luxury home prices).
- Observations from a different distribution than the majority (e.g., fraud detection scenarios).
Identifying and handling outliers improves data quality, enhances analysis accuracy, and ensures more reliable model outcomes.
Why Choose the IQR Method?
Many traditional techniques rely on the assumption of normality — like Z-scores or the 3-sigma rule — which become unreliable when dealing with skewed data. The IQR method, however, is non-parametric and makes no assumptions about distribution shape, making it inherently more robust. It’s ideal for distributions with long tails, skew, or multiple peaks.
Understanding Box Plots and Percentiles
A box plot visualizes distribution by indicating:
- Q1 (25th percentile): 25% of data falls below this point.
- Median (50th percentile): The middle of the data.
- Q3 (75th percentile): 75% of data falls below this point.
The Interquartile Range (IQR) captures the middle 50%:

This focuses on the “core” of the distribution, ignoring extreme tails.
The IQR Outlier Detection Rules
Using the IQR, outliers are identified via the IQR proximity rule, which defines:
- Lower bound = Q1−1.5×IQRQ1–1.5 \times IQR
- Upper bound = Q3+1.5×IQRQ3 + 1.5 \times IQR
Any data point outside this range is considered an outlier:
- Below the lower bound
- Above the upper bound
The multiplier 1.5 is a convention that balances sensitivity and robustness across domains.
Why This Works
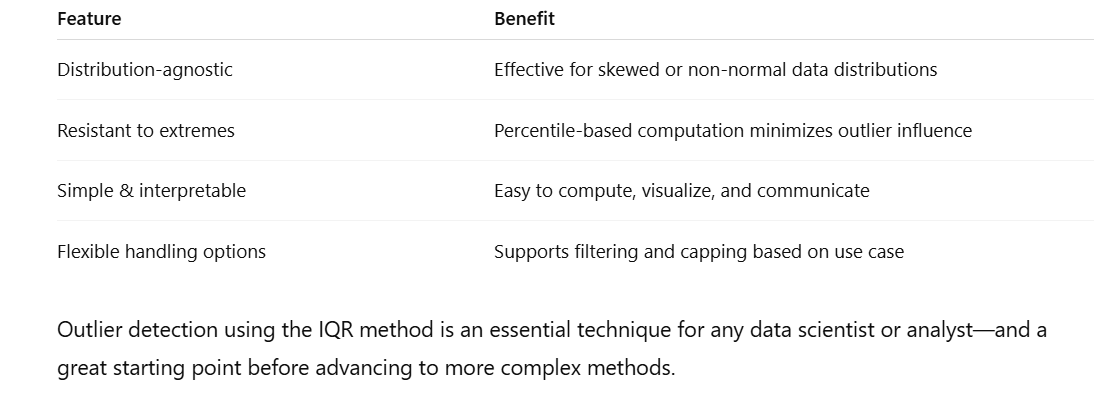
- Distribution-agnostic: Works well regardless of skew or modality.
- Resistant to extremes: Since it’s based on percentiles, extreme values have minimal impact on Q1 and Q3.
- Simple and interpretable: Easy to compute, explain, and justify.
- Widely applicable: Used across industries in fields such as finance, healthcare, housing, and manufacturing.
Handling Outliers: Options & Trade-offs
Once outliers are detected using IQR, you typically choose one of two paths:
- Removal (Filtering): Drop the data points outside the bounds.
- Pros: Cleaner dataset, easier modeling.
- Cons: Reduced sample size, potential loss of rare but valuable data.
- Capping (Trimming / Winsorizing): Replace values beyond the bounds with the nearest valid threshold (i.e., lower or upper bound value).
- Pros: Maintains dataset size and structure.
- Cons: Can distort original values, may mask meaningful extremes.
Choose based on your task: Do outliers represent noise or signal?
Best Practices
- Visualize first: Use box plots and histograms before and after cleaning to assess impact.
- Document bounds: Clearly report Q1, Q3, IQR, and the computed limits for reproducibility.
- Consider domain context: In some cases (e.g., fraud), outliers are precisely what you’re seeking.
- Combine with domain knowledge: Supplement IQR with subject-matter understanding, especially with highly skewed or multi-modal data.
Summary
Python Implementation of IQR Method
Let’s implement the IQR method step by step using Python.
import numpy as np
import pandas as pd
import seaborn as sns
import matplotlib.pyplot as plt

# Sample dataset: House prices (in lakhs)
data = [30, 35, 40, 45, 50, 55, 60, 80, 90, 100, 120, 200, 250, 300]

df = pd.DataFrame(data, columns=["HousePrice"])

# Step 1: Calculate Q1, Q3, and IQR
Q1 = df["HousePrice"].quantile(0.25)
Q3 = df["HousePrice"].quantile(0.75)
IQR = Q3 - Q1

# Step 2: Define bounds
lower_bound = Q1 - 1.5 * IQR
upper_bound = Q3 + 1.5 * IQR

print(f"Q1 = {Q1}, Q3 = {Q3}, IQR = {IQR}")
print(f"Lower bound = {lower_bound}, Upper bound = {upper_bound}")

# Step 3: Detect outliers
outliers = df[(df["HousePrice"] < lower_bound) | (df["HousePrice"] > upper_bound)]
print("\nOutliers detected:\n", outliers)

# Step 4: Visualization (Boxplot)
plt.figure(figsize=(6,4))
sns.boxplot(x=df["HousePrice"], color="skyblue")
plt.title("Outlier Detection using IQR")
plt.show()
Output

👉 Any house priced above ₹232.5 lakhs is flagged as an outlier. In this dataset, ₹250 lakhs and ₹300 lakhs are detected as outliers.
The box plot will clearly show whiskers (bounds) and dots (outliers).
🎯 Key
- The IQR method is powerful for skewed data like house prices, salaries, or medical costs.
- Outliers can be either removed or capped depending on the analysis context.
- Always visualize before and after applying IQR filtering to make informed decisions.
메타데이터
- post_id
- c0199bbc10bd
- slug
- outlier-detection-with-the-iqr-method-a-complete-guide-c0199bbc10bd
- url
- https://medium.com/@morepravin1989/outlier-detection-with-the-iqr-method-a-complete-guide-c0199bbc10bd
- canonical_url
- https://medium.com/@morepravin1989/outlier-detection-with-the-iqr-method-a-complete-guide-c0199bbc10bd
- author_url
- https://medium.com/@morepravin1989
- status
- ok
- fetched_at
- 2026-07-17 19:42:24





