YOU MUST EAT THIS GRAPH NEWS, GRAPH OMAKASE. 4 weeks MARCH
Hello, I’m Chef Graff Omakase. This week’s preview and keywords are as follows.
YOU MUST EAT THIS GRAPH NEWS, GRAPH OMAKASE. 4 weeks MARCH
Hello, I’m Chef Graff Omakase. This week’s preview and keywords are as follows.
PREVIEW
[Equivalence between virtual literature and real situations — Analysis through network science]
[The shortest negative weight]
[Updating pyg!!!]
[Overview of GNN mini-batch techniques and cool approach]
Keywords
-
What is society like in terms of real social phenomena? Explore and interpret based on network theory.
-
Updated pyg for Torch 2.0 reorganization!! How does it work and how to use the compile?
-
Endless worries for GNN mini-batching, what is the answer? From raising problems to realistic measures that can be applied to the field
-
For those of you who had the question why is it only suitable for the shortest route to use the weight of the sheep!! A methodology has emerged that suggests negative weight is also possible!
Social network analysis of Japanese manga: similarities to real-world social networks and trends over decades
[https://arxiv.org/pdf/2303.07208.pdf]
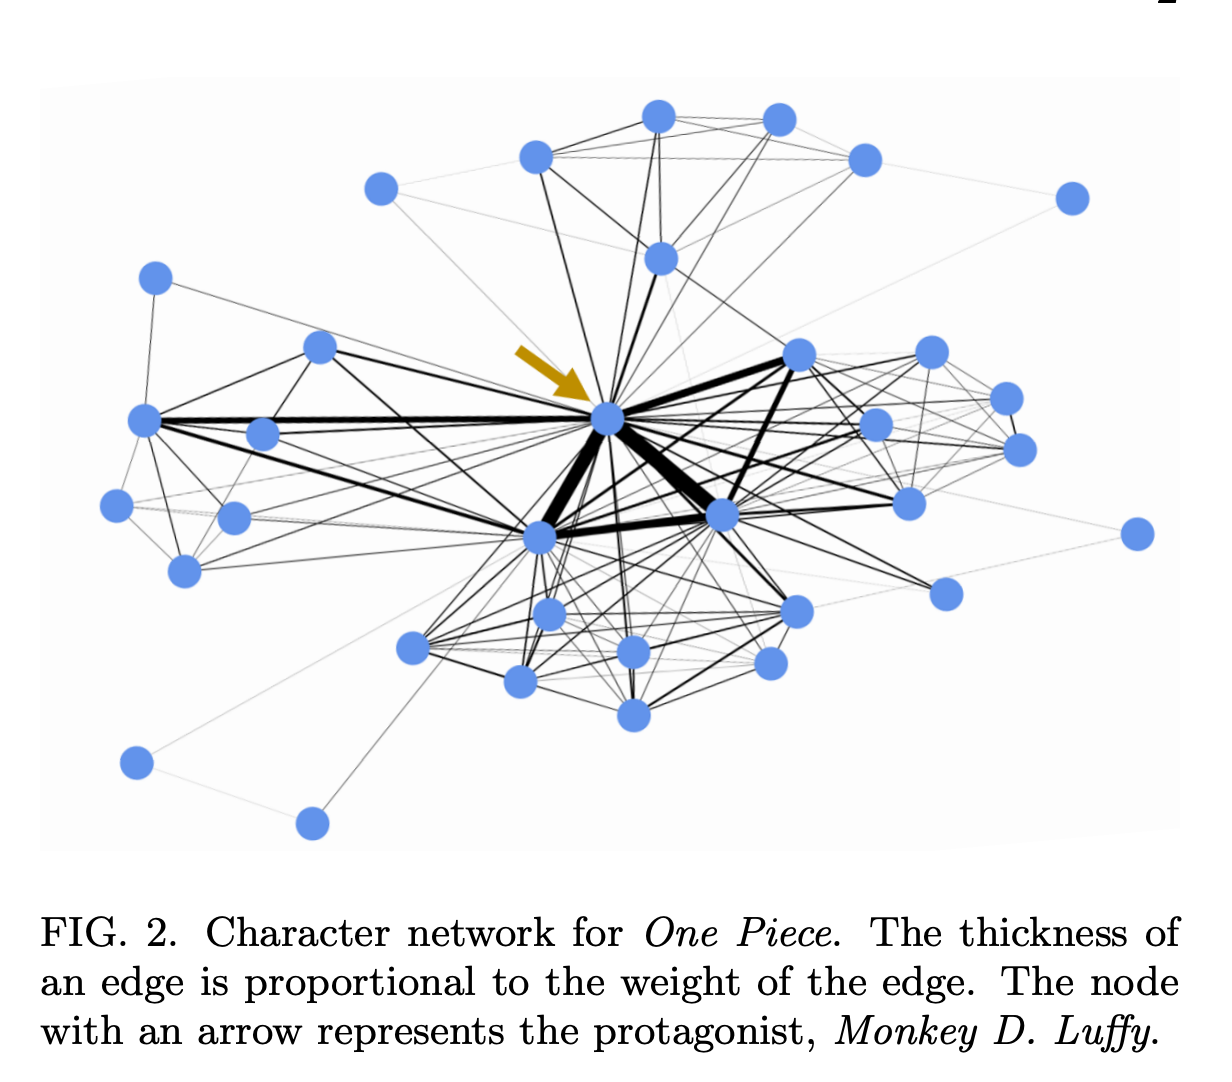
- When do you feel the graph data? I think it was most easy to understand and fun when things or human relationships around me were expressed intuitively. I think it’s because I have an unconscious understanding of the data domain. I think the graph of the relationship between characters in Game of Thrones American drama is a good representation of the case. As the scenario was vast, it was hard to remember each and every character with various roles appeared to increase the probability of the drama :) I guess not only I but also other people who watched the drama sympathized with it. It reminds me of a case where a network scientist expressed the relationship between drama characters with a knowledge graph.
- The reason why I mentioned the case of graphing the character relationship of the drama by referring to Game of Thrones at the beginning is that this paper has a similar context. It is a graph of the relationship between characters in Japanese comics! Previously, if we simply expressed the relationship visually and conducted a simple network analysis, we approach it more profoundly in this paper. We approach based on the following two hypotheses. 1. By analyzing cartoon characters that have appeared for 70 years, the trends now and then will be systematically different, and 2. These distributions will be similar to real-social networks. Aren’t you curious just by listening to it?
- To start with the results, similar to human social networks, cartoon characters have various connections. It is said that a small number of characters who appear disproportionately often on various pages lead the network. We analyze the results using network quantification indicators such as strength, average degree degree, bipartite → one-mode network and analysis, and assortability. Among them, the section that analyzed the Inter-Event Time (IET) distribution using the SI model was very interesting to the chef. In IET distribution, the interpretation of how the few characters in heavy, tailed affect the world was very interesting. I thought it would be very helpful for future ideas because it was so persuasive that I could feel that it was similar to the real world and logically described the technology of how I approached the methodology.
- If you benchmark the approach methodology and apply it to HR professionals in the field, I think you’ll get interesting results…! I think it will be very useful for those who are in the position of managing personnel in terms of quantifying performance measurements, but there will be a different perspective from the point of view of being managed I think this will be a double-edged sword
PyG 2.3.0
[https://github.com/pyg-team/pytorch_geometric/releases/tag/2.3.0]
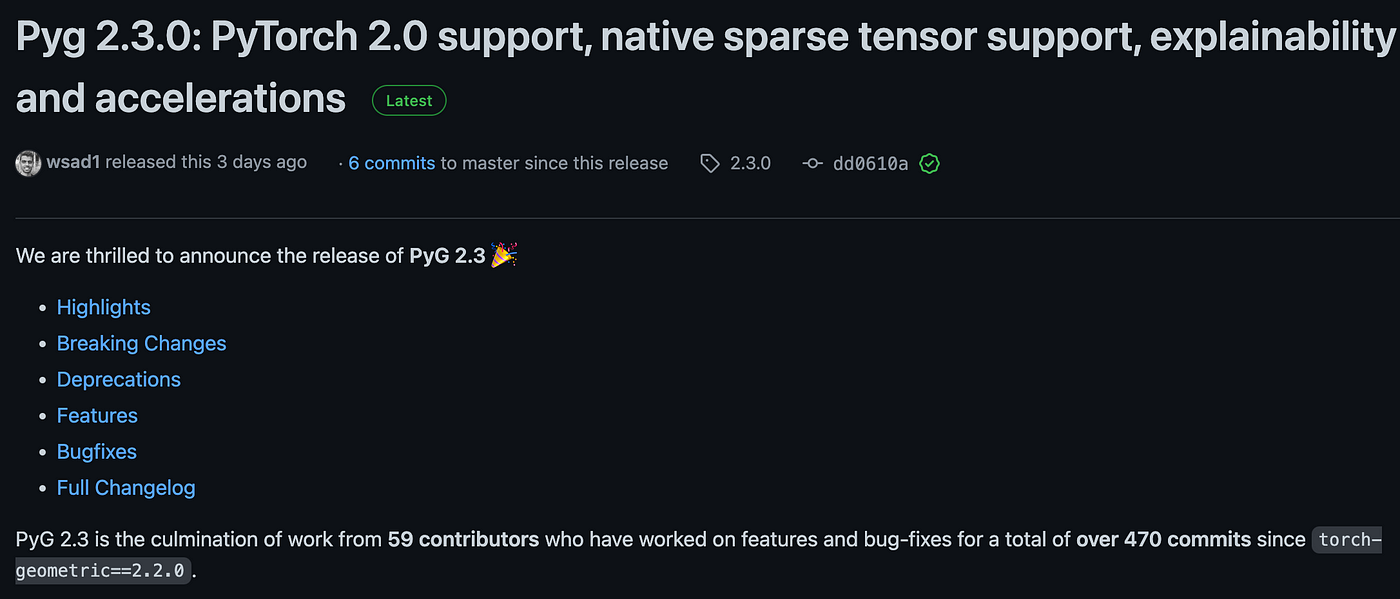
- PyG 2.3.0 Updated! As the torch 2.0 was reorganized, it was updated quickly! I’m really looking forward to how much performance will be improved if I combine the previous pyg-lib and torch.compile. Key updates include.
- PyTorch 2.0 Support
- **Infrastructure Changes
- ** there are now optional module torch (scatter , sparse, cluster , spline-conv) you just select one among them according to your task.
- Native PyTorch Sparse Tensor Support - now we use the flexible function to torch native tensor handling (sparse.tesnor).
- Explainability Framework - heterogeneous graph explanation & explainability metrics ease use support & ease to utilize visualization function. Accelerations - Nvidia(gpu),intel(cpu) acceleration.
Compiled Graph Neural Networks

- Speed-up mainly comes from reducing Python overhead and GPU read/write, so speed-up may vary depending on factors such as model architecture and batch size. For example, if the architecture of the model is simple and the data volume is high, the bottleneck would be GPU computing, and the observed speed gains might be less important. — Torch.compile() function description official document**
- To explain the function of the compile simply, it is to make the torch code Jitable. Jit stands for just-in-time, and if you use this function, you can think of it as translating the code more readable by the machine by converting it to interpret→compile. Of course, the time it takes for the interaction between the code and the machine will decrease, so it will speed up, right??
- Torch geometrics has also written the compile tutorial in the pyg official documentary. However, it is important to note that the torch scatter, sparse, and pyg_lib used in the message passing aggregation and update are not yet optimized in the compile(), so it is irrelevant to the update.
- ’torch.compile()’ works fantastically well on many PyG models. Overall, run-time is up nearly 300%.
- It has improved performance by nearly 300 times. There’s a lot of improvement. Some of you may have thought it would be difficult to apply, but you can experience this performance improvement with a single sentence: ‘model=torch_geometric.compile(model).’
ReFresh: Reducing Memory Access from Exploiting Stable Historical Embeddings for Graph Neural Network Training
[https://arxiv.org/pdf/2301.07482.pdf]

- This paper attempted to reduce cost by using tagging (cache) for every embedding to improve mini-batching, one of the many factors that cause cost in GNN. As the number of layers increases, the hop of hops manager also increases and the amount of information transmitted to message passing increases and decreases, and the amount of information increases significantly at certain times, while there is a decrease. So, the key is to analyze and store all of this dynamically in GPU memory, which is the part that stores and processes this information. In order to deal with this part dynamically, we optimize the feature by considering whether to reuse it or not using two indicators for each feature (grident).
- The core of this optimization, model architecture is divided into three categories. 1. The historical embedded cache — A module that performs cache marking for each gradient and manages the marking 2. A module for importing selected subgraphs well through the subgraph generator — policy. 3. The data loader — A module for feature and node fitting from the selected subgraph. These three work flexibly and derive optimal embedding values.
- Model mini-batching architecture takes accuracy performance similar to SOTA, but the key result is at least 4.6 times to 23.6 times before. What you should pay attention to is cache marking, which rather causes additional burden, which uses COO, CSR → CSR2 pruning techniques to solve. For your information, Torch.It’s a lot related to sparse, so I think it’ll be great if you cook it once!
- It is a paper with a well-logical development on how to solve from different in training large-scale GNN, motivation. I personally thought of the biggest problem, “bottleneck of GNN,” as a description of why this is a problem, so I took a closer look at it because I thought it was well written. As you can see from the author’s line-up, it is a result of joint research by industry-academic researchers such as mit Amazon, so it was considered to be more reliable because it was considered a paper that properly balanced ideal and reality in the field. I highly recommend that you read it through!
Finally, a Fast Algorithm for Shortest Paths on Negative Graphs

- It’s one of the origins that you encounter when you’re introducing graphs. *Seven Bridges of Königsberg’ We’ve incorporated graph theory to find a way to start at random points and cross seven bridges once to get back to where they were. For today’s generation, I think the term “one brush” will be more relatable. The reason why I’m bringing this up is to talk about the shortest-path, which is similar to the context. One of the areas where graph is best used today is navigation. Because finding the optimal distance between the starting point and the arriving point can also be viewed as the shortest path of graph theory problem. At this point, the edge located between the points is viewed as a road, and weight is specified according to the characteristics of the road. Depending on the traffic situation, the number of positive numbers is entered and reflected, and the optimal route is often inferred.
- However, in the shortest path, there are situations in which there is a ‘negative’ in addition to the positive in the edge. If you think about delivery drivers who have to balance gas and toll costs (positively weighted) with transport package income (negatively weighted), you have to consider both positive and negative, which is limited to reflecting this situation.
- To overcome that limitation, they developed a fracturing procedure for directional graphs similar to tight-connected. This procedure cuts any directional graph into a series of dense clusters by deleting only a few edges using any process. The clusters are then connected by a sparse network with all edges pointing in the same direction. Finally, a directed acyclic graph (DAG) is created. This DAG is optimized, deleted, and the negative weighted in shortest path is solved.
https://www.linkedin.com/in/ii-tae-jeong/ is my bio LINKEDIN , if you want to connect with me, give me the message! i always open status :)
메타데이터
- post_id
- c01d7ba975ba
- slug
- you-must-eat-this-graph-news-graph-omakase-4-weeks-march-c01d7ba975ba
- url
- https://medium.com/@jeongiitae/you-must-eat-this-graph-news-graph-omakase-4-weeks-march-c01d7ba975ba
- canonical_url
- https://medium.com/@jeongiitae/you-must-eat-this-graph-news-graph-omakase-4-weeks-march-c01d7ba975ba
- author_url
- https://medium.com/@jeongiitae
- status
- ok
- fetched_at
- 2026-06-29 01:02:39




