Price Action or Indicators? How Traders Can Choose the Right Chart Method
Open almost any trading platform and you will find two broad approaches to chart analysis. Some traders rely on clean charts, candlestick…
Price Action or Indicators? How Traders Can Choose the Right Chart Method
Technical Analysis
Open almost any trading platform and you will find two broad approaches to chart analysis. Some traders rely on clean charts, candlestick patterns, trends, and support and resistance. Others use moving averages, RSI, MACD, Bollinger Bands, and other indicators.
This creates an important question: Which approach works better?
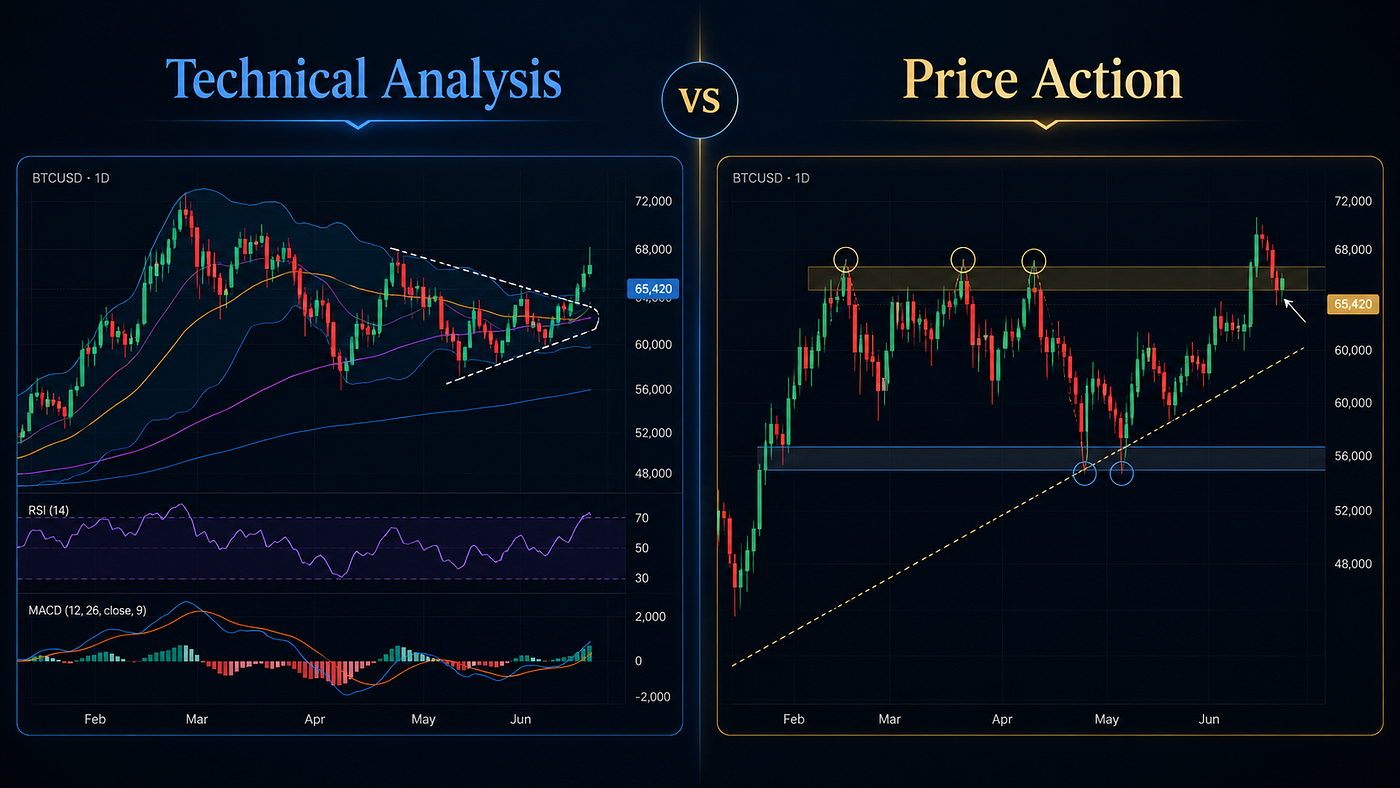
The debate over price action vs technical indicators often makes the two methods appear completely separate. In reality, price action forms part of technical analysis. Technical indicators simply process historical price or volume data and display it in another format.
Neither approach guarantees profitable trades. Price action can become subjective, while indicators can create delayed or conflicting signals. Traders often achieve better results when they understand the strengths of both methods and use them for different purposes.
This guide compares price action and indicator-based technical analysis. It explains how each method works, where it performs well, why signals fail, and how traders can combine both approaches with volume and disciplined risk management.
What Is Technical Analysis?
Technical analysis studies historical market activity to evaluate possible future price behavior. Traders mainly examine price, volume, volatility, momentum, trends, and recurring chart structures.
Technical analysis includes several tools and methods:
- Candlestick charts
- Support and resistance
- Trendlines and channels
- Chart patterns
- Moving averages
- RSI and MACD
- Bollinger Bands
- Fibonacci retracement
- Volume indicators
Therefore, price action is not necessarily the opposite of technical analysis. It is a direct form of technical analysis that places greater emphasis on raw price behavior.
Indicator-based analysis takes the same market data and converts it into mathematical signals. A moving average smooths price. RSI measures momentum. Bollinger Bands measure volatility around an average.
Fidelity’s educational introduction to technical analysis explains that the method focuses on market action, especially price and volume, to study trends and possible trading opportunities.
What Is Price Action Trading?
Price action trading studies how price behaves without depending heavily on mathematical indicators.
A price action trader may focus on:
- Higher highs and higher lows
- Lower highs and lower lows
- Support and resistance zones
- Breakouts and retests
- Candlestick rejection
- Consolidation and expansion
- Trend strength
- Market structure
The trader tries to understand the relationship between buyers and sellers directly from the chart.
For example, repeated rejection from a support zone may show that buyers are defending the area. A decisive close below that zone may show that sellers have gained control.
Price action traders often use clean charts because they want to see the market structure without several overlapping indicators.
The guide to mastering price action patterns explains how pin bars, inside bars, engulfing candles, and other formations can provide context near important price levels.
What Are Technical Indicators?
Technical indicators apply mathematical formulas to historical price, volume, or volatility data.
Each indicator answers a different question.
A moving average helps traders assess trend direction. RSI measures the speed and strength of recent price changes. MACD studies momentum and trend changes. Bollinger Bands show volatility expansion and contraction.
Indicators can make certain market conditions easier to recognize. Instead of manually comparing several price swings, a trader may use an indicator to summarize momentum or volatility.
However, indicators do not create new market information. They rearrange data that already exists in the chart.
This point is central to understanding price action vs technical indicators. Price action reads the original information, while indicators present a calculated interpretation of that information.
The Main Difference Between Price Action and Indicators
The biggest difference involves how traders process market data.
Price action traders read price directly. They study where price moved, how quickly it moved, and how it reacted near important levels.
Indicator traders use formulas to simplify or interpret the same movement. They may wait for an RSI crossover, moving-average signal, or MACD confirmation.
Price action often reacts faster because it does not wait for a calculation. Indicators may respond later because they depend on completed historical data.
However, price action requires more judgment. Two traders can look at the same chart and draw different support zones.
Indicators create more consistent rules. Two traders using the same RSI settings should see the same reading. Yet they may still interpret that reading differently.
Neither method removes subjectivity completely.
Price Action Offers Faster Information
Price changes before most indicators change.
Suppose a stock reaches support and forms a strong bullish rejection candle. A price action trader may recognize the reaction immediately after the candle closes.
A moving average crossover may not appear until several sessions later. By then, price may already have moved far from support.
This faster response is one advantage of price action.
It can help traders enter closer to the technical invalidation point. A closer entry may allow a shorter stop-loss and better risk-reward ratio.
However, faster does not always mean better. An early price action signal can fail before an indicator confirms a trend change.
The trade-off in price action vs technical indicators often comes down to speed versus confirmation.
Indicators Can Make Trends Easier to See
Price action becomes difficult to read when the chart contains noise.
A moving average can smooth small fluctuations and reveal the broader direction. A rising 50-day moving average may confirm that average prices continue improving.
A trader can also use two averages to identify changes in momentum. When a faster average crosses above a slower average, the signal may support a bullish view.
Indicators can help new traders develop objective rules. For example, a trading plan may accept long positions only when price remains above a rising 200-day moving average.
This rule does not guarantee success, but it reduces emotional interpretation.
The disadvantage is delay. Moving averages respond after price has changed. During a sideways market, they may also produce repeated false crossovers.
Price Action Shows Market Structure
Market structure describes the sequence of price swings.
An uptrend normally creates higher highs and higher lows. A downtrend forms lower highs and lower lows. A sideways range moves between support and resistance without establishing a clear direction.
Price action makes this structure visible.
Suppose a stock creates a higher high, pulls back, and then holds above its previous low. Buyers still control the larger structure.
If the stock breaks the previous swing low, the uptrend may be weakening.
Indicators can confirm this behavior, but the price structure usually changes first.
Traders who understand structure can evaluate where a signal occurs. A bullish RSI crossover near support within an uptrend carries different meaning from the same crossover directly below major resistance.
Indicators Measure Specific Market Conditions
Indicators become useful when traders need to measure something that is difficult to judge visually.
RSI helps quantify momentum. Bollinger Bands show whether volatility is expanding or contracting. Average True Range helps estimate typical price movement. Volume-based tools measure participation.
A trader may see that price is rising, but RSI can show whether momentum is strengthening or weakening.
Likewise, Bollinger Bands can reveal that a consolidation has reached unusually low volatility. This may help traders prepare for expansion.
The important rule is to assign each indicator a clear purpose.
Using five momentum indicators does not necessarily improve the analysis. They may all measure similar information and create the illusion of confirmation.
Price Action Can Become Subjective
One criticism of price action trading is its dependence on personal interpretation.
One trader may identify a bullish flag. Another may see a weak consolidation. One may draw support at the candle bodies, while another may use the lowest wicks.
This flexibility can lead to inconsistent decisions.
Traders can reduce subjectivity by creating specific rules.
For example, a support zone may require at least two previous reactions. A breakout may require a full candle close beyond the level. An entry may require a retest and a bullish confirmation candle.
A structured journal can also improve consistency. Traders should record why they marked each level and whether the market later respected it.
Price action works best when traders turn visual observations into repeatable rules.
Indicators Can Produce Lagging Signals
Most technical indicators use historical price data. Therefore, they react after price has already moved.
A moving average crossover may confirm a new uptrend after price has risen significantly. MACD may remain bearish during the early stage of a recovery.
This lag can cause late entries and late exits.
The delay does not make indicators useless. Trend-following systems intentionally sacrifice early entry to gain confirmation.
The problem begins when traders expect a lagging indicator to predict an exact top or bottom.
When comparing price action vs technical indicators, traders should understand that indicators confirm existing behavior more often than they forecast future behavior.
Support and Resistance Connect Both Methods
Support and resistance can form the foundation for both price action and indicator-based strategies.
Support is an area where buying interest may slow a decline. Resistance is an area where selling pressure may limit an advance.
A price action trader may look for a bullish rejection at support. An indicator trader may wait for RSI to recover from an oversold zone at the same level.
The strongest setup may include both signals.
For example, price may reach weekly support, form a bullish engulfing candle, and show bullish RSI divergence. Volume may also increase during the recovery.
Support defines the location. Price action provides the trigger. The indicator confirms momentum.
The Support and Resistance Calculator can help traders estimate pivot-based levels. Traders should compare those calculated values with visible historical zones.
Candlestick Patterns Need Context
Candlestick patterns form an important part of price action analysis.
A hammer shows that sellers pushed price lower before buyers forced a recovery. A bearish engulfing candle shows that selling pressure overcame the previous bullish candle.
However, a pattern’s location matters more than its name.
A hammer in the middle of an unclear trading range may provide little information. A hammer at weekly support after a controlled pullback carries greater significance.
Indicators can add context, but they should not rescue a weak location.
For example, an oversold RSI reading does not automatically make a random hammer valuable. The trader still needs trend, structure, and a logical invalidation point.
Breakouts Require More Than a Line Crossing
Price action traders often study breakouts from support, resistance, ranges, and chart patterns.
A breakout becomes more credible when price closes beyond the level, volume expands, and the market shows follow-through.
Indicator traders may use a moving average, MACD, RSI, or Bollinger Band signal to confirm the move.
For example, price may break above resistance while RSI moves above 50 and volume rises. These signals support the bullish case.
However, traders should check whether the breakout has enough room before the next resistance zone.
The guide to mastering the breakout strategy explains how traders can combine key price levels with confirmation and risk planning.
Volume Can Validate Both Approaches
Volume shows the level of participation behind price movement.
A bullish price pattern becomes more meaningful when buying volume expands. A breakout with low volume may lack enough demand to continue.
Volume can also improve indicator signals.
A moving average crossover supported by stronger volume carries more information than a crossover formed during quiet, sideways trading.
During a healthy pullback, volume may decline as price moves against the larger trend. Participation may then increase when the trend resumes.
Volume does not guarantee success. However, it helps traders evaluate whether the market supports the signal.
A practical principle remains useful:
Financial astrology prepares, technical analysis confirms, volume validates, and risk management protects.
Which Method Works Better for Beginners?
Indicators may feel easier because they provide visible rules and numerical readings.
A beginner can understand that RSI above 50 reflects stronger momentum or that price above a rising moving average supports a bullish trend.
However, relying only on indicators can prevent the trader from learning market structure.
Price action develops a deeper understanding of how charts move. It teaches traders to identify trends, levels, breakouts, pullbacks, and invalidation points.
A beginner should learn basic price structure first. After that, one or two indicators can help confirm the analysis.
Starting with a clean chart and adding tools gradually often works better than placing several indicators on the screen immediately.
Which Method Suits Intraday Trading?
Intraday traders need to make decisions quickly. Price action can provide faster information because it reacts directly to market movement.
Traders may study opening ranges, previous highs and lows, support, resistance, and intraday candle behavior.
Indicators can still help. A moving average may show the intraday trend, while volume can confirm a breakout.
Fast indicators can produce many false signals because short-term charts contain more noise.
Intraday traders should avoid entering only because an oscillator becomes overbought or oversold. Strong momentum can continue for longer than expected.
A combination of price levels, candle confirmation, volume, and one trend filter often provides a cleaner process.
Which Method Suits Swing Trading?
Swing traders hold positions for several days or weeks. They have more time to wait for confirmation.
Price action helps them identify daily or weekly support, resistance, chart patterns, and trend structure.
Indicators can measure momentum and help filter weak setups. RSI may identify a pullback within an uptrend. A moving average may confirm the broader direction.
Swing traders can begin with the weekly chart, refine the setup on the daily chart, and use a lower timeframe for entry.
This approach combines the strengths of price action vs technical indicators without depending entirely on either method.
How to Combine Price Action and Indicators
A simple combined process starts with price.
First, identify the higher-timeframe trend. Next, mark major support and resistance zones. Then wait for price to approach one of those areas.
Study how the market reacts. Look for rejection, a breakout, a retest, or a change in swing structure.
After that, use one indicator for confirmation.
A moving average can confirm direction. RSI can measure momentum. Bollinger Bands can show volatility. Volume can validate participation.
Do not let the indicator override the chart.
When price breaks support decisively, an oversold RSI reading does not prove that buyers will return. When price closes above resistance with strong volume, an overbought reading does not necessarily invalidate the breakout.
Price leads. Indicators provide context.
A Practical Combined Bullish Setup
Assume a stock remains in a daily uptrend and forms higher highs and higher lows.
Price pulls back toward earlier resistance that may now act as support. The 50-day moving average also reaches the same area.
RSI declines toward 40 but does not break deeply below 30. This suggests a momentum reset rather than complete trend failure.
A bullish engulfing candle forms at support, and volume increases.
The trader enters above the confirmation candle. The stop-loss sits below the support zone and recent swing low. The previous high becomes the first target.
This setup uses price action for location and entry while indicators confirm trend and momentum.
A Practical Combined Bearish Setup
Suppose an index remains in a downtrend and continues producing lower highs.
Price recovers toward broken support, which may now act as resistance. It also approaches a falling moving average.
RSI rises toward 60 but fails to enter a strong bullish range. A bearish rejection candle forms, and selling volume expands.
The trader may enter below the rejection candle. The stop-loss sits above resistance, while the previous low becomes the first target.
This process combines market structure, indicator confirmation, volume, and risk control.
Risk Management Matters More Than the Method
No debate about price action vs technical indicators matters if the trader ignores risk.
Both approaches can produce false signals. A clear support zone can break. A perfect indicator crossover can fail.
Traders should define the stop-loss before entry. The stop belongs where the market invalidates the setup.
Position size should depend on the distance between the entry and stop.
Suppose a trader has $30,000 and plans to risk 1% on one position. The maximum planned loss equals $300.
If the entry is $50 and the stop is $47, the risk equals $3 per share. The maximum position size is 100 shares.
The Financial Astrology Terminal calculator hub includes position-size, stop-loss, risk-reward, Fibonacci, and drawdown tools.
Add Market Timing Without Replacing the Chart
Technical analysis studies price, volume, momentum, and volatility. Financial astrology studies whether historical planetary cycles coincide with sensitive periods in market behavior.
The Financial Astrology Terminal brings together charts, drawing tools, watchlists, global stocks, indices, commodities, calculators, and timing insights.
A trader may identify strong price action at support and then study whether the setup overlaps with an important cycle window.
However, timing should not replace price confirmation.
Financial astrology works best as an additional probability-based timing layer. Price structure identifies the setup, indicators provide confirmation, volume validates the move, and risk management protects capital.
The comparison of market timing with astrology and chart-based trading signals explains how traders can use both without treating either as a guaranteed forecast.
Common Mistakes When Comparing the Two Methods
One mistake is assuming that price action uses no technical analysis. Price action is itself a form of technical analysis.
Another mistake is adding too many indicators. Several tools may measure the same information and produce unnecessary confusion.
Some traders ignore price because an indicator shows a signal. Others reject all indicators even when a simple trend or momentum filter could improve consistency.
Beginners may also change methods after every losing trade. No approach wins all the time.
The best method is not the one that looks impressive on one chart. It is the one that the trader can define, test, follow, and manage consistently.
A Practical Pre-Trade Checklist
Before entering, identify the higher-timeframe trend and current market condition.
Mark support, resistance, swing highs, swing lows, and possible breakout zones.
Wait for price to produce a clear reaction. Avoid entering in the middle of an unstructured range.
Use one or two indicators only when they add useful information.
Check volume and determine whether participation supports the trade.
Define the entry, stop-loss, target, position size, and maximum loss before placing the order.
Review upcoming earnings, economic reports, and central bank decisions that may increase volatility.
Take the trade only when the complete setup offers logical risk and realistic reward.
Conclusion: Price Leads, Indicators Confirm, and Risk Management Protects
The comparison of price action vs technical indicators does not need a single winner.
Price action shows market structure directly. It helps traders identify trends, support, resistance, breakouts, and changes in buyer or seller control.
Indicators summarize specific market conditions. They can make momentum, trend, and volatility easier to measure.
Price action offers speed and context, but it can become subjective. Indicators provide consistent calculations, but they can lag and create false signals.
A practical trader can combine both methods.
Begin with price structure. Mark important levels and wait for the market to react. Then use a limited number of indicators to confirm momentum, trend, or volatility. Check volume and define the invalidation point before entering.
메타데이터
- post_id
- c09968b2e260
- slug
- price-action-or-indicators-how-traders-can-choose-the-right-chart-method-c09968b2e260
- url
- https://medium.com/@astrodunia123_31411/price-action-or-indicators-how-traders-can-choose-the-right-chart-method-c09968b2e260
- canonical_url
- https://medium.com/@astrodunia123_31411/price-action-or-indicators-how-traders-can-choose-the-right-chart-method-c09968b2e260
- author_url
- https://medium.com/@astrodunia123_31411
- status
- ok
- fetched_at
- 2026-07-08 23:38:59