The best simple statistics for building college baseball lineups
JOPS and TBIP for Divisions 1, 2, and 3
The best simple statistics for building college baseball lineups
JOPS and TBIP for Divisions 1, 2, and 3
Recently I’ve received some requests from Division 2 college coaches about whether our ‘best simple stats’ would be useful outside of Division 1. First, the answer is, Yes! Second, I love getting emails with questions like this one, so please fire away!
I won’t review too much here, but let me briefly restate the philosophy. The more tunable parameters you add to a metric (think wOBA or FIP), the better the fit will be — in other words, if you plot weighted on base average (wOBA) and on base plus slugging (OPS) each against runs scored (R), wOBA will have a stronger correlation with R than OPS simply because there are more knobs to turn. However, maximizing goodness of fit often means sacrificing fitness and interpretability. Fitness refers to a metric’s ability to predict unseen data, and if you’ve turned the knobs just right for one set of data, they can actually make things worse for another set of data. Interpretability describes one’s ability to make actionable changes, based on the metric, and if you’ve made the metric too complicated or hard to translate into on-field drills and strategy, what use is it to a player or coach?
Table 1. SIMPLE STAT DEFINITIONS

JOPS = a*OBP + SLG,
  where a is determined for each division and year, and is typically around 3.
  To compute JOPS, just multiply a player's OBP by 'a' and add SLG! See
  Figure 1 for values of 'a'.

TBIP = (BB + HBP + 1B + 2*2B + 3*3B + 4*HR) / IP
  TBIP has no significant increase in fitness even if we optimize the
  coefficients of each variable to maximize the fit.
With this philosophy in mind, we developed JOPS (pronounced Joe-PS) for hitters and TBIP (Total Bases per Inning Pitched, like a cross between WHIP and SLG) for pitchers (Table 1). If you are interested, you can read more about our approach here and here. The goal of this note is to determine how well JOPS and TBIP work in College Baseball Divisions 1, 2, and 3.
Figure 1 depicts the relationship between actual runs per game (R/GP) for each team, versus predicted R/GP using the JOPS formula. You’ll notice that JOPS is 5% and 3% worse at predicting R/GP in D2 and D3, respectively, compared to D1. Basically, there is a bit more scatter in the D2 and D3 data, perhaps related to data quality, or perhaps related to differences in base running or error-scoring environments. You’ll also notice that OBP was even more important for scoring runs in D3 (a=3.04) than in D1 (a=2.60) and D2 (a=2.66) in 2025.
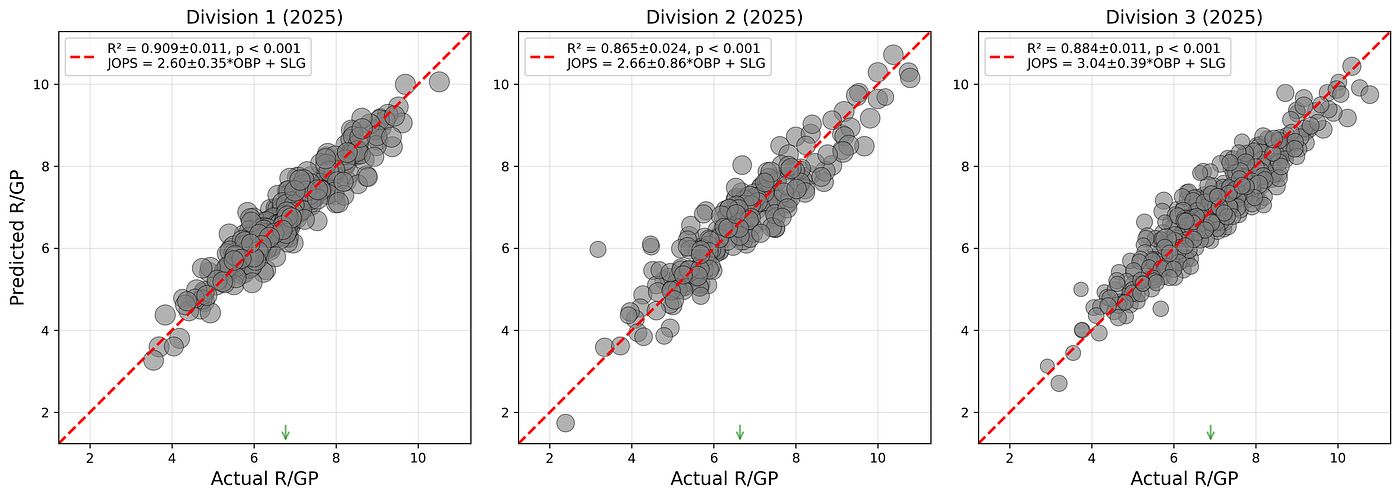
Figure 1. JOPS. To calculate the JOPS coefficient, I randomly sample 80% of the team OBP, SLG, and R/GP data and determine the coefficient that results in the best fit. I perform this bootstrap resampling 100 times, and report the mean ± 1 standard deviation of both the JOPS coefficient (a), and the measure of model performance (R²). Think of R² as the fraction of the variance in the data that the JOPS model explains (e.g., in D1, JOPS explains 90.9% of the scatter in R/GP). Notice that D2 has the fewest teams, and the bootstrap resampling reveals an uneven distribution of run scoring environments, leading to larger uncertainty (±0.86) in the JOPS coefficient.
Figure 2 depicts the relationship between actual runs per inning pitched (R/IP) for each team, versus predicted R/IP using the TBIP formula. Unlike JOPS, TBIP actually has zero tunable parameters to worry about, and does an otherworldly job predicting R/IP in D1. However, in contrast to JOPS, you’ll notice a steep 15% (D2) to 39% (D3) decline in the ability of TBIP to predict R/IP in other divisions. Even optimizing a coefficient to every variable in TBIP, at the expense of fitness and interpretability, only improves the fit for TBIP in D2 and D3 by 1–5%.

Figure 2. TBIP.
I am not sure exactly why TBIP (and WHIP and FIP, for that matter) is so much less effective in D2 and D3. Perhaps the differences in base running and error scoring are amplified when considering runs scored per inning instead of per game? Unfortunately I do not yet have access to all the necessary D2 and D3 data from years before 2025, so I’ll put this surprise result on my list for future study. What about JOPS-Against (JOPSa)? In D1, we found that TBIP had slightly better fit, and significantly better fitness and interpretability than JOPSa. However, Figure 3 shows that for D2 and D3, JOPSa results in improved performance and stability compared to TBIP. Furthermore, the larger coefficients for JOPSa (Figure 3) compared to JOPS (Figure 1) demonstrate that getting on base has even higher higher relative importance for preventing R/IP as a pitcher than it does for scoring R/GP as a hitter.

Figure 3. JOPS Against. To calculate the JOPS Against (JOPSa) coefficient, I randomly sample 80% of the team OBP, SLG, and R/IP data and determine the coefficient that results in the best fit. I perform this bootstrap resampling 100 times, and report the mean ± 1 standard deviation of both the JOPSa coefficient, and the measure of model performance (R²). Think of R² as the fraction of the variance in the data that the JOPSa model explains (e.g., in D2, JOPSa explains 92.0% of the scatter in R/IP). Notice that, across all divisions (especially D2), the JOPSa coefficient is higher than the JOPS coefficient (Figure 1), signifying the even greater relative importance of keeping runners of the bases on a per inning basis for pitchers.
So, if you are a coach looking for one simple statistic to build a philosophy and game plan around, I would choose JOPS. In D1, you will see advantages in fitness and interpretability with TBIP for pitchers, but JOPS and JOPSa are consistently powerful across all divisions, easy to calculate, and easy to coach. Also, I’ve been asked how I would use these simple stats to build a lineup. Well, everyone has their own lineup philosophies, and I’m not quite ready to wade into the quicksand. But I would start by sorting batters, or lining up pitchers, in order of JOPS. Then, move guys up or down one slot based on lefty/righty splits, base running management, etc.
Keep the fun questions coming!
메타데이터
- post_id
- c0ef46a22c04
- slug
- the-best-simple-statistics-for-building-college-baseball-lineups-c0ef46a22c04
- url
- https://medium.com/sabr-tooth-tigers/the-best-simple-statistics-for-building-college-baseball-lineups-c0ef46a22c04
- canonical_url
- https://medium.com/sabr-tooth-tigers/the-best-simple-statistics-for-building-college-baseball-lineups-c0ef46a22c04
- author_url
- https://medium.com/@maloofa
- status
- ok
- fetched_at
- 2026-06-14 11:28:49