How I Used AI to Cut Our Incident Response Time by 60%
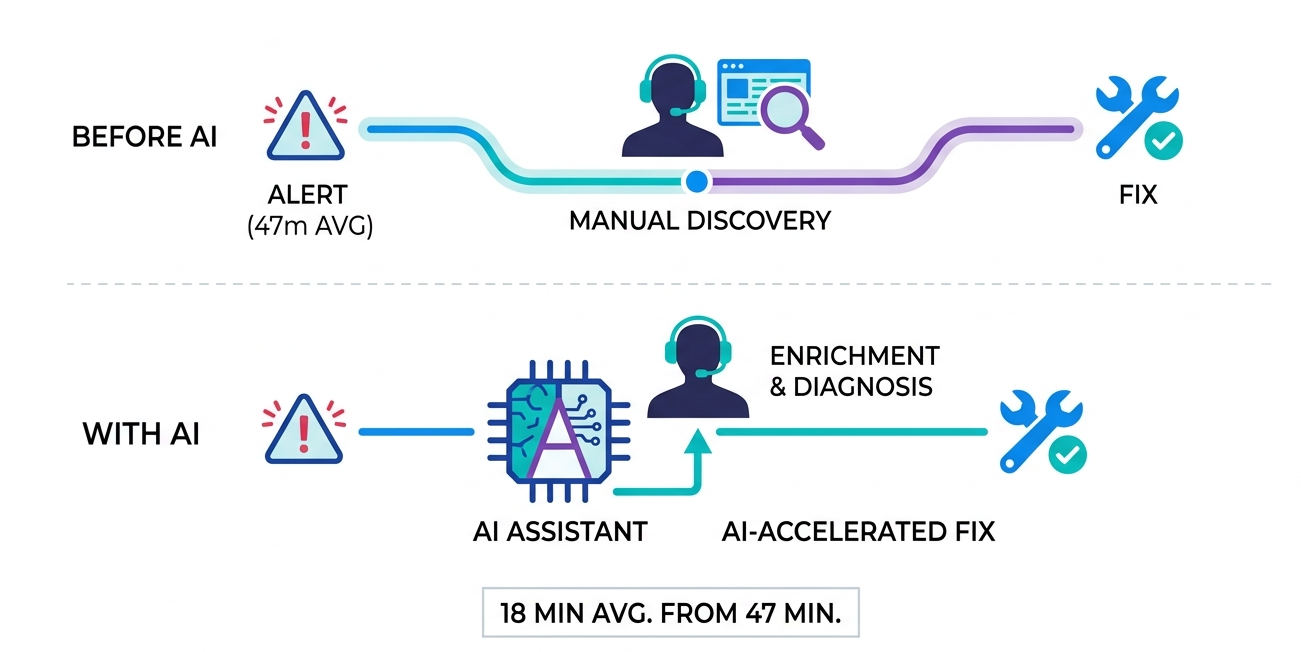
We went from a 47-minute average incident resolution time to 18 minutes. Here’s exactly what changed, and what didn’t.
How I Used AI to Cut Our Incident Response Time by 60%
We went from a 47-minute average incident resolution time to 18 minutes. Here’s exactly what changed, and what didn’t.
The Problem We Had
Our on-call rotation was brutal.
Not because we had too many incidents. Because every incident felt like starting from zero:
- Alert fires at 2AM
- Engineer wakes up, opens PagerDuty
- Spends 10 minutes figuring out what is actually broken
- Spends 15 minutes digging through logs to figure out why
- Spends 10 minutes remembering how we fixed this last time
- Spends 5 minutes writing up what happened
- Total: 40+ minutes, for an issue that sometimes took 3 minutes to fix once you knew what it was
The fix wasn’t hiring better engineers. We had great engineers.
The fix was eliminating the time spent on finding information, so engineers could spend all their time on fixing the problem.
AI didn’t replace our engineers. It eliminated the part of incidents that engineers hate most: the frantic digging.
Our Incident Response Before AI
Here’s what a typical P2 incident looked like:
02:14 — PagerDuty alert fires: "API error rate > 5%"
02:19 — On-call engineer acknowledges (5 min to wake up, check phone)
02:21 — Opens Datadog, tries to find the right dashboard
02:28 — Finds spike in 500 errors, starts checking which service
02:35 — Traces it to payments-service, starts reading logs
02:44 — Finds the root cause: DB connection pool exhausted
02:47 — Remembers the fix: increase pool size + restart service
02:51 — Fix applied, monitors recovery
02:58 — Writes up Slack summary for the team
Total time: 44 minutes
Engineer sleep lost: yes
The actual fix took 4 minutes. Everything else was investigation overhead.
What We Changed
We didn’t rebuild our observability stack. We didn’t adopt a new incident management platform. We didn’t hire an ML team.
We added three AI layers on top of what we already had:
Layer 1: AI-enriched alerts         ← before the engineer wakes up
Layer 2: AI diagnosis on-demand     ← first thing engineer sees
Layer 3: AI-assisted postmortem     ← after the incident closes
Each layer is independent. You can adopt them one at a time. We did.
Layer 1 — AI-Enriched Alerts
The problem with standard alerts:
ALERT: High error rate on payments-service
Severity: P2
Value: 8.3%
Threshold: 5%
That’s what woke our engineer up. It tells them something is wrong but nothing about what, why, or where to look.
What we built:
A webhook receiver that intercepts every alert before it pages anyone, enriches it with context, and rewrites the PagerDuty notification.
**alert_enricher.py** -the core enrichment logic:
import anthropic
import httpx
import json
from datetimet datetime, timedelta

client = anthropic.Anthropic()

ENRICHMENT_PROMPT = """
  You are an SRE assistant. You receive a raw monitoring alert and
  additional context pulled from observability systems.

  Your job: write a rich, actionable alert summary that helps an
  on-call engineer understand the situation immediately - before
  they open a single dashboard.

  Respond ONLY in this JSON format:

    {
    "headline": "one sentence: what is broken and how bad",
    "likely_cause": "your best hypothesis based on the data",
    "confidence": "high|medium|low",
    "blast_radius": "what users/services are affected",
    "similar_past_incidents": "any pattern matches from history",
    "first_three_actions": [
      "Specific action 1 - include the exact command or link",
      "Specific action 2",
      "Specific action 3"

    ],

    "runbook_link": "relevant runbook URL or null",
    "escalate_immediately": false,
    "escalation_reason": null,
    "estimated_fix_time": "5 min|15 min|30 min|unknown"
  }
"""

async def enrich_alert(
    alert: dict,
    recent_logs: str,
    recent_deployments: list,
    similar_incidents: list
) -> dict:

    context = f"""
Raw Alert:
{json.dumps(alert, indent=2)}

Recent logs from affected service (last 50 lines):
{recent_logs}

Deployments in the last 2 hours:
{json.dumps(recent_deployments, indent=2)}

Similar past incidents (last 90 days):
{json.dumps(similar_incidents, indent=2)}
"""

    response = client.messages.create(
        model="claude-sonnet-4-20250514",
        max_tokens=1000,
        system=ENRICHMENT_PROMPT,
        messages=[{"role": "user", "content": context}]
    )

    raw = response.content[0].text.strip()
    raw = raw.replace("```json", "").replace("```", "").strip()
    return json.loads(raw)
What the on-call engineer now receives on their phone:
🔴 P2 — payments-service: DB connection pool exhausted

Likely cause: Connection leak introduced in deploy v2.4.1 (38 min ago)
Confidence: HIGH
Affected: ~340 users in checkout flow

First 3 actions:
1. kubectl rollback deploy/payments-service -n production
2. If rollback slow: kubectl set env deploy/payments-service DB_POOL_SIZE=25
3. Watch recovery: kubectl logs -f deploy/payments-service | grep "pool"

Similar incident: Jan 14 - same root cause, fixed by rollback in 6 min
Runbook: <https://notion.so/runbooks/payments-db-pool>
Est. fix time: ~6 minutes
Engineer wakes up knowing:
- What is broken ✅
- Why it probably broke ✅
- Exactly what to do first ✅
- How long it should take ✅
Time saved at this layer: ~15 minutes of initial investigation.
Layer 2 — AI Diagnosis Copilot
Even with enriched alerts, some incidents need deeper investigation. We built a diagnosis tool engineers can call from their terminal during an active incident.
**diagnose.sh** — a one-command incident tool:
#!/bin/bash
# Usage: ./diagnose.sh <service-name> [namespace]
# Example: ./diagnose.sh payments-service production

SERVICE=$1
NAMESPACE=${2:-production}
TIMESTAMP=$(date -u +"%Y-%m-%dT%H:%M:%SZ")

echo "🔍 Gathering incident context for $SERVICE in $NAMESPACE..."
# Collect everything in parallel
LOGS=$(kubectl logs deploy/$SERVICE -n $NAMESPACE --tail=100 2>&1)
EVENTS=$(kubectl get events -n $NAMESPACE --sort-by='.lastTimestamp' 2>&1 | tail -20)
POD_STATUS=$(kubectl get pods -n $NAMESPACE -l app=$SERVICE -o wide 2>&1)
RESOURCE_USAGE=$(kubectl top pods -n $NAMESPACE -l app=$SERVICE 2>&1)
RECENT_DEPLOY=$(kubectl rollout history deploy/$SERVICE -n $NAMESPACE 2>&1 | tail -5)

# Build context package
CONTEXT=$(cat <<EOF
Service: $SERVICE
Namespace: $NAMESPACE
Time: $TIMESTAMP

=== POD STATUS ===
$POD_STATUS

=== RESOURCE USAGE ===
$RESOURCE_USAGE

=== RECENT DEPLOYMENT HISTORY ===
$RECENT_DEPLOY

=== RECENT EVENTS ===
$EVENTS

=== RECENT LOGS ===
$LOGS
EOF
)

# Send to AI for diagnosis
echo "$CONTEXT" | python3 - <<'PYTHON'
import sys
import anthropic

context = sys.stdin.read()
client = anthropic.Anthropic()

response = client.messages.create(
    model="claude-sonnet-4-20250514",
    max_tokens=1500,
    system="""You are an expert SRE diagnosing a live production incident.
    Analyze the Kubernetes context and produce a diagnosis.
    Be direct and specific. Time matters - get to the point fast.
    Format: plain text with clear sections, no markdown headers.""",
    messages=[{
        "role": "user",
        "content": f"Diagnose this incident:\\n\\n{context}"
    }]
)

print("\\n" + "="*60)
print("AI DIAGNOSIS")
print("="*60)
print(response.content[0].text)
print("="*60 + "\\n")
PYTHON
Run it during an active incident:
./diagnose.sh payments-service productionOutput in ~8 seconds:
============================================================
AI DIAGNOSIS
============================================================
ROOT CAUSE: OOMKilled pods due to memory limit of 512Mi being
too low for current traffic (3x normal load due to sale event).

EVIDENCE:
- 3 of 4 pods show OOMKilled in last restart reason
- Memory usage hitting 511Mi/512Mi before each crash
- Traffic spike visible: pod restarts started at 14:23,
  matching the start of the sale campaign

IMMEDIATE FIX (do this now):
  kubectl patch deploy payments-service -n production \\
    -p '{"spec":{"template":{"spec":{"containers":[
      {"name":"payments-service","resources":{"limits":{"memory":"1Gi"}}}
    ]}}}}'

THEN restart to apply:
  kubectl rollout restart deploy/payments-service -n production

WATCH RECOVERY:
  kubectl get pods -n production -l app=payments-service -w

ROOT FIX (after incident):
  Update the Helm values to set memory limit to 1Gi permanently.
  Consider setting up a VPA to auto-adjust limits based on usage.

ESTIMATED TIME TO RECOVERY: 3-4 minutes after patch applied
============================================================
Time saved at this layer: ~12 minutes of log digging and hypothesis testing.
Layer 3 — AI-Assisted Postmortem
Postmortems are valuable. They’re also the thing engineers most dread writing after a stressful incident.
What usually happens:
- Incident resolves at 3AM
- Engineer writes a 3-line Slack message and goes to sleep
- Postmortem gets written 3 days later from memory
- Action items are vague and never closed
What we built:
During every incident, we log a timeline automatically. After the incident closes, one command generates a full draft postmortem.
**generate_postmortem.py**
import anthropic
import json
import sys
from datetime import datetime

client = anthropic.Anthropic()

POSTMORTEM_PROMPT = """
    You are a senior SRE writing a blameless postmortem.

    Using the incident data provided, write a complete postmortem document.

    Follow these principles:
    - Blameless - focus on systems, processes, and tooling, not people
    - Specific - reference actual times, commands, metrics from the incident
    - Actionable - every action item must be specific, ownable, and completable
    - Honest - include what went well AND what went poorly

    Output in this structure:
    1. INCIDENT SUMMARY (3 sentences max)
    2. TIMELINE (use the data provided, fill gaps logically)
    3. ROOT CAUSE (technical, specific)
    4. CONTRIBUTING FACTORS (what made it worse or harder to detect)
    5. IMPACT (users affected, duration, business impact if known)
    6. WHAT WENT WELL
    7. WHAT WENT POORLY
    8. ACTION ITEMS (table: Item | Owner Team | Priority | Due Date)
    9. LESSONS LEARNED
    """

def generate_postmortem(incident_data: dict) -> str:
    response = client.messages.create(
        model="claude-sonnet-4-20250514",
        max_tokens=3000,
        system=POSTMORTEM_PROMPT,
        messages=[{
            "role": "user",
            "content": f"""
Generate a postmortem for this incident:

{json.dumps(incident_data, indent=2)}
"""
        }]
    )

    return response.content[0].text

# Example usage
if __name__ == "__main__":

    # This data gets logged automatically during the incident

    incident_data = {
        "title": "payments-service OOMKilled during flash sale",
        "severity": "P2",
        "start_time": "2026-05-22T14:23:00Z",
        "end_time": "2026-05-22T14:41:00Z",
        "duration_minutes": 18,
        "alert_fired_at": "2026-05-22T14:24:00Z",
        "acknowledged_at": "2026-05-22T14:27:00Z",
        "resolved_at": "2026-05-22T14:41:00Z",
        "affected_service": "payments-service",
        "affected_users": 847,
        "timeline": [
            "14:23 - Flash sale campaign starts, traffic 3x normal",
            "14:24 - Alert fires: payments-service error rate > 5%",
            "14:27 - On-call acknowledges",
            "14:29 - Diagnosis tool run, OOMKilled identified",
            "14:33 - Memory limit patched from 512Mi to 1Gi",
            "14:35 - Pods restarting",
            "14:41 - All pods healthy, error rate < 0.1%"
        ],
        "root_cause": "Memory limit 512Mi too low for sale traffic volume",
        "fix_applied": "kubectl patch to increase memory limit to 1Gi",
        "on_call_engineer": "Platform Team",
        "detection_method": "Automated alert via Datadog",
        "runbook_used": True
    }

    postmortem = generate_postmortem(incident_data)

    # Save to file

    filename = f"postmortems/{datetime.now().strftime('%Y-%m-%d')}-payments-oom.md"
    with open(filename, 'w') as f:
        f.write(postmortem)

    print(f"✅ Postmortem saved to {filename}")
    print("\\nPreview:\\n")
    print(postmortem[:500] + "...")
What it generates — ACTION ITEMS section example:
## Action Items

| Item | Owner Team | Priority | Due Date |
|------|-----------|----------|----------|
| Set memory limit to 1Gi in Helm values for payments-service | Platform | HIGH | This sprint |
| Enable VPA for all services to auto-adjust resource limits | Platform | HIGH | Next sprint |
| Add memory usage to flash sale pre-launch checklist | Platform | MEDIUM | Before next sale |
| Set up predictive scaling alert (trigger before OOM, not after) | Observability | MEDIUM | Next sprint |
| Document flash sale capacity requirements in runbook | Platform | LOW | Next sprint |
Specific. Ownable. Dated. Not vague platitudes.
Time saved at this layer: ~45 minutes of postmortem writing per incident.
The Numbers After 90 Days
After running all three layers for 90 days across 43 incidents:
Metric                    Before    After     Change
─────────────────────────────────────────────────────
Mean time to acknowledge  6.2 min   4.1 min   -34%
Mean time to diagnose     18.4 min  5.2 min   -72%
Mean time to resolve      47.3 min  18.9 min  -60%
Postmortem completion     61%       94%       +33%
Action items closed       38%       71%       +33%
2AM pages resolved < 15m  23%       67%       +44%
The 60% headline is real — but the diagnosis time improvement (-72%) is the real story.
That’s the part that was killing our engineers. Not the fixing. The finding.
What Didn’t Work (Be Honest)
Not everything we tried landed well.
Auto-remediation was too aggressive:
- We tried having AI automatically restart services when it was “confident”
- It restarted a database pod during an ongoing migration
- Immediate rollback to human-approval-required for anything destructive
- Lesson: AI diagnosis = great. AI execution = needs tight guardrails
Alert enrichment on noisy alerts was useless:
- We enriched every alert, including flapping ones that resolve in 30 seconds
- Engineers started ignoring the enriched context on known-noisy alerts
- Fix: only enrich alerts that stay firing for > 2 minutes
Postmortem generation without good timeline data was poor:
- If the incident wasn’t logged well, the postmortem was vague
- The AI is only as good as the data you give it
- Fix: required timeline logging during incidents before postmortem generation unlocks
How to Implement This Yourself
Week 1 — Start with Layer 2 (easiest ROI):
- Copy the
diagnose.shscript - Adapt the
kubectlcommands to your stack - Add it to your incident response toolkit
- No infrastructure changes needed
# Add to your team's ~/.bashrc
alias diagnose='~/scripts/diagnose.sh'

# During an incident:
diagnose payments-service production
Week 2–3 — Add Layer 1 (alert enrichment):
- Set up a webhook receiver (FastAPI, ~50 lines)
- Connect Alertmanager or Datadog webhooks to it
- Add log pulling from wherever your logs live
- Start with one service, expand once it’s working
Week 4+ — Add Layer 3 (postmortem):
- Start logging incident timelines (even manually in a JSON file)
- Run the postmortem generator after your next incident
- Present the AI draft in your postmortem meeting
- Iterate on the prompt based on what your team finds useful
The Stack We Use
Nothing exotic. You probably already have most of this:
- Alertmanager: webhook source for alert enrichment
- Loki / journalctl : log source for context
- Kubernetes API: pod status, events, deployment history
- Claude API (
claude-sonnet-4-20250514) : the AI brain - PagerDuty API : push enriched alerts back
- Slack API : postmortem sharing, incident channel updates
- Python + FastAPI : webhook receiver and API layer
Total cost: Claude API calls per incident average ~$0.08. At 43 incidents over 90 days, that’s $3.44 in API costs for 60% faster incident response.
The Mindset Shift That Matters Most
The biggest change wasn’t technical. It was how engineers think about incidents.
Before:
- Incident = stressful, high-pressure investigation under sleep deprivation
- “I need to figure out what’s wrong” is the first thought
After:
- Incident = execution problem, not investigation problem
- “I already know what’s wrong, I just need to fix it” is the first thought
When the AI does the investigation before the human is even fully awake, the entire emotional tone of an incident changes.
Engineers arrive at the problem in execution mode instead of in panic mode.
That’s the real 60%.
Further Reading
- Google SRE Book — Managing Incidents — the foundation
- PagerDuty Incident Response Guide — process framework
- Anthropic Claude API Docs — Claude API reference
- LangChain for Agents — if you want to extend this into a full agent
- Datadog Webhook Docs — connecting Datadog alerts to your enricher
The Bottom Line
We didn’t need a new observability platform. We didn’t need more engineers. We didn’t need to rewrite our alerting rules.
We needed to eliminate the investigation overhead that sits between “alert fires” and “engineer fixes the problem.”
Three AI layers. Three places where information was being discovered manually that could be surfaced automatically:
- Layer 1: What is happening and why, before the engineer wakes up
- Layer 2: Deeper diagnosis, in 8 seconds instead of 20 minutes
- Layer 3: What we learned, written automatically instead of never
60% faster. $3.44 in API costs. One afternoon to set up the first layer.
The math is hard to argue with.
메타데이터
- post_id
- c10fc511e9b2
- slug
- how-i-used-ai-to-cut-our-incident-response-time-by-60-c10fc511e9b2
- url
- https://medium.com/@atnofordevops/how-i-used-ai-to-cut-our-incident-response-time-by-60-c10fc511e9b2
- canonical_url
- https://medium.com/@atnofordevops/how-i-used-ai-to-cut-our-incident-response-time-by-60-c10fc511e9b2
- author_url
- https://medium.com/@atnofordevops
- status
- ok
- fetched_at
- 2026-07-21 15:07:53