OpenManus Major Capability Upgrade: Quickly Build Your Data Analysis Assistant
Author: VisActor Open Source Team
OpenManus Major Capability Upgrade: Quickly Build Your Data Analysis Assistant
Author: VisActor Open Source Team
OpenManus Introduction
OpenManus (https://github.com/FoundationAgents/OpenManus) is a concise and versatile Agent framework that supports various tool invocation capabilities such as Computer Use, Browser Use, and Planning Use through a pluggable design of Tools and Prompts.
In OpenManus, you can use the basic manus agent to try completing various tasks and interesting explorations. You can also use OpenManus as a platform to unleash your creativity by writing unique tools and prompts to create one-of-a-kind agents.
Raise your hand 🙋, so the question is, any examples?
Hello, yes! Here comes the example! 🌰
🌰: DataAnalysis Agent
Data Analysis Tasks
Our lives are filled with massive amounts of data from various industries such as economics, tourism, internet, retail, and more. If you ask DeepSeek how much data we generate in a day, DeepSeek will tell you: According to International Data Corporation (IDC) predictions, global annual data volume will reach 175ZB (Zettabytes) by 2025, equivalent to approximately 479EB (Exabytes) per day (1EB=10¹⁸ bytes).
Among such vast amounts of data, data analysis, data visualization, and final data consumption have always been hot topics, and how to use AI tools to assist in analysis, or even analyze for you, is a focal point. Manus’s impressive data analysis capabilities have left a deep impression on everyone. Looking at OpenManus, can it achieve what Manus can do?
The answer is: No, but also yes.
Perhaps using OpenManus directly cannot achieve Manus’s effects, because OpenManus is a very concise and versatile Agent framework, and its tool library doesn’t yet have powerful data analysis tools. But precisely because OpenManus is a simple and versatile Agent framework, as long as you dare to add to its tool library, OpenManus will dare to use it, ultimately achieving a 1 + 1 > 2 effect.
Therefore, we at VisActor (https://www.visactor.com/) collaborated with the OpenManus team to integrate the open-source intelligent visualization solution VMind to add a DataAnalysis Agent to OpenManus.
VMind Introduction
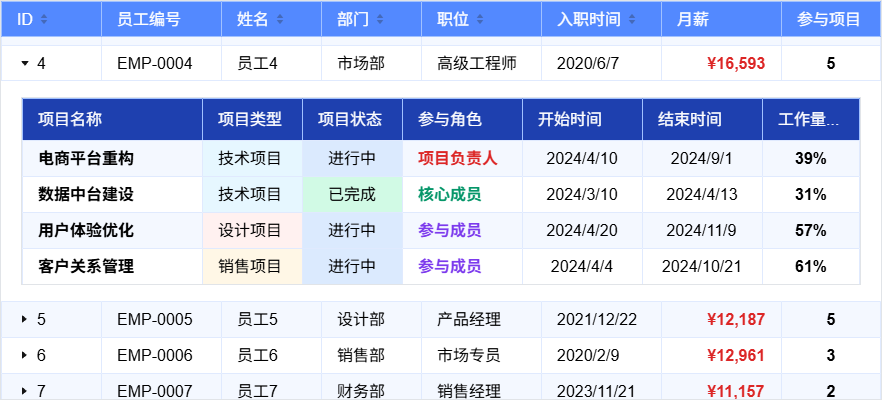
VMind, as an open-source intelligent visualization solution from Visactor, already possesses certain intelligent capabilities and can very conveniently complete tasks such as data visualization and data insights. For more details, see VMind (Official Website, github). VMind currently supports intelligent generation of VChart and VTable.
Adding VMind to OpenManus can well complement data visualization and data analysis capabilities. Additionally, advanced intelligent capabilities that require backend service support are still on the path to open source. If you feel that the current VMind SDK capabilities cannot meet your needs, you can contact them to accelerate the open-source progress with community demands.
Integration Method
Now that we have the right tools, we just need to put them into OpenManus’s tool library. Compared to the application approach of general-purpose Agents for data analysis scenarios, we made some minor modifications, as follows:
The general-purpose OpenManus uses general-purpose Python tools to implement various Python code generation tasks in data analysis scenarios, including but not limited to: data processing, data reporting, data visualization, etc.
Our modification is to extract the data visualization part into a separate tool, making this tool’s usage scenarios more focused and in-depth. This tool’s functions include: data visualization, data insights, and adding data insights to charts. For details, see ReadMe (https://github.com/FoundationAgents/OpenManus/blob/main/app/tool/chart_visualization/README_zh.md):
The original Python tool will focus more on data processing/data reporting tasks.
Python Tool Modification
Thanks to the existing manus architecture, adding a dedicated Python tool becomes very smooth and simple. Looking at the original Python tool, we can see that its structure is also very simple and clear, as follows:
- name/description/parameters directly correspond to the prompt parameters for function calls in large models.
- execute is the corresponding function executed when the current Python tool is called, and the execution will ultimately call the _run_code function to get results
class PythonExecute(BaseTool):
    """A tool for executing Python code with timeout and safety restrictions."""

    name: str = "python_execute"
    description: str = "Executes Python code string. Note: Only print outputs are visible, function return values are not captured. Use print statements to see results."
    parameters: dict = {
        "type": "object",
        "properties": {
            "code": {
                "type": "string",
                "description": "The Python code to execute.",
            },
        },
        "required": ["code"],
    }
def _run_code(self, code: str, result_dict: dict, safe_globals: dict) -> None

    async def execute(
        self,
        code: str,
        timeout: int = 5,
    ) -> Dict:
        """
        Executes the provided Python code with a timeout.
        Args:
            code (str): The Python code to execute.
            timeout (int): Execution timeout in seconds.
        Returns:
            Dict: Contains 'output' with execution output or error message and 'success' status.
        """
None async def execute( self, code: str, timeout: int = 5, ) -> Dict: “”” Executes the provided Python code with a timeout. Args: code (str): The Python code to execute. timeout (int): Execution timeout in seconds. Returns: Dict: Contains ‘output’ with execution output or error message and ‘success’ status. “”” “ tabindex=”0" role=”button” style=”box-sizing: border-box; position: relative; display: flex !important; padding: 0px !important; font-size: 14px; font-weight: 500; line-height: 20px; white-space: nowrap; vertical-align: middle; cursor: pointer; user-select: none; border: 0px; border-radius: 6px; appearance: none; color: rgb(9, 105, 218); background-color: transparent; box-shadow: none; transition: color 80ms cubic-bezier(0.33, 1, 0.68, 1), background-color, box-shadow, border-color; justify-content: center !important; align-items: center !important; margin: 8px !important; width: 28px; height: 28px;”>
What we do is very simple. We just need to inherit this function and modify the existing prompt to guide it into a tool suitable for data analysis! The result is as follows, mainly clarifying the following points in the prompt:
- In the prompt, clearly state that the main tasks are: data analysis, data reporting, and other normal code writing tasks
- Hope the large model can provide: dataset overview, dataset column details, basic statistical information, derived metrics, time series comparison, outliers, key insights, etc.
- Guide the large model to perform multiple analyses based on existing analyses to form in-depth and meaningful analysis data
from app.config import config
from app.tool.python_execute import PythonExecute
class NormalPythonExecute(PythonExecute):
    """A tool for executing Python code with timeout and safety restrictions."""
    name: str = "python_execute"
    description: str = """Execute Python code for in-depth data analysis / data report(task conclusion) / other normal task without direct visualization."""
    parameters: dict = {
        "type": "object",
        "properties": {
            "code_type": {
                "description": "code type, data process / data report / others",
                "type": "string",
                "default": "process",
                "enum": ["process", "report", "others"],
            },
            "code": {
                "type": "string",
                "description": """Python code to execute.
# Note
1. The code should generate a comprehensive text-based report containing dataset overview, column details, basic statistics, derived metrics, timeseries comparisons, outliers, and key insights.
2. Use print() for all outputs so the analysis (including sections like 'Dataset Overview' or 'Preprocessing Results') is clearly visible and save it also
3. Save any report / processed files / each analysis result in worksapce directory: {directory}
4. Data reports need to be content-rich, including your overall analysis process and corresponding data visualization.
5. You can invode this tool step-by-step to do data analysis from summary to in-depth with data report saved also""".format(
                    directory=config.workspace_root
                ),
            },
        },
        "required": ["code"],
    }
    async def execute(self, code: str, code_type: str | None = None, timeout=5):
        return await super().execute(code, timeout)
Through the above operations, we can get a tool proficient in Python code for data analysis/data reporting through simple prompt modifications. By adding it to manus’s tool library, we complete your exclusive creation.
Data Analysis Agent
With our dedicated Tool, forming our Data Analysis Agent becomes even simpler!
Step 1: Inherit ToolCallAgent
ToolCallAgent is a general-purpose agent that calls various tools. By inheriting it, we already have the ability to solve problems by calling tools.
""" Inherit ToolCallAgent """
class DataAnalysis(ToolCallAgent):
    """
    A data analysis agent that uses planning to solve various data analysis tasks.This agent extends ToolCallAgent with a comprehensive set of tools and capabilities,
    including Data Analysis, Chart Visualization, Data Report.
    """
Step 2: Modify prompt
Modify system_prompt and next_step_prompt to inject the agent’s soul
class DataAnalysis(ToolCallAgent):
    """
    A data analysis agent that uses planning to solve various data analysis tasks.This agent extends ToolCallAgent with a comprehensive set of tools and capabilities,
    including Data Analysis, Chart Visualization, Data Report.
    """
    name: str = "DataAnalysis"
    description: str = "An analytical agent that utilizes multiple tools to solve diverse data analysis tasks"

    # Modify your own prompt
    system_prompt: str = SYSTEM_PROMPT.format(directory=config.workspace_root)
    next_step_prompt: str = NEXT_STEP_PROMPT
Step 3: Tool Injection
The final step, inject the available Tools, and it’s done
class DataAnalysis(ToolCallAgent):
    """
    A data analysis agent that uses planning to solve various data analysis tasks.This agent extends ToolCallAgent with a comprehensive set of tools and capabilities,
    including Data Analysis, Chart Visualization, Data Report.
    """
    name: str = "DataAnalysis"
    description: str = "An analytical agent that utilizes multiple tools to solve diverse data analysis tasks"
    system_prompt: str = SYSTEM_PROMPT.format(directory=config.workspace_root)
    next_step_prompt: str = NEXT_STEP_PROMPT
    max_observe: int = 15000
    max_steps: int = 20
    *# Inject available tools*
    available_tools: ToolCollection = Field(
        default_factory=lambda: ToolCollection(
            NormalPythonExecute(),
            VisualizationPrepare(),
            DataVisualization(),
            Terminate(),
        )
    )
Final Results
Manus
So how are the final results? Can it reach Manus’s level? Let’s try it out;
We tried a classic analysis case from Manus:
Original case replay address (requires VPN): https://manus.im/share/c3onakN6Iajcm1Vt1xAVG7?replay=1
Address for all generated products in the case: https://github.com/VisActor/VMind/tree/develop/docs/assets/openManus
This is a typical data analysis scenario, giving Manus monthly sales data and expecting a plan for 10% sales growth next month. Manus completed this task well, generating a detailed report and producing many data analysis results and data visualization results.
OpenManus Running Results
After adding VMind to OpenManus, OpenManus’s data analysis capabilities and chart generation capabilities have been significantly improved on the basis of the original general-purpose architecture, able to generate multiple high-quality markdown data analysis reports and rich and accurate data visualization results.
Task Breakdown
The Agent will break down the overall task into: data processing, data analysis, data visualization, pattern recognition, strategy generation, and final report generation for execution
Final Report
After all tasks are completed, we generated the final data report and multiple intermediate analysis result reports. The data report also includes links to the generated visualizations
Visualization Results
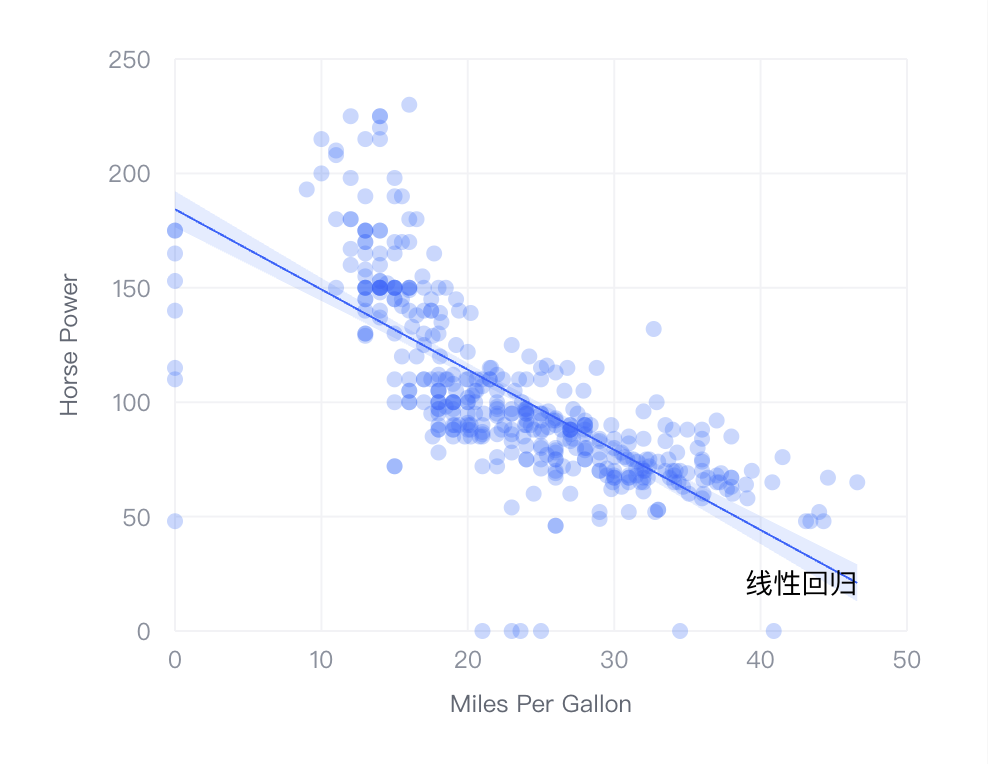
Below are some data visualization results, able to generate interactive chart pages (VChart rendering) with data annotations
Final Words
Summary
Thanks to OpenManus’s concise and versatile design, adding new Tools or Agents on its basis is quite simple 🚀
Developers only need to focus on the specific implementation and input/output of their tools, without spending a lot of energy on Agent frameworks, interactions, and communication with large models, easily creating their own Agents!
The DataAnalysis Agent is such an example. We only need to design the corresponding data analysis tools to have super-strong data analysis capabilities. Perhaps this is what it feels like to stand on the shoulders of giants!
Next Steps
This is just our small attempt. There are still many issues. We will continue to improve the scheduling capabilities of data analysis tools and integrate more powerful VMind mcp services. Our goal is to create a full-process tool that integrates data analysis, chart recommendation, automatic beautification, automatic layout, and automatic report generation. The products include charts, reports, posters, dashboards, and presentations.
Welcome to Exchange and Co-build
Finally, everyone is welcome to participate in the open-source construction of OpenManus and VisActor in various ways. Submitting issues, writing code, adding comments, and starring are all support for open-source projects.
OpenManus: https://github.com/FoundationAgents/OpenManus
VisActor: https://visactor.com/
VMind: https://github.com/VisActor/VMind
VChart: GitHub — VisActor/VChart: VChart, more than just a cross-platform charting library, but also an expr
VTable: https://github.com/VisActor/VTable
VisActor Feishu Exchange Group:
메타데이터
- post_id
- c1bf3d2774f0
- slug
- openmanus-major-capability-upgrade-quickly-build-your-data-analysis-assistant-c1bf3d2774f0
- url
- https://medium.com/@xuanhun9/openmanus-major-capability-upgrade-quickly-build-your-data-analysis-assistant-c1bf3d2774f0
- canonical_url
- https://medium.com/@xuanhun9/openmanus-major-capability-upgrade-quickly-build-your-data-analysis-assistant-c1bf3d2774f0
- author_url
- https://medium.com/@xuanhun9
- status
- ok
- fetched_at
- 2026-07-20 00:12:32