GIS-Based Flood Prediction and Disaster Management Using Remote Sensing
How GIS and Remote Sensing Help in Flood Risk Analysis and Disaster Management
GIS-Based Flood Prediction and Disaster Management Using Remote Sensing
How GIS and Remote Sensing Help in Flood Risk Analysis and Disaster Management
Introduction
Floods are one of the most destructive natural disasters affecting human life, agriculture, transportation, and infrastructure. Every year, many regions across the world suffer from severe flooding due to heavy rainfall, overflowing rivers, cyclones, dam failures, and poor drainage systems. In India, states such as Maharashtra, Kerala, Assam, and Bihar frequently experience floods during the monsoon season.
Traditional flood monitoring methods are often slow and less accurate. Modern technologies like Geographic Information System (GIS) and Remote Sensing have improved flood prediction and disaster management significantly.
GIS helps in collecting, storing, analyzing, and visualizing geographical data, while remote sensing provides satellite images and environmental information from space. Together, these technologies help identify flood-prone areas, monitor water spread, and support emergency response systems.
Flood prediction using GIS is now widely used for:
- Disaster management
- Urban planning
- Water resource management
- Environmental monitoring
- Public safety
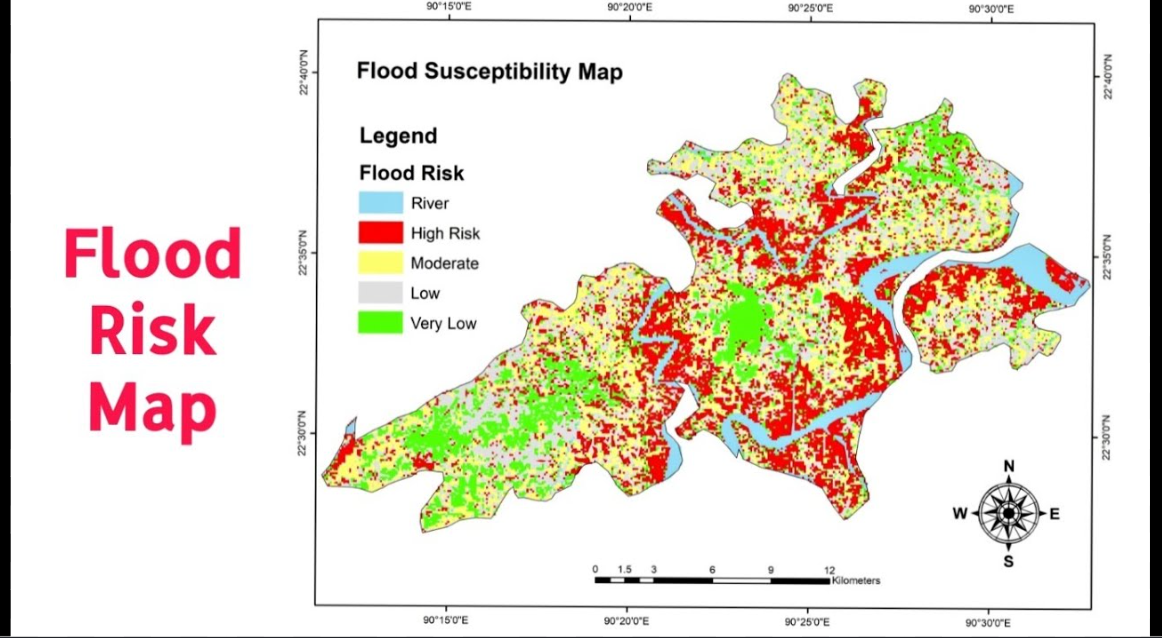
Fig 1: GIS-based flood risk mapping
Understanding GIS and Remote Sensing
What is GIS?
Geographic Information System (GIS) is a computer-based system used to collect, manage, analyze, and display spatial or geographic data. GIS works using multiple layers of information such as:
- Roads
- Rivers
- Population
- Elevation
- Rainfall
- Soil type
- Vegetation
These layers help users understand spatial relationships and environmental patterns.
What is Remote Sensing?
Remote sensing is the process of collecting information about Earth’s surface without direct physical contact. Satellites and sensors capture images and environmental data from space.
Types of Remote Sensing
- Active Remote Sensing This type uses its own energy source, such as RADAR, to collect information from the Earth’s surface.
- Passive Remote Sensing This type uses reflected sunlight to capture images and environmental data.
Satellites Used in Flood Monitoring
- Sentinel-1 — Used for flood mapping and monitoring water spread.
- Landsat-8 — Used for land use and environmental monitoring.
- Sentinel-2 — Used for water body analysis and vegetation mapping.
- INSAT — Used for weather forecasting and rainfall monitoring.

Fig 2: Different GIS data layers
Role of GIS in Flood Prediction
GIS plays an important role in predicting floods because floods are spatial events affected by terrain, rainfall, drainage systems, and land use patterns.
Major Functions of GIS in Flood Prediction
1. Flood Risk Mapping
GIS identifies flood-prone regions using spatial analysis.
2. Real-Time Monitoring
Satellite imagery helps monitor rainfall and water spread continuously.
3. Evacuation Planning
GIS helps authorities identify safe routes and shelters during emergencies.
4. Damage Assessment
Flooded areas can be analyzed quickly after disasters.
5. Resource Management
Emergency teams and rescue operations can be managed efficiently.
Data Used in Flood Prediction
Flood prediction systems require different types of data:
- Rainfall data
- River network data
- Digital Elevation Model (DEM)
- Land use and land cover data
- Historical flood records
- Soil data

Fig 3: Flood-prone area visualization using GIS
Methodology of GIS-Based Flood Prediction
Flood prediction involves several important steps.
Step 1: Data Collection
Data is collected from:
- ISRO
- NASA
- IMD
- USGS
- Satellite imagery
Step 2: Data Preprocessing
The collected data is cleaned and converted into GIS-compatible formats.
Step 3: Layer Creation
Different GIS layers are prepared:
- Rainfall layer
- Elevation layer
- Drainage layer
- Population layer
Step 4: Spatial Analysis
GIS tools analyze relationships between different datasets.
Step 5: Flood Hazard Mapping
Flood-prone zones are generated using overlay analysis.
Flood Risk Formula
FRI = (R × D) / S
Where:
- FRI = Flood Risk Index
- R = Rainfall intensity
- D = Drainage density
- S = Slope factor
Example Calculation
Suppose:
- Rainfall = 150 mm
- Drainage density = 8
- Slope factor = 5
Then:
FRI = (150 × 8) / 5 FRI = 240
A high Flood Risk Index indicates severe flood vulnerability.

Fig 4: Methodology of GIS-based flood prediction
GIS Analysis Techniques
1. Buffer Analysis
Buffer zones are created around rivers and lakes to identify nearby flood-prone regions.
Example:
- 500-meter river buffer
- 1-km flood danger zone
2. Overlay Analysis
Different GIS layers are combined:
- Rainfall
- Elevation
- Drainage
- Land use
This helps identify high-risk areas.
3. Interpolation Technique (IDW)
Inverse Distance Weighting (IDW) predicts unknown values using nearby known points.
IDW Formula:
Z(x₀) = Σ[Z(xᵢ)/dᵢᵖ] ÷ Σ[1/dᵢᵖ]
Where:
- Z(x₀) = predicted value
- Z(xᵢ) = known value
- dᵢ = distance
- p = power parameter
4. Heatmaps
Heatmaps visually represent flood intensity and flood-prone regions.
Fig 5: Heatmap showing flood intensity
Case Study: Kerala Floods 2018
Background
Kerala experienced one of the worst floods in Indian history during August 2018 due to heavy rainfall and dam overflow.
The disaster caused:
- Loss of human lives
- Damage to roads and bridges
- Agricultural destruction
- Large-scale displacement
Role of GIS and Remote Sensing
GIS and remote sensing technologies helped authorities in:
- Flood extent mapping
- Rescue planning
- Dam monitoring
- Relief distribution
- Identifying affected villages
Sentinel-1 satellite imagery was used because radar satellites can capture images even during cloudy weather.
Results
GIS analysis identified:
- Highly submerged regions
- Safe evacuation routes
- Emergency shelter locations
Flood hazard maps improved disaster response and management efficiency.
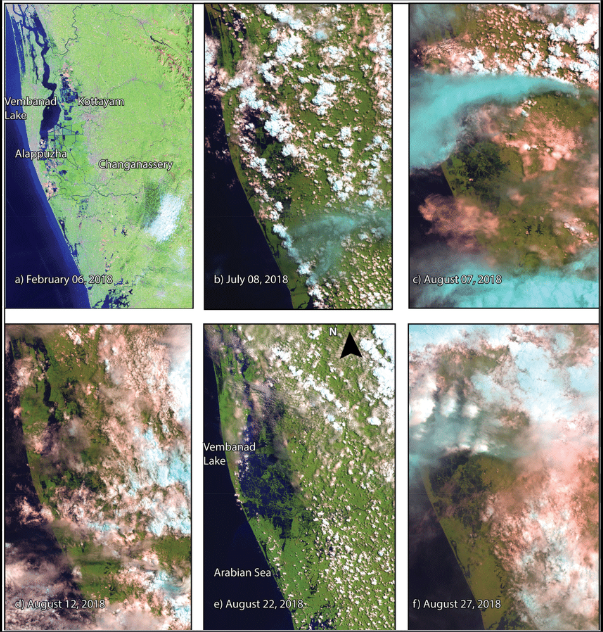
Fig 5: Satellite image of Kerala floods 2018
Advantages of GIS in Flood Management
- Accurate flood prediction and risk analysis
- Faster decision-making during disasters
- Real-time monitoring using satellite data
- Helps identify flood-prone areas
- Supports evacuation and rescue planning
- Reduces damage to life and property
- Improves disaster preparedness
- Better management of water resources
- Useful for urban and environmental planning
- Helps government agencies in emergency response
Challenges of GIS-Based Flood Prediction
1. High Cost
GIS software and satellite systems are expensive.
2. Skilled Personnel
GIS analysis requires technical expertise.
3. Data Accuracy Issues
Incorrect data can affect prediction results.
4. Large Data Processing
Satellite imagery requires powerful computers.
Future Scope
Future GIS systems will include:
- Artificial Intelligence (AI)
- Machine Learning
- Internet of Things (IoT)
- Real-time flood sensors
- 3D flood simulations
These technologies will improve:
- Early warning systems
- Disaster preparedness
- Urban flood management
- Environmental protection
Conclusion
GIS and Remote Sensing technologies have transformed flood prediction and disaster management. By combining satellite imagery, rainfall analysis, elevation models, and spatial data, GIS can accurately identify flood-prone regions and support emergency planning.
Flood hazard maps and real-time monitoring systems help governments and disaster management authorities reduce damage and protect human life.
As climate change increases the frequency of floods, GIS-based prediction systems will become more important for sustainable development and public safety.
References
- ISRO Bhuvan Portal — https://bhuvan.nrsc.gov.in
- ESA Sentinel Data — https://sentinel.esa.int
- Google Earth Engine — https://earthengine.google.com
- USGS Landsat Program — https://www.usgs.gov
- IMD Weather Reports — https://mausam.imd.gov.in
- National Remote Sensing Centre (NRSC)
- Research Papers on GIS and Flood Prediction
메타데이터
- post_id
- c2847daade93
- slug
- gis-based-flood-prediction-and-disaster-management-using-remote-sensing-c2847daade93
- url
- https://medium.com/@ahinsadhote02/gis-based-flood-prediction-and-disaster-management-using-remote-sensing-c2847daade93
- canonical_url
- https://medium.com/@ahinsadhote02/gis-based-flood-prediction-and-disaster-management-using-remote-sensing-c2847daade93
- author_url
- https://medium.com/@ahinsadhote02
- status
- ok
- fetched_at
- 2026-07-29 03:37:54