SNORT-THM WALKTHROUGH
Learn how to use Snort to detect real-time threats, analyse recorded traffic files and identify anomalies.
SNORT-THM WALKTHROUGH
Learn how to use Snort to detect real-time threats, analyse recorded traffic files and identify anomalies.
Task 1 Introduction

This room expects you to be familiar with basic Linux command-line functionalities like general system navigation and Network fundamentals (ports, protocols and traffic data). The room aims to encourage you to start working with Snort to analyse live and captured traffic.
Before joining this room, we suggest completing the ‘Network Fundamentals’ module. If you have general knowledge of network basics and Linux fundamentals, you will be ready to begin! If you feel you need assistance in the Linux command line, you can always refer to our “Linux Fundamentals” rooms (here 1 2 3 ) ;
SNORT is an open-source, rule-based Network Intrusion Detection and Prevention System (NIDS/NIPS) . It was developed and still maintained by Martin Roesch, open-source contributors, and the Cisco Talos team.
**The official description: **“Snort is the foremost Open Source Intrusion Prevention System (IPS) in the world. Snort IPS uses a series of rules that help define malicious network activity and uses those rules to find packets that match against them and generate alerts for users.”
Answer the questions below
Read the task above.
Task 2 Interactive Material and VM

Interactive material and exercise setup
Deploy the machine attached to this task; it will be visible in the split-screen view once it is ready. If you don’t see a virtual machine load, click the Show Split View button.

Once the machine had fully started, you will see a folder named “Task-Exercises” on the Desktop. Each exercise has an individual folder and files; use them accordingly to the questions.
Everything you need is located under the “Task-Exercises” folder.
There are two sub-folders available:
- Config-Sample: Sample configuration and rule files. These files are provided to show what the configuration files look like. Installed Snort instance doesn’t use them, so feel free to practice and modify them. Snort’s original base files are located under /etc/snort folder.
- Exercise-Files: There are separate folders for each task. Each folder contains pcap, log and rule files ready to play with.

Traffic Generator
The machine is offline, but there is a script (traffic-generator.sh) for you to generate traffic to your snort interface. You will use this script to trigger traffic to the snort interface. Once you run the script, it will ask you to choose the exercise type and then automatically open another terminal to show you the output of the selected action.
Note that each traffic is designed for a specific exercise. Make sure you start the snort instance and wait until to end of the script execution. Don’t stop the traffic flood unless you choose the wrong exercise.
Run the “traffic generator.sh” file by executing it as sudo.

General desktop overview. Traffic generator script in action.

Once you choose an action, the menu disappears and opens a terminal instance to show you the output of the action.

Answer the questions below
Navigate to the Task-Exercises folder and run the command “./.easy.sh” and write the output


Task 3 Introduction to IDS/IPS

Before diving into Snort and analysing traffic, let’s have a brief overview of what an Intrusion Detection System (IDS) and Intrusion Prevention System (IPS) is. It is possible to configure your network infrastructure and use both of them, but before starting to use any of them, let’s learn the differences.
Intrusion Detection System (IDS)
IDS is a passive monitoring solution for detecting possible malicious activities/patterns, abnormal incidents, and policy violations. It is responsible for generating alerts for each suspicious event.
There are two main types of IDS systems;
- Network Intrusion Detection System (NIDS) — NIDS monitors the traffic flow from various areas of the network. The aim is to investigate the traffic on the entire subnet. If a signature is identified, an alert is created.
- Host-based Intrusion Detection System (HIDS) — HIDS monitors the traffic flow from a single endpoint device. The aim is to investigate the traffic on a particular device. If a signature is identified, an alert is created.
Intrusion Prevention System (IPS)
IPS is an active protecting solution for preventing possible malicious activities/patterns, abnormal incidents, and policy violations. It is responsible for stopping/preventing/terminating the suspicious event as soon as the detection is performed.
There are four main types of IPS systems;
- Network Intrusion Prevention System (NIPS) — NIPS monitors the traffic flow from various areas of the network. The aim is to protect the traffic on the entire subnet. If a signature is identified, the connection is terminated.
- Behaviour-based Intrusion Prevention System (Network Behaviour Analysis — NBA) — Behaviour-based systems monitor the traffic flow from various areas of the network. The aim is to protect the traffic on the entire subnet. If an anomaly is identified, the connection is terminated.
Network Behaviour Analysis System works similar to NIPS. The difference between NIPS and Behaviour-based is that behaviour based systems require a training period (also known as “baselining”) to learn the normal traffic and differentiate the malicious traffic and threats. This model provides more efficient results against new and unknown threats.
The system is trained to know the “normal” to detect “abnormal”. The training period is crucial to avoid any false positives. In case of any security breach during the training period, the results will be highly problematic. Another critical point is to ensure that the system is well trained to recognise benign activities.
- Wireless Intrusion Prevention System (WIPS) — WIPS monitors the traffic flow from of wireless network. The aim is to protect the wireless traffic and stop possible attacks launched from there. If a signature is identified, the connection is terminated.
- Host-based Intrusion Prevention System (HIPS) — HIPS actively protects the traffic flow from a single endpoint device. The aim is to investigate the traffic on a particular device. If a signature is identified, the connection is terminated.
HIPS working mechanism is similar to HIDS. The difference between them is that while HIDS creates alerts for threats, HIPS stops the threats by terminating the connection.
Detection/Prevention Techniques
There are three main detection and prevention techniques used in IDS and IPS solutions;
TechniqueApproach
Signature-Based
This technique relies on rules that identify the specific patterns of the known malicious behaviour. This model helps detect known threats.
Behaviour-Based
This technique identifies new threats with new patterns that pass through signatures. The model compares the known/normal with unknown/abnormal behaviours. This model helps detect previously unknown or new threats. Policy-BasedThis technique compares detected activities with system configuration and security policies. This model helps detect policy violations.
Summary
Phew! That was a long ride and lots of information. Let’s summarise the overall functions of the IDS and IPS in a nutshell.
- IDS can identify threats but require user assistance to stop them.
- IPS can identify and block the threats with less user assistance at the detection time.
Now let’s talk about Snort. Here is the rest of the official description of the snort;
“Snort can be deployed inline to stop these packets, as well. Snort has three primary uses: As a packet sniffer like tcpdump, as a packet logger — which is useful for network traffic debugging, or it can be used as a full-blown network intrusion prevention system. Snort can be downloaded and configured for personal and business use alike.”
SNORT is an open-source, rule-based Network Intrusion Detection and Prevention System (NIDS/NIPS). It was developed and still maintained by Martin Roesch, open-source contributors, and the Cisco Talos team.
Capabilities of Snort;
- Live traffic analysis
- Attack and probe detection
- Packet logging
- Protocol analysis
- Real-time alerting
- Modules & plugins
- Pre-processors
- Cross-platform support! (Linux & Windows)
Snort has three main use models;
- Sniffer Mode — Read IP packets and prompt them in the console application.
- Packet Logger Mode — Log all IP packets (inbound and outbound) that visit the network.
- NIDS (Network Intrusion Detection System) and NIPS (Network Intrusion Prevention System) Modes — Log/drop the packets that are deemed as malicious according to the user-defined rules.

Task 4 First Interaction with Snort
First, let’s verify snort is installed. The following command will show you the instance version.

Before getting your hands dirty, we should ensure our configuration file is valid.
Here “-T” is used for testing configuration, and “-c” is identifying the configuration file (snort.conf). Note that it is possible to use an additional configuration file by pointing it with “-c”.


Answer the questions below
Run the Snort instance and check the build number.

Test the current instance with “/etc/snort/snort.conf” file and check how many rules are loaded with the current build.


Test the current instance with “/etc/snort/snortv2.conf” file and check how many rules are loaded with the current build.


Task 5 Operation Mode 1: Sniffer Mode


Let’s start using each parameter and see the difference between them. Snort needs active traffic on your interface, so we need to generate traffic to see Snort in action.
To do this, use the traffic-generator script (find this in the Task-Exercise folder)
Sniffing with parameter “-i”
Start the Snort instance in verbose mode (-v) and use the interface (-i) “eth0”; sudo snort -v -i eth0
In case you have only one interface, Snort uses it by default. The above example demonstrates to sniff on the interface named “eth0”. Once you simulate the parameter -v, you will notice it will automatically use the “eth0” interface and prompt it.
Sniffing with parameter “-v”
Start the Snort instance in verbose mode (-v); sudo snort -v
Now run the traffic-generator script as sudo and start ICMP/HTTP traffic. Once the traffic is generated, snort will start showing the packets in verbosity mode as follows;

As you can see in the given output, verbosity mode provides tcpdump like output information. Once we interrupt the sniffing with CTRL+C, it stops and summarises the sniffed packets.
Sniffing with parameter “-d”
Start the Snort instance in dumping packet data mode (-d); sudo snort -d
Now run the traffic-generator script as sudo and start ICMP/HTTP traffic. Once the traffic is generated, snort will start showing the packets in verbosity mode as follows;


As you can see in the given output, packet data payload mode covers the verbose mode and provides more data.
Sniffing with parameter “-de”
Start the Snort instance in dump (-d) and link-layer header grabbing (-e) mode; snort -d -e
Now run the traffic-generator script as sudo and start ICMP/HTTP traffic. Once the traffic is generated, snort will start showing the packets in verbosity mode as follows;


Sniffing with parameter “-X”
Start the Snort instance in full packet dump mode (-X); sudo snort -X
Now run the traffic-generator script as sudo and start ICMP/HTTP traffic. Once the traffic is generated, snort will start showing the packets in verbosity mode as follows;

Note that you can use the parameters both in combined and separated form as follows;
- snort -v
- snort -vd
- snort -de
- snort -v -d -e
- snort -X
Make sure you understand and practice each parameter with different types of traffic and discover your favourite combination.

Task 6 Operation Mode 2: Packet Logger Mode


Logfile Ownership
Before generating logs and investigating them, we must remember the Linux file ownership and permissions. No need to deep dive into user types and permissions. The fundamental file ownership rule; whoever creates a file becomes the owner of the corresponding file.
Snort needs superuser (root) rights to sniff the traffic, so once you run the snort with the “sudo” command, the “root” account will own the generated log files. Therefore you will need “root” rights to investigate the log files. There are two different approaches to investigate the generated log files;
- Elevation of privileges — You can elevate your privileges to examine the files. You can use the “sudo” command to execute your command as a superuser with the following command
sudo command. You can also elevate the session privileges and switch to the superuser account to examine the generated log files with the following command:sudo su - Changing the ownership of files/directories — You can also change the ownership of the file/folder to read it as your user:
sudo chown username fileorsudo chown username -R directoryThe "-R" parameter helps recursively process the files and directories.
Logging with parameter “-l”
First, start the Snort instance in packet logger mode; sudo snort -dev -l .
Now start ICMP/HTTP traffic with the traffic-generator script.
Once the traffic is generated, Snort will start showing the packets and log them in the target directory. You can configure the default output directory in snort.config file. However, you can use the “-l” parameter to set a target directory. Identifying the default log directory is useful for continuous monitoring operations, and the “-l” parameter is much more useful for testing purposes.
The -l . part of the command creates the logs in the current directory. You will need to use this option to have the logs for each exercise in their folder.

Now, let’s check the generated log file. Note that the log file names will be different in your case.

As you can see, it is a single all-in-one log file. It is a binary/tcpdump format log. This is what it looks like in the folder view.

Logging with parameter “-K ASCII”
Start the Snort instance in packet logger mode; sudo snort -dev -K ASCII
Now run the traffic-generator script as sudo and start ICMP/HTTP traffic. Once the traffic is generated, Snort will start showing the packets in verbosity mode as follows;

Now, let’s check the generated log file.

To be able to access the generated file you will need to change the permissions. to change the permissions i used the “sudo chmod -R 755” command.
The logs created with “-K ASCII” parameter is entirely different. There are two folders with IP address names. Let’s look into them.

In a nutshell, ASCII mode provides multiple files in human-readable format, so it is possible to read the logs easily by using a text editor. By contrast with ASCII format, binary format is not human-readable and requires analysis using Snort or an application like tcpdump.
Let’s compare the ASCII format with the binary format by opening both of them in a text editor. The difference between the binary log file and the ASCII log file is shown below. (Left side: binary format. Right side: ASCII format).

Reading generated logs with parameter “-r”
Start the Snort instance in packet reader mode; sudo snort -r


Note that Snort can read and handle the binary like output (tcpdump and Wireshark also can handle this log format). However, if you create logs with “-K ASCII” parameter, Snort will not read them. As you can see in the above output, Snort read and displayed the log file just like in the sniffer mode.
Opening log file with tcpdump.

Opening log file with Wireshark.

“-r” parameter also allows users to filter the binary log files. You can filter the processed log to see specific packets with the “-r” parameter and Berkeley Packet Filters (BPF).
sudo snort -r logname.log -Xsudo snort -r logname.log icmpsudo snort -r logname.log tcpsudo snort -r logname.log 'udp and port 53'
The output will be the same as the above, but only packets with the chosen protocol will be shown. Additionally, you can specify the number of processes with the parameter “-n”. The following command will process only the first 10 packets:
snort -dvr logname.log -n 10
Please use the following resources to understand how the BPF works and its use.
- https://en.wikipedia.org/wiki/Berkeley_Packet_Filter
- https://biot.com/capstats/bpf.html
- https://www.tcpdump.org/manpages/tcpdump.1.html
Now, use the attached VM and navigate to the Task-Exercises/Exercise-Files/TASK-6 folder to answer the questions!
Answer the questions below
Investigate the traffic with the default configuration file with ASCII mode.
sudo snort -dev -K ASCII -l .
Execute the traffic generator script and choose “TASK-6 Exercise”. Wait until the traffic ends, then stop the Snort instance. Now analyse the output summary and answer the question.
sudo ./traffic-generator.sh
Now, you should have the logs in the current directory. Navigate to folder “145.254.160.237”. What is the source port used to connect port 53?

Use snort.log.1640048004
Read the snort.log file with Snort; what is the IP ID of the 10th packet?
snort -r snort.log.1640048004 -n 10

Read the “snort.log.1640048004” file with Snort; what is the referer of the 4th packet?

Read the “snort.log.1640048004” file with Snort; what is the Ack number of the 8th packet?

Read the “snort.log.1640048004” file with Snort; what is the number of the “TCP port 80” packets?


Task 7 Operation Mode 3: IDS/IPS

Snort in IDS/IPS Mode
Capabilities of Snort are not limited to sniffing and logging the traffic. IDS/IPS mode helps you manage the traffic according to user-defined rules.
Note that (N)IDS/IPS mode depends on the rules and configuration. TASK-10 summarises the essential paths, files and variables. Also, TASK-3 covers configuration testing. Here, we need to understand the operating logic first, and then we will be going into rules in TASK-9.

Let’s start using each parameter and see the difference between them. Snort needs active traffic on your interface, so we need to generate traffic to see Snort in action. To do this, use the traffic-generator script and sniff the traffic.
Once you start running IDS/IPS mode, you need to use rules. As we mentioned earlier, we will use a pre-defined ICMP rule as an example. The defined rule will only generate alerts in any direction of ICMP packet activity.
alert icmp any any <> any any (msg: "ICMP Packet Found"; sid: 100001; rev:1;)
This rule is located in “/etc/snort/rules/local.rules”.
Remember, in this module, we will focus only on the operating modes. The rules are covered in TASK9&10. Snort will create an “alert” file if the traffic flow triggers an alert. One last note; once you start running IPS/IDS mode, the sniffing and logging mode will be semi-passive. However, you can activate the functions using the parameters discussed in previous tasks. (-i, -v, -d, -e, -X, -l, -K ASCII) If you don’t remember the purpose of these commands, please revisit TASK4.
IDS/IPS mode with parameter “-c and -T”
Start the Snort instance and test the configuration file. sudo snort -c /etc/snort/snort.conf -T This command will check your configuration file and prompt it if there is any misconfiguratioın in your current setting. You should be familiar with this command if you covered TASK3. If you don't remember the output of this command, please revisit TASK4.
IDS/IPS mode with parameter “-N”
Start the Snort instance and disable logging by running the following command: sudo snort -c /etc/snort/snort.conf -N
Now run the traffic-generator script as sudo and start ICMP/HTTP traffic. This command will disable logging mode. The rest of the other functions will still be available (if activated).
The command-line output will provide the information requested with the parameters. So, if you activate verbosity (-v) or full packet dump (-X) you will still have the output in the console, but there will be no logs in the log folder.
IDS/IPS mode with parameter “-D”
Start the Snort instance in background mode with the following command: sudo snort -c /etc/snort/snort.conf -D
Now run the traffic-generator script as sudo and start ICMP/HTTP traffic. Once the traffic is generated, snort will start processing the packets and accomplish the given task with additional parameters.

The command-line output will provide the information requested with the parameters. So, if you activate verbosity (-v) or full packet dump (-X) with packet logger mode (-l) you will still have the logs in the logs folder, but there will be no output in the console.
Once you start the background mode and want to check the corresponding process, you can easily use the “ps” command as shown below;

If you want to stop the daemon, you can easily use the “kill” command to stop the process.

Note that daemon mode is mainly used to automate the Snort. This parameter is mainly used in scripts to start the Snort service in the background. It is not recommended to use this mode unless you have a working knowledge of Snort and stable configuration.
IDS/IPS mode with parameter “-A”
Remember that there are several alert modes available in snort;
- console: Provides fast style alerts on the console screen.
- cmg: Provides basic header details with payload in hex and text format.
- full: Full alert mode, providing all possible information about the alert.
- fast: Fast mode, shows the alert message, timestamp, source and destination ıp along with port numbers.
- none: Disabling alerting.
In this section, only the “console” and “cmg” parameters provide alert information in the console. It is impossible to identify the difference between the rest of the alert modes via terminal. Differences can be identified by looking at generated logs.
At the end of this section, we will compare the “full”, “fast” and “none” modes. Remember that these parameters don’t provide console output, so we will continue to identify the differences through log formats.
IDS/IPS mode with parameter “-A console”
Console mode provides fast style alerts on the console screen. Start the Snort instance in console alert mode (-A console ) with the following command sudo snort -c /etc/snort/snort.conf -A console
Now run the traffic-generator script as sudo and start ICMP/HTTP traffic. Once the traffic is generated, snort will start generating alerts according to provided ruleset defined in the configuration file.

IDS/IPS mode with parameter “-A cmg”
Cmg mode provides basic header details with payload in hex and text format. Start the Snort instance in cmg alert mode (-A cmg ) with the following command sudo snort -c /etc/snort/snort.conf -A cmg
Now run the traffic-generator script as sudo and start ICMP/HTTP traffic. Once the traffic is generated, snort will start generating alerts according to provided ruleset defined in the configuration file.

Let’s compare the console and cmg outputs before moving on to other alarm types. As you can see in the given outputs above, console mode provides basic header and rule information. Cmg mode provides full packet details along with rule information.
IDS/IPS mode with parameter “-A fast”
Fast mode provides alert messages, timestamps, and source and destination IP addresses. Remember, there is no console output in this mode. Start the Snort instance in fast alert mode (-A fast ) with the following command sudo snort -c /etc/snort/snort.conf -A fast
Now run the traffic-generator script as sudo and start ICMP/HTTP traffic. Once the traffic is generated, snort will start generating alerts according to provided ruleset defined in the configuration file.

Let’s check the alarm file;

IDS/IPS mode with parameter “-A full”
Full alert mode provides all possible information about the alert. Remember, there is no console output in this mode. Start the Snort instance in full alert mode (-A full ) with the following command sudo snort -c /etc/snort/snort.conf -A full
Now run the traffic-generator script as sudo and start ICMP/HTTP traffic. Once the traffic is generated, snort will start generating alerts according to provided ruleset defined in the configuration file.

Let’s check the alarm file;

As you can see in the given picture above, full style alerts contain all possible information on the action.
IDS/IPS mode with parameter “-A none”
Disable alerting. This mode doesn’t create the alert file. However, it still logs the traffic and creates a log file in binary dump format. Remember, there is no console output in this mode. Start the Snort instance in none alert mode (-A none) with the following command sudo snort -c /etc/snort/snort.conf -A none
Now run the traffic-generator script as sudo and start ICMP/HTTP traffic. Once the traffic is generated, snort will start generating alerts according to provided ruleset defined in the configuration file.

As you can see in the picture below, there is no alert file. Snort only generated the log file.

IDS/IPS mode: “Using rule file without configuration file”
It is possible to run the Snort only with rules without a configuration file. Running the Snort in this mode will help you test the user-created rules. However, this mode will provide less performance.

IPS mode and dropping packets
Snort IPS mode activated with -Q — daq afpacket parameters. You can also activate this mode by editing snort.conf file. However, you don’t need to edit snort.conf file in the scope of this room. Review the bonus task or snort manual for further information on daq and advanced configuration settings: -Q --daq afpacket
Activate the Data Acquisition (DAQ) modules and use the afpacket module to use snort as an IPS: -i eth0:eth1
Identifying interfaces note that Snort IPS require at least two interfaces to work. Now run the traffic-generator script as sudo and start ICMP/HTTP traffic.

As you can see in the picture above, Snort blocked the packets this time. We used the same rule with a different action (drop/reject). Remember, for the scope of this task; our point is the operating mode, not the rule.
Answer the questions below
Investigate the traffic with the default configuration file.
sudo snort -c /etc/snort/snort.conf -A full -l .
Execute the traffic generator script and choose “TASK-7 Exercise”. Wait until the traffic stops, then stop the Snort instance. Now analyse the output summary and answer the question.
sudo ./traffic-generator.sh
What is the number of the detected HTTP GET methods?


Task 8 Operation Mode 4: PCAP Investigation


Our ICMP rule got a hit! As you can see in the given output, snort identified the traffic and prompted the alerts according to our ruleset.
Investigating multiple PCAPs with parameter “ — pcap-list”
Let’s investigate multiple pcaps with our configuration file and see what will happen. sudo snort -c /etc/snort/snort.conf -q --pcap-list="icmp-test.pcap http2.pcap" -A console -n 10

Our ICMP rule got a hit! As you can see in the given output, snort identified the traffic and prompted the alerts according to our ruleset.
Here is one point to notice: we’ve processed two pcaps, and there are lots of alerts, so it is impossible to match the alerts with provided pcaps without snort’s help. We need to separate the pcap process to identify the source of the alerts.
Investigating multiple PCAPs with parameter “ — pcap-show”
Let’s investigate multiple pcaps, distinguish each one, and see what will happen. sudo snort -c /etc/snort/snort.conf -q --pcap-list="icmp-test.pcap http2.pcap" -A console --pcap-show
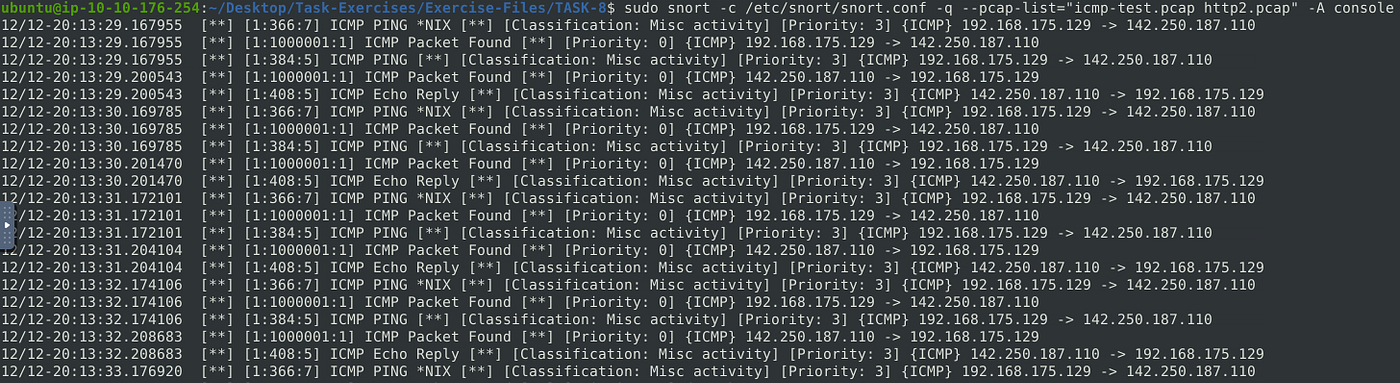

Our ICMP rule got a hit! As you can see in the given output, snort identified the traffic, distinguished each pcap file and prompted the alerts according to our ruleset.
Now, use the attached VM and navigate to the Task-Exercises/Exercise-Files/TASK-8 folder to answer the questions!
Answer the questions below
Investigate the mx-1.pcap file with the default configuration file.
Our ICMP rule got a hit! As you can see in the given output, snort identified the traffic, distinguished each pcap file and prompted the alerts according to our ruleset.
Now, use the attached VM and navigate to the Task-Exercises/Exercise-Files/TASK-8 folder to answer the questions!
Answer the questions below
Investigate the mx-1.pcap file with the default configuration file.
sudo snort -c /etc/snort/snort.conf -A full -l . -r mx-1.pcap
What is the number of the generated alerts?

Keep reading the output. How many TCP Segments are Queued?

Keep reading the output.How many “HTTP response headers” were extracted?

Investigate the mx-1.pcap file with the second configuration file.
sudo snort -c /etc/snort/snortv2.conf -A full -l . -r mx-1.pcap
What is the number of the generated alerts?

Investigate the mx-2.pcap file with the default configuration file.
sudo snort -c /etc/snort/snort.conf -A full -l . -r mx-2.pcap
What is the number of the generated alerts?

Keep reading the output. What is the number of the detected TCP packets?

Investigate the mx-2.pcap and mx-3.pcap files with the default configuration file.
sudo snort -c /etc/snort/snort.conf -A full -l . --pcap-list="mx-2.pcap mx-3.pcap"
What is the number of the generated alerts?


Task 9 Snort Rule Structure


Use “task9.pcap”. Write a rule to filter IP ID “35369” and run it against the given pcap file. What is the request name of the detected packet? You may use this command: “snort -c local.rules -A full -l . -r task9.pcap”
Navigate to task 9 and openn the “local.rules: folder with the “sudo gedit local.rules” command and edit it like this “alert icmp any any <> any any (id: 35369;sid:1000001)”

after you the “sudo snort -c local.rules -A full -l . -r task9.pcap” command

after you run the command there will be 1 alert
under task 9 open the alert with sudo gedit command
the answer is “TIMESTAMP REQUEST”

Clear the previous alert file and comment out the old rules. Create a rule to filter packets with Syn flag and run it against the given pcap file. What is the number of detected packets?
edit the local rules folder,remove the previous rule. be in task 9 open it with the “sudo nano local.rules” command and edit it like this below.

save it now let’s run snort
sudo snort -c local.rules -A full -l . -r task9.pcap

1 packet was detected is the answer.
Clear the previous alert file and comment out the old rules. Write a rule to filter packets with Push-Ack flags and run it against the given pcap file. What is the number of detected packets?
edit the local.rules folder edit out the previos rule with this new rule “alert tcp any any <> any any (msg:”Push-Ack FLAG TEST”;flags:PA;sid:10000000003; rev:1)”
save it the run snort “sudo snort -c local.rules -A full -l .r task9.pcap”

The Answer is 216.
Clear the previous alert file and comment out the old rules. Create a rule to filter UDP packets with the same source and destination IP and run it against the given pcap file. What is the number of packets that show the same source and destination address?

you create 2 rules for this because you cant add both tcp and udp on one rule so you have to create a rule for each udp and tcp as shown.
Now run the command given by TryHackMe above to use you newly written rule against the pcap file in this directory. The command is sudo snort -c local.rules -A full -l . -r task9.pcap. Press enter to run the command.
after running the command you will see the generated lof file as shown below.

So as we learned back in task 6 we can read the log file with the command sudo snort -r snort.log.1756819806, your log file may be named different but you get the gist.

The answer is 7
Case Example — An analyst modified an existing rule successfully. Which rule option must the analyst change after the implementation?
Answer is rev

Task 10 Snort2 Operation Logic: Points to Remember
Points to Remember
Main Components of Snort
- Packet Decoder — Packet collector component of Snort. It collects and prepares the packets for pre-processing.
- Pre-processors — A component that arranges and modifies the packets for the detection engine.
- Detection Engine — The primary component that process, dissect and analyse the packets by applying the rules.
- Logging and Alerting — Log and alert generation component.
- Outputs and Plugins — Output integration modules (i.e. alerts to syslog/mysql) and additional plugin (rule management detection plugins) support is done with this component.
There are three types of rules available for snort
- Community Rules — Free ruleset under the GPLv2. Publicly accessible, no need for registration.
- Registered Rules — Free ruleset (requires registration). This ruleset contains subscriber rules with 30 days delay.
- Subscriber Rules (Paid) — Paid ruleset (requires subscription). This ruleset is the main ruleset and is updated twice a week (Tuesdays and Thursdays).
You can download and read more on the rules here.
Note: Once you install Snort2, it automatically creates the required directories and files. However, if you want to use the community or the paid rules, you need to indicate each rule in the snort.conf file.
Since it is a long, all-in-one configuration file, editing it without causing misconfiguration is troublesome for some users. That is why Snort has several rule updating modules and integration tools. To sum up, never replace your configured Snort configuration files; you must edit your configuration files manually or update your rules with additional tools and modules to not face any fail/crash or lack of feature.
- **snort.conf: **Main configuration file.
- local.rules: User-generated rules file.
Let’s start with overviewing the main configuration file (snort.conf) sudo gedit /etc/snort/snort.conf
Navigate to the “Step #1: Set the network variables.” section.
This section manages the scope of the detection and rule paths.


Task 11 Conclusion
In this room, we covered Snort, what it is, how it operates, and how to create and use the rules to investigate threats.
- Understanding and practising the fundamentals is crucial before creating advanced rules and using additional options.
- Do not create complex rules at once; try to add options step by step to notice possible syntax errors or any other problem easily.
- Do not reinvent the wheel; use it or modify/enhance it if there is a smooth rule.
- Take a backup of the configuration files before making any change.
- Never delete a rule that works properly. Comment it if you don’t need it.
- Test newly created rules before migrating them to production.
Now, we invite you to complete the snort challenge room: Snort Challenge — Live Attacks
A great way to quickly recall snort rules and commands is to download and refer to the TryHackMe snort cheatsheet.

메타데이터
- post_id
- c3e655ff59fb
- slug
- snort-thm-walkthrough-c3e655ff59fb
- url
- https://medium.com/@deepercreatives/snort-thm-walkthrough-c3e655ff59fb
- canonical_url
- https://medium.com/@deepercreatives/snort-thm-walkthrough-c3e655ff59fb
- author_url
- https://medium.com/@deepercreatives
- status
- ok
- fetched_at
- 2026-07-17 19:33:32