Code Llama in Action: Testing AI-Powered Code Generation for Real-World Data Analysis
Introduction
Code Llama in Action: Testing AI-Powered Code Generation for Real-World Data Analysis
Introduction
As AI continues to reshape software development, code generation models like Code Llama are becoming increasingly popular among developers. But how well do these models perform when tackling real-world data analysis tasks? In this article, I document my hands-on experience using Code Llama to generate Python code for data cleaning and analysis, revealing both its impressive capabilities and notable limitations.
🎯 The Experiment
Research Questions
I set out to answer two critical questions:
- How effectively can Code Llama generate correct and readable Python code for real-world data cleaning and analysis tasks?
- What limitations does Code Llama exhibit when generating data analysis code, and how much human refinement is required to make the code production-ready?
Setup
I used the Continue extension in VS Code, which provides a seamless interface for interacting with Code Llama directly within my development environment.
📊 The Task: Sales Data Analysis
I gave Code Llama a practical challenge: analyze sales data from a CSV file.
The Prompt
Generate Python code using Pandas that reads a CSV file named sales.csv,
handles missing values, calculates total revenue, computes the average
sales per product, and prints the results.
💻 What Code Llama Generated
Here’s the initial code produced by Code Llama:
import pandas as pd# Read the CSV file
df = pd.read_csv('sales.csv')# Handle missing values
df = df.fillna(0)# Calculate total revenue
total_revenue = df['price'] * df['quantity']# Compute average sales per product
average_sales_per_product = total_revenue / df['quantity']# Print results
print("Total Revenue:", total_revenue)
print("\nAverage Sales Per Product:")
print(average_sales_per_product)First Impressions
At first glance, the code looks promising:
- ✅ Correct imports
- ✅ Proper pandas syntax
- ✅ Readable structure
- ✅ Syntactically valid
But does it actually work correctly? Let’s dig deeper.
🐛 The Issues I Discovered
Issue #1: Total Revenue Calculation
Problem:
total_revenue = df['price'] * df['quantity']This creates a Series, not a single number representing the total revenue!
Fix:
total_revenue = (df['price'] * df['quantity']).sum()Issue #2: Average Sales Per Product
Problem:
average_sales_per_product = total_revenue / df['quantity']This calculation:
- Divides total revenue by quantity (giving price, not average sales)
- Doesn’t group by product at all!
Fix:
df['revenue'] = df['price'] * df['quantity']
average_sales_per_product = df.groupby('product')['revenue'].mean()
Issue #3: Missing Value Handling
Problem:
df = df.fillna(0)Replacing all NaN values with 0 can be problematic and may skew the analysis.
Fix:
df = df.dropna()📈 The Results: Before vs After
Code Llama’s Output (Before Refinement)
Total Revenue: 0    150.0
1    300.0
2      NaN
3    400.0
dtype: float64
Average Sales Per Product: 0 50.0
1 100.0
2 NaN
3 100.0
dtype: float64Issues:
- Total revenue shown as a series, not a number
- No grouping by product
- NaN values appearing in output
Refined Code Output (After Fix)
Total Revenue: 850.0Average Sales Per Product:
product
Laptop 400.0
Mouse 300.0
Phone 150.0
Name: revenue, dtype: float64Improvements:
- ✅ Total revenue is a single number
- ✅ Average sales correctly grouped by product
- ✅ Missing values handled properly
📊 Visualizing the Results
To better understand the sales data, I created visualizations using the refined code:
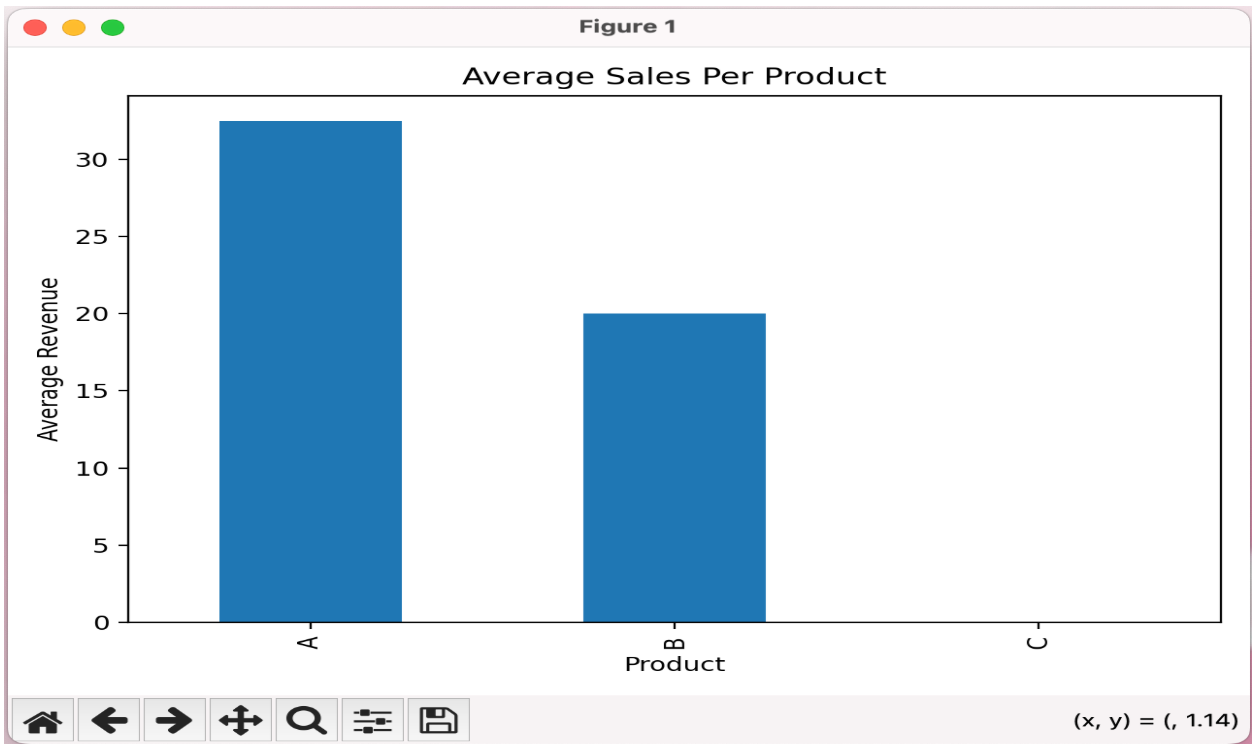
Sales Distribution by Product
import matplotlib.pyplot as plt
import seaborn as sns
# Create visualization
plt.figure(figsize=(10, 6))
sns.barplot(x=average_sales_per_product.index,
y=average_sales_per_product.values,
palette='viridis')
plt.title('Average Sales by Product', fontsize=16, fontweight='bold')
plt.xlabel('Product', fontsize=12)
plt.ylabel('Average Revenue ($)', fontsize=12)
plt.xticks(rotation=45)
plt.tight_layout()
plt.show()This visualization clearly shows that A has the highest average revenue, followed by B and C.
🎓 Key Learnings
What Code Llama Does Well
- Boilerplate Code: Excellent at generating syntactically correct pandas code
- Structure: Creates readable, well-organized code
- Library Usage: Properly imports and uses standard libraries
- Speed: Generates code almost instantly
Where Code Llama Falls Short
- Logical Accuracy: Doesn’t always understand aggregation context
- Domain Knowledge: Lacks business logic understanding
- Edge Cases: Doesn’t consider data quality issues
- Best Practices: May not follow optimal data handling patterns
🔧 Best Practices Discovered
Through this experiment, I identified several best practices for working with Code Llama:
1. Be Specific in Prompts
Instead of: “Analyze sales data” Try: “Calculate total revenue by summing the product of price and quantity, then group average revenue by product name”
2. Always Validate Output
- Test with sample data first
- Check for logical errors, not just syntax
- Verify calculations manually
3. Use Small Test Datasets
Start with a small CSV to quickly identify issues before scaling up.
4. Iterate and Refine
Think of Code Llama as a starting point, not a final solution. Be prepared to refine the code.
5. Combine AI with Human Expertise
Use Code Llama for boilerplate and structure, then apply your domain knowledge to ensure correctness.
🎯 Conclusion
Code Llama is a powerful tool that can generate syntactically correct Python code for data analysis tasks in seconds. However, it’s not a replacement for human judgment and expertise.
📚 Resources
메타데이터
- post_id
- c3ff5f0bf084
- slug
- code-llama-in-action-testing-ai-powered-code-generation-for-real-world-data-analysis-c3ff5f0bf084
- url
- https://medium.com/@anushkak1202/code-llama-in-action-testing-ai-powered-code-generation-for-real-world-data-analysis-c3ff5f0bf084
- canonical_url
- https://medium.com/@anushkak1202/code-llama-in-action-testing-ai-powered-code-generation-for-real-world-data-analysis-c3ff5f0bf084
- author_url
- https://medium.com/@anushkak1202
- status
- ok
- fetched_at
- 2026-06-24 11:06:28




