Obsessive Coherence
From structural diagnosis to predictive framework: how a single mathematical principle connects financial crises, AI hallucinations…
Obsessive Coherence
From structural diagnosis to predictive framework: how a single mathematical principle connects financial crises, AI hallucinations, educational dropout, political echo chambers, and atmospheric blocking
Every crisis has a moment where, in hindsight, the warning signs seem obvious. But what if those signs were never about disorder at all?
The Intuition That Got It Backwards
For decades, the dominant instinct in early-warning research has been to look for noise. Financial regulators monitor volatility spikes. Seismologists track micro-tremors. Climate scientists watch for anomalous fluctuations. The implicit assumption is always the same: danger announces itself through disorder. But what if the most dangerous state a complex system can enter isn’t chaos — it’s excessive order? This is the core thesis behind a research program I’ve been developing over the past two years. The idea is deceptively simple: when a system’s components become too correlated, too spectrally concentrated, too structurally rigid, the system doesn’t become stronger. It becomes fragile. It loses the internal diversity it needs to absorb shocks. And when a perturbation finally arrives — a geopolitical event, a liquidity squeeze, a weather anomaly — the system doesn’t bend. It shatters. I call this pattern obsessive coherence. And I’ve now found it in five fundamentally different systems.
One Pipeline. Five Domains. The Same Signature.
The mathematical framework — the Kappa Method — operates on correlation networks. Take n components of any system (financial assets, attention heads in an AI model, weather stations, political blogs, student activity channels). Compute their pairwise coupling. Extract the eigenstructure of that coupling matrix. Measure five things:
- How concentrated is the spectral energy? (Ohio Number — Oh)
- How rigid is the structure? (Spectral Rigidity — η)
- How dominant is the leading mode? (Eigenvalue Dominance — DEF)
- How diverse is the spectrum? (Effective Diversity — Ξ)
- How coupled are the components? (Mean Coupling — ρ̄)
Now here’s the finding that changed the direction of the research:
In every domain I tested, the stressed condition shows the same pattern: higher concentration, higher rigidity, stronger dominance, less diversity, more coupling.
Not "similar." Not "analogous." The same five directional changes, measured by the same equations, from the same pipeline.
- Financial markets → Asset correlations → 5/5 directions confirmed
- Large Language Models → Attention head correlations → 14/15 confirmed
- Education → Engagement channel correlations → 5/5 confirmed
- Political networks → Blog hyperlinks → 5/5 confirmed
- Atmospheric dynamics → Temperature station correlations → 5/5 confirmed
24 out of 25 predicted directional changes confirmed. Across substrates spanning from millisecond-scale AI token generation to month-scale financial crises. With zero domain-specific tuning.
The 2008 Crisis: Ten Months Early
The first major validation came from finance. Applied retrospectively to the 2008 Global Financial Crisis, the framework detected the onset of the Katashi regime — the crystallized, excessively coherent state — on November 13, 2007. That’s approximately ten months before Lehman Brothers collapsed on September 15, 2008. What happened in November 2007 wasn’t visible in volatility charts or credit spreads. What happened was structural: the correlation matrix of major financial assets became dominated by a single eigenvalue. All assets started co-moving as a single effective degree of freedom. The market didn’t become noisy — it became too quiet. Too ordered. Too coherent. The crisis wasn’t the onset of disorder. It was the rupture of excessive order. Disorder followed. It didn’t precede.
When AI Hallucinates, It Doesn’t Get Confused — It Gets Too Coherent
One of the most surprising applications was to Large Language Models. When a transformer like Llama-3.1 or Mistral-7B generates a hallucinated answer, the conventional intuition might be that something "went wrong" — that the attention mechanism became disorganized. The data says the opposite. In hallucinated responses, the attention heads within the critical layer become more correlated with each other, not less. The inter-head coupling tightens. The spectral concentration increases. The system enters a state of excessive internal agreement — an obsessive attractor where all heads converge on the same pattern, losing the diversity needed to fact-check or self-correct. A factual response has diverse, independent attention heads. A hallucination has heads that agree too much with each other. This finding required solving a methodological puzzle. Post-softmax attention matrices are row-stochastic (each row sums to 1), which destroys three of five per-head observables. The solution was to move to inter-head correlation — treating the N heads as N components of a network, exactly as we treat N financial assets. The same framework, the same math, applied to a completely different substrate.
Students Who Dropout Don’t Disengage — They Crystallize First
In the educational domain, using the Open University Learning Analytics Dataset (OULAD, ~32,000 students), the Kappa analysis revealed something that proxy-based approaches had missed.
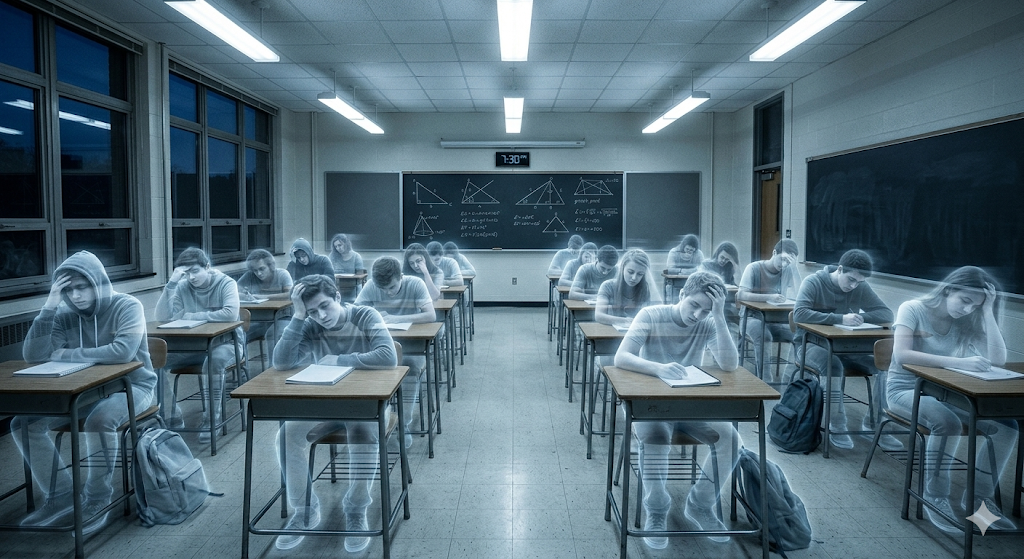
Students who eventually withdraw don’t gradually lose interest. They start with the highest structural coherence of any cohort — their activity is obsessively concentrated on a few channels. Then that coherence collapses. The Oh number (spectral concentration) drops by 1.55 standard deviations — the steepest decline of any group.
It’s the same cycle as the GFC: crystallization → rigidity → rupture → disengagement. The withdrawal isn’t the disease. The excessive initial coherence is.
Pass students? They maintain moderate, stable coherence throughout. Not too rigid, not too chaotic. Structurally healthy.
Echo Chambers Are Literally Twice as Coherent
The Political Blogosphere dataset (Adamic & Glance, 2005) gave the framework its only static-network test. No time series. No rolling windows. Just 1,491 blogs, 19,025 hyperlinks, and ground-truth political labels.
The result: echo chambers are nearly twice as spectrally concentrated as bridging structures (Oh = 140 vs 77). The dominance gap is zero in bridging networks — no dominant structural mode — versus 0.133 in echo chambers. Bridging structures are spectrally diverse. Echo chambers are spectrally obsessive.
An unexpected bonus finding: the liberal blogosphere (Oh = 91.8) was more structurally coherent than the conservative blogosphere (Oh = 73.1) in 2004. Make of that what you will.
The Atmosphere Knows the Difference Between Rigidity and Chaos
Perhaps the most elegant result came from meteorology. Using daily temperatures from 30 U.S. weather stations (Open-Meteo API, 2022–2023), the framework was applied to three extreme weather events.
The July 2023 heat dome — an atmospheric blocking event where the jet stream froze in a rigid configuration — confirmed all five directional predictions. Oh rose. Diversity fell. Distant stations became excessively correlated. It was atmospheric Katashi.
But Winter Storm Elliott and the January 2023 Arctic Blast — dynamic storm events — showed the opposite: stations decoupled, Oh fell, diversity increased.
The framework doesn’t detect all extreme events. It detects structural extreme events — where the system becomes too rigid. It correctly ignores dynamic events — where the system becomes chaotic. This discrimination is a feature, not a bug. It tells us exactly what kind of danger the framework sees: crystallization preceding rupture. Not all catastrophes. The specific catastrophes born from excessive order.
From Diagnosis to Architecture: Why One Number Isn’t Enough
Finding the same structural signature across five domains was revelatory. But it wasn’t enough. Here’s why.
In production monitoring (the Sentinel system, tracking 21 financial asset universes daily), I kept encountering cases where the structural indicators were extreme — maximum spectral concentration, maximum sensitivity — for years. Without any collapse.
Was the framework wrong? No. It was measuring the right thing — reduced structural capacity — but conflating three distinct phenomena:
- Geometric sensitivity: How reduced is the structural barrier to damage?
- Active pre-damage organization: Has the system begun reorganizing toward failure?
- Realized damage: Has the barrier actually been crossed?
A system can be geometrically sensitive (fragile) without being in active pre-damage. It can be in active pre-damage without having realized damage. And realized damage depends on a trigger that the structural framework doesn’t predict — because triggers belong to the domain, not to the geometry.
This insight led to the layered architecture:
- Layer 0 — A supervised latent representation (the LSCC — Latent Structural Crystallization Coordinate) that reads pre-damage organization directly from the structural “shape,” without requiring temporal contrast.
- Layer 2 — Geometric sensitivity analysis through attractor geometry and recurrence quantification.
- Layer 3 — Prognostic integration for operational alerting.
The LSCC achieves leave-one-universe-out AUC of approximately 0.98. It’s stable across random seeds (CV = 0.006), robust to latent dimensionality, generalizes above 0.72 in temporal splits, and passes null-baseline controls.
But — and this matters — encoder-only ablations show that the strongest LSCC organization depends on supervised pressure from a damage target. It’s a supervised structural fingerprint, not a discovered fundamental variable. I state this explicitly because honest ontology matters more than impressive numbers.
What This Means
Kappa is not a prediction of when a system will fail. It is a measurement of how fragile a system has become — and a layered instrument for distinguishing between “fragile and stable,” “fragile and reorganizing toward failure,” and “actively failing.”
The framework doesn’t predict triggers. It predicts what triggers will find when they arrive: a system that can absorb the shock, or a system that will shatter.
The Law of Katashi — systemic instability emerges from excessive structural coherence rather than noise — appears to hold across economic, computational, behavioral, social, and atmospheric systems. It holds across approximately eight orders of magnitude in temporal scale. It holds with zero domain-specific tuning.
And it suggests something that inverts our deepest intuitions about failure: the most dangerous state isn’t chaos. It’s too much order.
Resources
📄 Full paper: Obsessive Coherence — Zenodo (CC BY 4.0) https://zenodo.org/records/19398793
📄 Kappa Method v2.5: DOI: 10.5281/zenodo.19339548
📄 Kappa-FIN: DOI: 10.5281/zenodo.18917558
📄 Kappa-LLM: DOI: 10.5281/zenodo.18883790
📄 Kappa-Radiante: DOI: 10.5281/zenodo.18940478
💻 GitHub: github.com/aprimora-ai
David Ohio is an independent researcher working on topological data analysis for complex systems. Contact: odavidohio@gmail.com
메타데이터
- post_id
- c429e9ef466e
- slug
- obsessive-coherence-c429e9ef466e
- url
- https://medium.com/@ohio.contato/obsessive-coherence-c429e9ef466e
- canonical_url
- https://medium.com/@ohio.contato/obsessive-coherence-c429e9ef466e
- author_url
- https://medium.com/@ohio.contato
- status
- ok
- fetched_at
- 2026-07-26 05:38:51