Context Graphs: A Practical Guide to Governed Context for LLMs, Agents, and Knowledge Systems
Design patterns, evaluation metrics, and failure modes in context assembly — building governed context for LLMs and agents with…
Context Graphs: A Practical Guide to Governed Context for LLMs, Agents, and Knowledge Systems
Design patterns, evaluation metrics, and failure modes in context assembly — building governed context for LLMs and agents with auditability, policy enforcement, and traceable evidence
tl;dr
- Context Graphs are a governed, queryable “memory layer” that connects entities, events, decisions, policies, and evidence so LLMs/agents can answer why (not just what).
- The practical win is producing explanation packets: an answer + evidence paths + provenance + policy constraints — to reduce hallucinations and improve auditability.
- Architecturally, most teams converge on a durable master graph plus query-specific subgraphs (for token budgets, privacy minimization, and performance).
- The hardest parts aren’t graph queries — they’re instrumentation (capturing decision traces at “commit time”), incremental updates, and governance-by-default (ACL + PII handling).
- Governance is not optional: expect threats like provenance spoofing, context exfiltration via retrieval, and policy drift (old precedents applied after rules change)
- Expect a hybrid stack: graph DB + vector search + rules/ACL + observability. GraphRAG is a retrieval technique; a context graph is the governed substrate it retrieves from.
- Schema should start minimal (Customer → Ticket → Decision → Policy → Evidence), then evolve; avoid turning the graph into a dumping ground.
- Tooling choices split between property graphs (Cypher) for operational traversal and RDF/SPARQL for standards, interoperability, and provenance reasoning.
- Time-to-value is typically staged: metadata graph (weeks) → governed context graph (3–6 months) → agentic decision-trace graph (12+ months).
- Success metrics must include retrieval precision/recall, hallucination rate, provenance completeness, latency/cost, and governance incidents.
Executive Summary
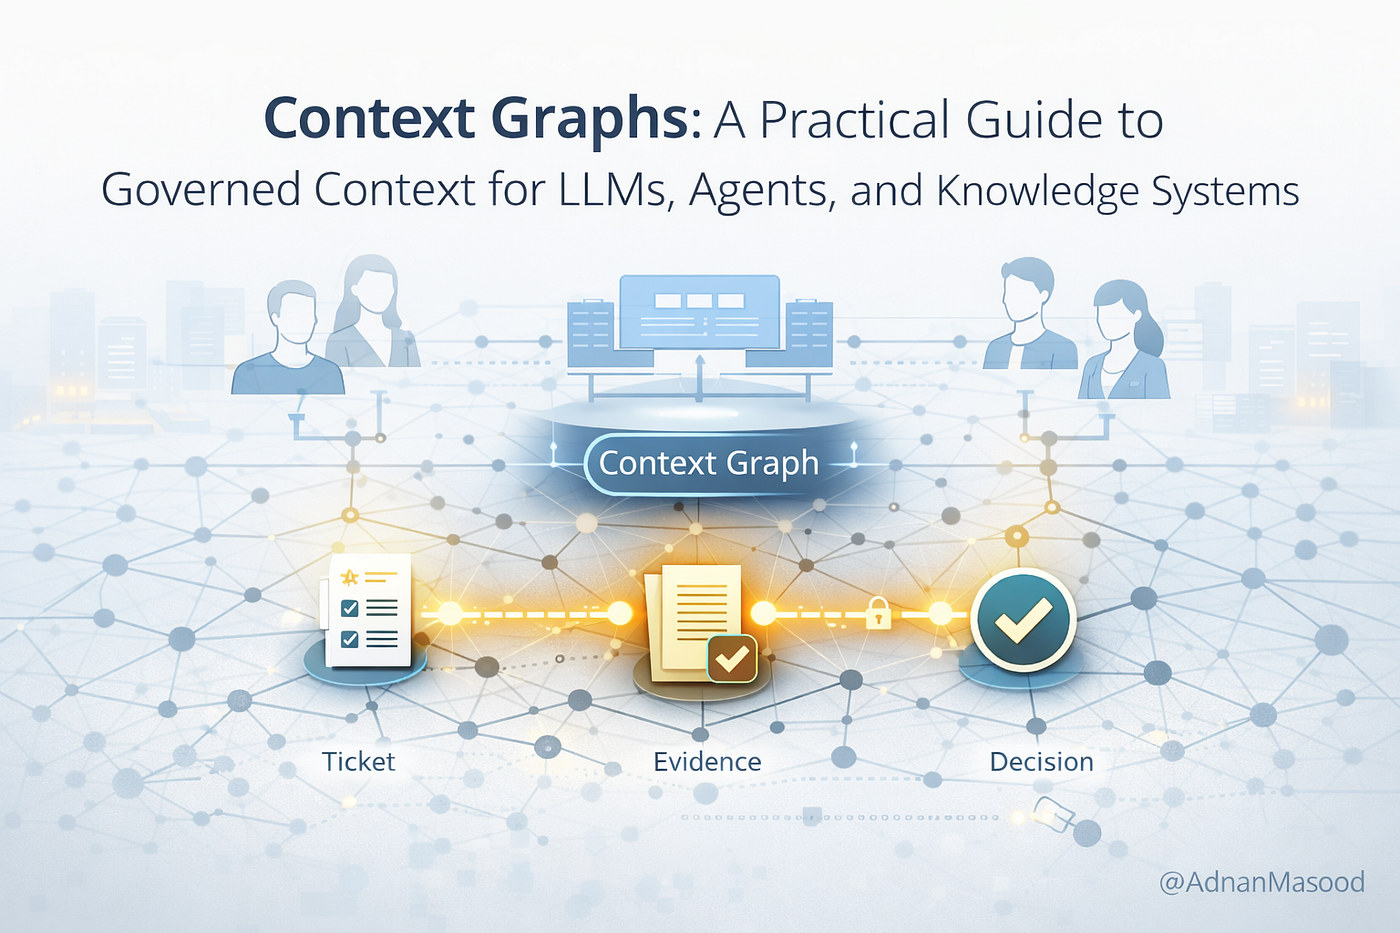
What is a context graph? In essence, a context graph is a knowledge graph augmented with contextual metadata — such as decision records, policies, time, and provenance — to capture not just what facts are true, but why, how, when, and under what conditions they became true [1], [2]. Unlike a traditional knowledge graph that represents static relationships (“what things are”), a context graph embeds the operational reality of an organization: how data flows and decisions are made in context [1]. For example, a context graph might link a customer’s support ticket to the decision that resolved it, the policy used or overridden, the evidence considered, and the approvals obtained — essentially creating a living record of decision traces across time [2]. In academic terms, context graphs often mean knowledge graphs enriched with dimensions like time validity and source provenance [3], [4]. In practice, context graphs serve as the “why” layer for AI systems, making the rationale behind actions and data accessible in a structured form.
When is it worth building a context graph? Context graphs are most valuable when AI applications (like LLM-based agents or decision support systems) operate in environments requiring trust, auditability, and complex reasoning. If your use-case demands that an AI not only fetch facts but also follow policies, justify its outputs with evidence, and learn from past exceptions, a context graph becomes critical. Enterprises building AI copilots for regulated workflows (finance, healthcare, customer support, etc.) find that “the wall isn’t missing data; it’s missing decision traces” [5], [6] — the reasoning and context that human experts take into account are not stored in standard databases. A context graph provides that missing memory. Organizations with significant investments in knowledge graphs or data catalogs may extend them into context graphs to support AI governance and reduce LLM hallucinations [7], [8]. However, if your AI tasks are simple Q&A on static facts, a full context graph might be overkill — context graphs shine in exception-heavy, dynamic decision environments where understanding why something happened is as important as what happened.
What a context graph is not: It’s important to dispel some myths. A context graph is not just a fancy term for a knowledge graph — while it builds on knowledge graph concepts, it specifically adds operational context (e.g. lineage, time, and policy) that traditional KGs lack [9], [10]. It is not merely an audit log: an audit trail records actions after the fact, whereas a context graph captures the surrounding reasoning, state, and causality of decisions [11], [12]. It is also not a data catalog or lineage tool in the old sense — those tools catalog assets and show where data came from, but a context graph goes further to show why decisions were taken and how different pieces of context connect across silos [13], [14]. Finally, a context graph is not about centralizing all enterprise data into one database. In practice, context graphs often serve as a metadata and relationship layer atop existing systems [15]. They reference source data (documents, records) via pointers or IDs, rather than duplicating all raw data. In short, a context graph overlays your existing data estate with a connective tissue of context — it’s a graph of metadata and “evidence” that enriches, rather than replaces, your source systems.
Key design choices: Building a context graph requires decisions about data modeling and architecture. One major choice is whether to use a property graph or RDF (semantic) graph approach — each has advantages (ease of querying vs. standardized ontologies) which we explore in detail. Another design factor is temporal modeling: context graphs often need bitemporal support to record both valid time (when was this fact true in reality?) and transaction time (when was it recorded in the system) for facts and decisions. Provenance representation is also crucial — context graphs embed source citations and confidence scores to ensure every claim can be traced [16], [8]. We discuss how standards like W3C PROV can be applied. On the infrastructure side, teams must decide between a single unified graph versus multiple domain-specific graphs or dynamic subgraphs — a trade-off between global context and modularity. Additionally, integration with vector search and LLM workflows is a key design aspect: modern implementations use hybrid retrieval (combining embedding-based search with graph traversal) to assemble relevant context for queries. Throughout this report, we highlight these design choices and provide guidance on selecting the right patterns and tools (summarized in an ecosystem map of databases, frameworks, and libraries).
Risks and governance: While context graphs promise richer reasoning and reduced hallucination, they introduce new challenges. Data quality and context completeness can become failure points — if the graph is missing a critical precedent or has outdated policy information, an AI agent might still make a bad call (or hallucinate a rationale). There’s a risk of “precedent poisoning”, where one-off exceptions (noise) get encoded as if they were norms [17]. We discuss mitigation strategies such as filtering or tagging context by reliability and instituting human review for novel situations. Privacy and security are paramount: a context graph, by design, brings together data from many sources and could inadvertently expose sensitive information if not properly access-controlled. We cover guardrails like role-based subgraphs and attribute-level encryption to ensure compliance (e.g. preventing an AI from seeing contexts it shouldn’t). Operationally, context graphs can become expensive to maintain — they are essentially constantly evolving knowledge bases. We provide a maturity model and roadmap to ensure teams can start small (e.g. augmenting an existing data catalog) and iteratively build up to a fully governed context graph, delivering value at each stage without boiling the ocean.
Bottom line: Context graphs represent a convergence of knowledge graphs, data lineage, and AI governance into a “context layer” for intelligent systems [15], [18]. Done right, they can significantly enhance the trustworthiness, transparency, and effectiveness of LLM and agent solutions — for example, early studies showed that injecting temporal and source context into knowledge graphs improved QA accuracy by a significant margin [7]. But context graphs are not a silver bullet or a trivial plug-in; they require careful modeling, cross-functional buy-in (from data engineering to compliance teams), and thoughtful integration with AI workflows. This report will equip you with a deep understanding of context graphs, grounded in both theory and practice, so you can decide if and how to implement one in your organization. We include hands-on labs demonstrating how to build and query a simple context graph using both property graph and RDF technologies, as well as a prototype Graph-RAG (Retrieval-Augmented Generation with graphs) pipeline. By the end, you should have a clear picture of when a context graph makes sense, how to design it, how to avoid common pitfalls, and how to incrementally achieve the benefits of a “context-aware” enterprise brain.
if your enterprise AI roadmap includes autonomous or semi-autonomous agents, a context graph is the most practical path to scaling trust, auditability, and control without crippling velocity.
Why “Context” Is the Bottleneck in LLM/Agent Systems
Modern LLMs are extremely good at recalling facts and generating text, but they struggle with contextual awareness — the ability to use the right information in the right situation with proper regard for history, policy, and nuance. To illustrate the bottleneck, consider a concrete scenario:
Scenario: An enterprise AI assistant is asked to approve a customer’s request for a $100,000 credit line increase. The LLM has read the company handbook and knows the general policy (“credit increases over $50k require risk review”). The customer’s data (credit score, account history) are available in databases. By facts alone, the model might conclude the increase is risky. However, in reality, maybe this customer had a special exception last year due to unique circumstances, approved by a VP, with conditions attached. The crucial context is the precedent and rationale behind that past exception — without it, the AI’s decision will either err on the side of caution (denying something that should be approved) or err on laxness (approving without proper conditions). In testing, the team finds that the AI’s outputs are brittle: it can cite policy, but cannot explain why a similar past request was treated differently, nor can it surface the hidden factors (like a Slack conversation about the customer’s situation) that a human manager would recall. This is the “missing context” problem in a nutshell.
In AI agents and decision-making systems, facts alone often fail to yield acceptable performance because much of the reasoning depends on context that is not in the prompt or knowledge base by default [19], [6]. As one industry analysis put it, “agents run into the same ambiguity humans resolve every day with judgment and organizational memory”, but the inputs to that judgment (the tribal knowledge of exceptions, cross-system hints, approvals outside official channels) “aren’t stored as durable artifacts” in current systems [19], [20]. In other words, AI falls short not because it lacks raw data, but because it lacks the decision traces and situational context that humans implicitly draw upon.
Several dimensions of context commonly act as bottlenecks:
- Provenance and credibility: LLMs have read a lot, but in a given answer, we need to know where a particular piece of information came from. Without provenance, AI outputs can’t be trusted in high-stakes settings (hallucinated or outdated info might slip in). For example, an AI assistant may cite a statistic — if we don’t know it came from last quarter’s board report versus a random blog, we can’t reliably use it. Provenance context (source attribution, timestamps, confidence) is often missing from the AI’s working memory by default [16], [8].
- Temporal context: A fact can be correct at one time and wrong later. Large models struggle with temporal reasoning (“What was the CEO of Company X in 2020?”) because they lack an internal timeline. In agent scenarios, knowing the state of the world at the time of a decision is critical. Was the system experiencing an outage when we made an exception on an SLA? Did a policy change last month that affects this recommendation? Most data stores give you the current state (what some have called the “state clock” [11]), whereas context requires tracking the “event clock” — what happened when, and in what sequence [21].
- Policy and rules in effect: AI agents must adhere to business rules and governance policies. However, these policies are typically documented in PDFs or code, not embedded in the prompt. If an agent can’t dynamically retrieve which rules apply in this context (and whether any rule was overridden before), it may violate compliance. For instance, a customer support bot might need to know that normally refunds above $100 require manager approval — except that during a holiday incident last year, the rule was temporarily relaxed. Context includes not just static rules but the applicable rules at that time and their exceptions [16].
- Organizational context (ownership, roles, precedents): In a complex enterprise, who is involved can alter decisions. Knowing who the owner of a data asset is, or which manager approved a past decision, is context an AI needs to avoid stepping on toes and to route tasks correctly. If an agent is triaging a support escalation, it should know that a similar ticket last week was handled by Alice on the infra team after Bob in support escalated it — a relationship graph of people, roles, and past hand-offs. Without that, the agent might not loop in the right person or might repeat a recently solved problem. As Glean’s CEO noted, “how work gets done in an enterprise is fundamentally relationship-driven” (who approves what, who is on call, etc.), and much of that context is not captured in databases [22], [23].
- Lineage and causality: Complex analytical questions often require multi-hop reasoning: e.g., “Why is this dashboard’s revenue figure different from that report’s figure?” The answer may lie in data lineage (one report uses a corrected data source that excludes certain transactions). Traditional systems can answer “where did this data come from” (lineage), but an AI agent needs to go further to “why is this number different” — which involves understanding transformations, filters, and business logic context. Without a graph of how data and decisions propagate, an LLM will either hallucinate an explanation or give up. Context about how outputs are derived is crucial for trustworthy analytics and explanations [24], [25].
In summary, context — spanning provenance, time, policy, people, and lineage — is the bottleneck that limits AI systems’ reliability in real-world enterprise scenarios. We have powerful models that can follow instructions and generate fluent answers, but if those instructions don’t come with the right context, the answers can be irrelevant at best and dangerously wrong at worst. This bottleneck has become so apparent that industry leaders have dubbed context “the missing layer” for safe and effective AI [26], [27]. The context graph is emerging as a solution to this bottleneck by providing a structured way to supply AI with governed, queryable context on demand.
To fix our scenario above, we’d want an AI assistant that can do the following when asked about the $100k credit increase: (1) retrieve the precedent — find last year’s similar request and see it was approved by VP under policy X with conditions; (2) check the state at that time — perhaps the customer had multiple outages causing the exception; (3) apply the policy — note that normally the cap is $50k, but VP approval constitutes an override; (4) gather provenance — pull up the approval memo or Slack message as evidence. With all that context, the assistant can answer: “We should escalate this request. The last time (Jan 2025) we granted a >$50k increase was under a ‘Service Impact’ exception approved by VP Jones, because the client had severe outages (see Incident #1234). According to policy, increases above $50k require executive approval when standard criteria aren’t met [28], [29]. Given similar conditions now, I recommend routing to Finance for review.” Such an answer is vastly more useful and trustworthy — and it’s exactly what a context graph enables by making all those pieces (precedent decision, incident, policy, approver) linkable and queryable.
What People Mean by “Context Graph”: Definition and Taxonomy
The term “context graph” has gained popularity recently, but it’s used in a few different (though related) ways. In this section, we clarify the meanings and map them into a simple taxonomy. Despite variations, all definitions share a core idea: connecting facts with their context in a graph structure. We outline three major interpretations of “context graph” in the wild and then identify their common core and differences.
1. Enterprise/Agentic Context Graph (Decision Trace Graph): In the enterprise AI and “AI agent” community, a context graph usually refers to a graph that captures decision-making context and governance metadata for automated or assistive workflows. This view was articulated by Jaya Gupta et al. as “a living record of decision traces stitched across entities and time so precedent becomes searchable” [2]. Here, the context graph is essentially a system of record for decisions: it stores events like approvals, exceptions, and actions taken by agents, along with links to the policies and data involved. The focus is on enabling traceability, auditability, and reuse of organizational knowledge. For example, an agent startup in quote-to-cash automation might log every quote approval decision into a context graph, linking it to the customer account, the discount policy used, who approved it, and why [28], [29]. Later, when a similar quote comes in, the agent can query the graph for precedents instead of operating blindly. In this sense, the context graph acts as the enterprise memory for agentic AI. It’s not about the AI’s internal chain-of-thought, but an external record of the context in which decisions have been made [2]. This interpretation emphasizes governance: context graphs store business rules as first-class nodes, encode which rule versions were active at a time, and log deviations (overrides) for future reference [16], [12]. It’s also strongly time-aware — every decision node has timestamps or validity intervals, so one can reconstruct “what did we know and what rules were in force when we made this decision.” In summary, the enterprise context graph is about why the organization did what it did — capturing the why behind the what. Think of it as the next evolution of data lineage and audit logs, merging them into a graph that an AI (or human) can traverse to answer “why did this happen and what should happen next?” [30], [29].
2. Academic Contextualized Knowledge Graph: In academic research on knowledge representation, a “context graph” (or contextual knowledge graph) often refers to a knowledge graph that has been enriched with contextual qualifiers such as time, location, provenance, or situation. Traditional knowledge graphs store facts as triples (subject–predicate–object). A contextual knowledge graph extends this by effectively using quadruples or n-tuples, adding extra dimensions like (subject, predicate, object, context) [10]. For example, instead of stating “Alice works at TechCorp”, a contextual KG might record “Alice works at TechCorp [from 2018 to 2022] {source: LinkedIn}”. The academic motivation is that many real-world facts are contextual – they hold true only under certain conditions or periods – and capturing this explicitly yields better reasoning. A recent research paper defines context graphs as “expanding knowledge graphs with contextual information – including temporal dynamics, geographic location, and source provenance” [7] and shows that this improves performance on knowledge graph completion and QA tasks. In effect, this view sees a context graph as a knowledge graph + context meta-data on edges or nodes, enabling nuanced queries like “Who was CEO of Company X in 2020?” or “What evidence supports this relationship?”. The academic context graph also overlaps with the idea of a temporal knowledge graph (time-indexed facts) and the use of named graphs in RDF to attach provenance to statements. It’s about making the KG multi-dimensional. Notably, this concept is being brought into LLM reasoning research: there’s work on using LLMs with context graphs where the model retrieves not just entities but also relevant context subgraphs to answer questions [31], [32]. In our narrative, this academic view aligns with building a better knowledge base for AI – one that contains “facts in context” so that contradictions and temporal changes can be handled gracefully [33], [34]. If a regular knowledge graph is a static map of facts, a contextual knowledge graph is a dynamic map that can say when and according to whom each fact is valid.
3. Product/Workflow Memory System (Contextual AI Memory): A third usage of “context graph” has emerged in the AI product and startup space, referring to the internal memory structure used by AI co-pilots or agent frameworks to accumulate knowledge over sessions. For example, Writer (an enterprise AI company) describes their “orchestration graph” (essentially a context graph) as a way to capture how work gets done in marketing — connecting content pieces, approvals, legal exceptions, and outcomes — so that their AI can produce on-brand and compliant content consistently [35], [36]. In developer tools, the term appears in projects like ContextGraph.dev, which aims to create a self-improving loop for AI coding assistants, connecting planning, code generation, and feedback into a graph so that the AI “learns from every completion, review, and fix” rather than starting from scratch each time. This product-centric notion of context graph is basically a workflow memory graph. It may look very domain-specific: e.g., a sales context graph linking accounts, contacts, interactions, and sales decisions (Regie.ai’s blog on AI sales agents advocates storing all those decision records so the AI can use them [37], [38]). Or a “marketing context graph” linking campaigns, creatives, and their performance so an AI can answer “what has worked before and why” [39], [40]. These are sometimes branded differently (“enterprise brain”, “workflow graph”), but fundamentally they create a graph of past events and results to give process awareness to AI. The distinguishing feature here is often compound feedback loops and skills: the graph not only stores facts, but also lessons learned or adjustments. For instance, a coding assistant’s context graph might record that a certain fix was applied after a test failed, forming a precedent to auto-apply that fix in similar future code changes. The “context graph” term is used in these settings to emphasize that the AI’s capabilities compound over time by having a persistent structured memory of contextual episodes. It’s akin to an experience graph for the AI. Many agent frameworks (LangChain, etc.) don’t yet have robust long-term memory beyond vector stores, so this is an emerging area — essentially product teams are realizing they need a graph of interactions, states, and outcomes to push agents beyond toy tasks. It’s also deeply linked with “context engineering”, the practice of designing and feeding context to LLMs. Some vendors call their entire context data layer a “context graph” — for example, TrustGraph markets itself as a “context operating system” that turns fragmented data into interconnected context graphs for AI consumption [41], [42]. In short, in product terms a context graph is often the application-specific knowledge + memory that makes an AI system smart in that domain (be it coding, marketing, sales, etc.), capturing ongoing context like user preferences, workflow state, and results of prior AI actions.
Shared core definition: Despite different angles, these variants share a fundamental principle: a context graph connects core facts (entities and relationships) with the contextual metadata needed to use those facts correctly. Whether it’s an academic quadruple like (Alice, worksAt, TechCorp, [valid 2018–2022]) or an enterprise node like Decision #123 linked to Policy v3.2 and Evidence doc XYZ, the idea is to bind data to metadata that provides meaning in context. All context graphs treat some form of governance or situational information as first-class citizens in the data model (be it time, provenance, or decision rationale) [16], [10]. Another commonality is that context graphs are graph-structured. Why graph? Because context by nature is connected and multi-hop — graphs can naturally represent many-to-many relationships like “this decision was informed by multiple prior incidents and affects multiple accounts.” Graphs also support flexible schema evolution, which is useful as you incorporate more types of context (adding a new node type for “Incident” or “ChatMessage” easily, rather than altering a bunch of relational tables).
Taxonomy of variants: We can classify context graphs along two axes: (A) Primary Purpose — is it mainly to aid automated decisions & agents (enterprise/agentic) or to improve knowledge retrieval & reasoning (academic KG) or to serve as a process memory (workflow/product)?; and (B) Scope of Context — enterprise context graphs often have governance and precedent context; academic ones emphasize temporal and provenance context; product ones focus on workflow state and feedback. In practice, there’s overlap and convergence. For instance, an enterprise could build a context graph that is both a decision trace repository and a contextual knowledge base with temporal facts — capturing “we calculated Metric X last week under Version 2 of the policy, using data as of 2025–12–31, and here’s the SQL job that did it.” That combines decision lineage with temporal provenance. Our focus in this guide is holistic, but we will explicitly note which aspects belong to which variant. The table below summarizes a few key differences to anchor the concept:

Despite the nuanced definitions, the trend is that these meanings are converging. Vendors and researchers alike see that to truly ground AI in enterprise reality, one must unify the semantic knowledge (KG) with operational and temporal context (lineage, time, policy, etc.) [14]. The term “context graph” has become a handy shorthand for this unified, context-rich knowledge layer.
What a Context Graph Contains (Making It Concrete)
So, what actually goes into a context graph? This section breaks down the typical contents and schema of a context graph. By design, context graphs are heterogeneous — they bring together many types of nodes and relationships. However, there are recurring building blocks we can identify: entities, events/decisions, contextual metadata nodes, and links (edges) that tie them together. We’ll describe a “canonical” schema that many context graphs (implicitly or explicitly) implement, and then discuss how it can be extended.
At minimum, a context graph will have:
- Entities: These are the real-world things or abstract concepts that your data is about — analogous to the nodes of a traditional knowledge graph. Entities can be customers, products, employees, accounts, documents, etc. If you already have a knowledge graph or a data catalog, those entities are likely represented there. In a context graph, entities are still present (often inherited from an existing KG or master data system). For example,
Person,Company,Ticket,Order,Dataset, etc., each would be a node type. Entities answer the “what exists?” question [43] – e.g., a node for “Customer #123” or “Policy ABC v3.2”. - Relationships between entities: These are the static or slowly changing links: customer owns account, product part of category, dataset located in database X. In a property graph model these are edges with types; in RDF these might be triples. These relationships often encode both semantic connections (as a knowledge graph would) and technical lineage (as a data catalog would). For instance, you might have
(:Person)-[:OWNS]->(:Account)or(:Table)-[:FEEDS]->(:Dashboard)links to represent who owns what or how data flows [44]. Entity-entity relationships give structure to your domain and are queryable for context (e.g., to find all accounts a person owns, or all datasets under a steward’s purview). - Decision/Event nodes: Here is where context graphs depart from a plain KG. Context graphs introduce nodes for events, decisions, or occurrences — things that happen, rather than things that exist. Common examples:
Decisionnodes (representing a decision made at a point in time),Transactionnodes (a specific transaction event),Eventnodes (like an incident or an alert),Conversationnodes (like a Slack thread or email thread that took place). These nodes typically carry a timestamp or interval and often have attributes describing the event (e.g., a Decision node might havetimestamp=2025-10-01T10:30Z,outcome="approved",agent="AI"or"human", etc.). In some implementations, every important action in the system becomes a node in the graph. For example, Neo4j’s context graph model for financial services includes nodes forDecision,Exception,Escalation, each of which is an event type that can be linked in sequences [45], [46]. Event nodes enable the graph to capture dynamics: they answer “what happened and when?” and allow queries like “find the sequence of events leading to X”. - Contextual metadata nodes: These are a bit abstract sounding, but essentially cover things like Policy, Rule, Procedure, Metric Definition, Glossary Term, Risk Indicator, etc. They are often governance or reference information represented as nodes so that they can be linked into decision/event trails. For instance, a
Policynode representing “Refund Policy v2.1” might be linked toDecisionevents that either applied that policy or violated/overrode it [16], [47]. Another example is aRequirementorControlnode (in governance contexts) linked to decisions to indicate compliance. By having policies as nodes rather than just text, you can query the graph for “which decisions involved Policy X” or “what policies were in effect for Decision Y”. Similarly, aGlossaryorBusiness Termnode might connect to data assets or decisions to clarify semantics (e.g., a Decision node “classified as High Risk” could link to aRisk Levelnode that defines what High Risk means). These contextual nodes turn implicit documentation into explicit graph elements. - Evidence or Source nodes: Many context graphs also include nodes that represent evidence, sources, or artifacts that played a role in a decision. For example, an
Evidencenode could be a snippet of a document, an email, or a reference to a database record that was used to make a decision [37], [38]. If an agent pulled three PagerDuty incidents to justify an exception (as in the earlier renewal example [28], [48]), those incidents could each be nodes or attached as records in the context graph. Similarly, aCitationnode orSource Documentnode might be used to point to the origin of a fact (especially in contextual knowledge graphs – e.g., linking a triple to a Wikipedia article node or dataset node as its provenance). These evidence nodes ensure that for any claim or decision, one can traverse to “how do we know this?” or “what did we look at to decide this?”. In some cases, evidence might just be captured as attributes (like a URL or document ID), but making it a node allows linking multiple decisions to the same evidence piece and evaluating its usage. - Lineage and dependency links: A context graph often contains relationships that form chains or networks of influence. For example, causal links between decisions: Decision A caused or influenced Decision B [49]. Or precedent links: Decision C is a precedent for Decision D (meaning D was informed by looking at C) [50]. These links explicitly encode the “why” trail. In data settings, lineage links (like Table X -> Dashboard Y) are similar, but context graphs may extend them to non-technical domains: e.g., “Incident 123 triggered Policy Exception #456”. Capturing these as graph edges lets you do a “why path query” — traversing from an outcome back through all contributing factors. In Neo4j’s example, they show how a sequence of
(:Decision)-[:CAUSED]->(:Decision)edges can chain, and how trivial it is to query a multi-hop causal chain with Cypher, versus how hard it would be in SQL [51], [52]. The presence of such edges is a key differentiator of context graphs: you can literally traverse cause and effect. - Time attributes on nodes or edges: To represent temporal context, one common approach is to include
valid_from/valid_toor similar properties on edges and nodes. Some context graphs use specialized time-indexed edge types or even separate timeline nodes. The goal is to support queries like “as of date X, what was the status/policy/etc.?” or “show me the history of changes to this entity’s context.” In property graphs, this might be handled via properties; in RDF, via named graphs or time predicates. We’ll discuss detailed temporal modeling later, but suffice it to say the data model must handle time versioning. For example, aDecisionContextnode might snapshot the state (important fields from various systems) at the moment of decision [45]. This means storing historical values of those fields which normally a production DB might not keep after update. Alternatively, edges themselves can have times: e.g., an edge(:Person)-[:EMPLOYED_AT {from:2018, to:2022}]->(:Company). - Confidence or quality scores: Some context graphs, especially ones aimed at reducing AI hallucination, attach confidence levels to facts. For instance, TrustGraph’s model includes a
confidenceScoreand a list of sources on a context subgraph [53], [54]. So a relationship might carryconfidence=0.9meaning the system believes it’s quite certain (maybe backed by multiple sources). This kind of metadata can be crucial when an AI uses the graph: you might enforce that the AI only trusts edges with confidence above a threshold, or prefers answers that have multiple independent sources (which the graph can show). In an enterprise context graph, you might have data quality scores for datasets, or a trust level for each source (e.g., data from a certified system vs. from a user input).
To make this concrete, let’s imagine a minimal context graph schema in an enterprise setting:
- Entities:
Person,Account,Ticket,Product(typical business entities). - Decision/Event:
Decision(a decision event, e.g. “Approved credit increase”), possiblyIncident(for a technical incident event),WorkflowRun(an agent run instance). - Contextual:
Policy(business rule definition),ObjectiveorMetric(to link decisions to KPIs),TeamorDepartment. - Evidence:
Document(which could be a policy document, email, Slack message), or anAlertrecord. - Relationships:
- Entity-entity:
(:Person)-[:OWNS]->(:Account),(:Account)-[:HAS_TICKET]->(:Ticket). - Entity-event:
(:Ticket)-[:RESOLVED_BY]->(:Decision)(the decision that resolved the ticket),(:Decision)-[:AFFECTS]->(:Account)or[:ABOUT]->linking decision to the thing it concerns [44]. - Decision-policy:
(:Decision)-[:UNDER_POLICY]->(:Policy)(the decision was made under the guidelines of Policy X) [44]. - Decision-exception:
(:Decision)-[:OVERRode_POLICY]->(:Policy)if a policy was overridden. - Decision-evidence:
(:Decision)-[:SUPPORTED_BY]->(:Document)(some evidence document) [44]. - Decision-person:
(:Decision)-[:APPROVED_BY]->(:Person)(if a human approved it). - Temporal linking: if needed, an edge to a
DecisionContextnode that captures the snapshot at that time, or simply attributes on the Decision node for time. - Causal:
(:Decision)-[:PRECEDENT_FOR]->(:Decision)linking earlier decisions to later ones [50];(:Decision)-[:CAUSED]->(:Incident)(if a decision triggers an incident or vice versa). - Governance:
(:Person)-[:ROLE]->(:Team)and(:Policy)-[:OWNER]->(:Team)to manage responsibilities, etc.
Visually, one can imagine a layered architecture: 1. Sources Layer: various systems (CRM, databases, Slack, etc.) emit data. 2. Ingestion & Extraction: pipelines convert relevant pieces (entities, events) from those systems into nodes/edges in the graph. For example, a new support ticket triggers creating a Ticket node and linking to the Customer’s Person node; when the ticket is resolved by an agent, we create a Decision node with the outcome and link it accordingly. 3. Graph Store: a graph database or RDF store holds the context graph – this is the core storage where all those nodes and edges live. 4. Retrieval & Query Layer: services or APIs that answer questions by querying the graph (using graph queries like Cypher, Gremlin, SPARQL, etc.). This layer might implement GraphRAG, where given a user query, it finds a relevant subgraph. 5. AI/Agent Layer: the LLM or agent consumes the retrieved subgraph as context, either via prompt (textual serialization of the subgraph with citations) or via a tool interface where the agent can query the graph live. 6. Feedback Loop: any new decisions or user feedback from the AI’s actions are fed back into the graph (updating nodes, adding new precedent links, etc.), keeping it a living knowledge base.
flowchart LR
 subgraph Sources
 S1[CRM & Databases] -->|data| I
 S2[Logs & Tickets] -->|events| I
 S3[Docs & Slack] -->|messages| I
 end
 subgraph Ingestion
 I[Extract & Transform] --> G[(Context Graph DB)]
 end
 G -->|graph query| Q[Graph Retrieval Service]
 Q -->|context subgraph| LLM[LLM/Agent]
 LLM -->|decision trace| G
Figure: Simplified context graph architecture. Sources feed into the graph; the graph is queried to provide context to AI; AI’s actions produce new traces that update the graph.
Within the graph store, you might also conceptually separate layers: e.g., a semantic layer (ontology), an operational layer (lineage, events), and a governance layer (policies, ownership) all interconnected. In practice, it’s one unified graph, but architects sometimes ensure different concern areas can be segmented or filtered (for example, you might retrieve a subgraph that includes all semantic relationships plus relevant policy nodes but exclude some internal technical lineage if not needed for a query).
To illustrate content, here’s a tiny example of graph data in a property graph style:
- Node:
Ticket(id="T100", issue="Late delivery") - Node:
Customer(id="C1", name="Acme Corp") - Node:
Decision(id="D77", action="Compensate with 20% discount", decided_at="2025-07-01T10:00Z") - Node:
Policy(id="RefundPolicy", version="3.2", rule="Max 10% without VP approval") - Node:
Evidence(id="E45", type="Email", snippet="Customer mentioned urgent project...") - Relationships:
(Customer C1) -[:RAISED]-> (Ticket T100)(Ticket T100) -[:RESOLVED_BY]-> (Decision D77)(Decision D77) -[:APPLIED_POLICY]-> (Policy RefundPolicy)(Decision D77) -[:SUPPORTED_BY]-> (Evidence E45)(Decision D77) -[:APPROVED_BY]-> (Person VP_Jones)(assuming a Person node for the VP)- If VP approval was required, maybe also
(Decision D77) -[:EXCEPTION]-> (Policy RefundPolicy)to mark that the policy’s normal rule was excepted.
With such a graph, you can start to query things like: “Why was Ticket 100 resolved with a 20% discount?” and traverse: Ticket -> Decision (20% discount) -> Policy (says max 10% normally) and see that it was approved by VP_Jones, along with evidence that customer had urgent need (from the email evidence). This is exactly the kind of question context graphs are meant to answer, which a normal system would struggle with unless one manually pieces together logs, emails, and policy docs.
We’ll delve more into specific modeling choices (RDF vs property graph) and how to represent time and provenance in upcoming sections. But the key point here is: a context graph is a unified, graph-shaped catalog of all the “stuff that provides context” in your domain — from the master data entities to the ephemeral events, all linked. By making context explicit and linkable, we create the substrate on which more intelligent retrieval and reasoning can happen.
What a Context Graph is Not
Before we proceed to benefits and implementation, it’s worth drawing clear lines between context graphs and some related concepts. Context graphs incorporate ideas from knowledge graphs, databases, logs, and catalogs — but they are not simply replacements for them. In this chapter, we compare and contrast to dispel confusion and highlight when you need more than these alternatives.
4.1 Context Graph vs. Knowledge Graph
A knowledge graph (KG) typically models entities (things) and their relationships in a domain, focusing on defining common vocabulary and factual connections. Think of a KG as capturing “what things are and how they’re semantically related.” For example, a knowledge graph for a retail company might know that Customer Alice is related to Order #123 via a PLACED_ORDER relationship, and that Product XYZ is in Category “Electronics”. Knowledge graphs excel at representing static or slowly-changing knowledge and enabling semantic queries: “Find customers who bought products in category Electronics.” They often have an ontology or schema (customers, orders, categories, etc.) and may integrate data from many sources into a consistent format. Importantly, KGs usually lack the notion of time or context of the triples — a fact is either in the graph or not, as an eternal truth (unless you build a temporal KG extension) [55].
A context graph, while building on KG principles, is oriented toward capturing the operational context and runtime state around those entities. It’s not limited to the timeless facts; it brings in the situational metadata: who owns the data, when was it last updated, what policy applies to it, what recent events are linked to it. One practitioner put it succinctly: “Context graphs aim to build on knowledge graphs by adding a contextual dimension, often through quadruples or reified relationships, to capture provenance, temporal validity, authorizations and exceptions alongside factual relationships.” [10] In other words, a context graph encodes not just “Alice placed Order123” but “Alice placed Order123 on 2023–11–01 under a special discount exception approved by Bob; the order amount was later adjusted.”
Another way to see it: a context graph includes a knowledge graph as a subset (the part describing semantic relationships), but extends it with an event/metadata layer. Traditional KGs answer semantic questions (“what is X related to?”) while context graphs answer operational questions (“what happened to X, when, and why?”) in addition [14], [11]. Concretely, a knowledge graph node for Dataset A might link to Dataset B by a derivedFrom relationship (lineage). A context graph would have that plus nodes for the jobs or transformations that ran, policy nodes indicating if Dataset A is certified or personal data, etc., all connected.
It’s worth noting that many knowledge graph projects bump into the need for context eventually. For example, the Google Knowledge Graph initially held static facts about entities. Over time, they needed to represent facts that change (CEO of X) and attribution (source of info). Rather than scrapping the triple model, they introduced notions of qualifiers. In enterprise settings, people sometimes start with a knowledge graph (for master data or glossary) and then realize they need to plug in the operational data (like usage stats, quality metrics, etc.). That’s essentially evolving toward a context graph.
Does a context graph replace a knowledge graph? No — think of it as knowledge graph++. If you have no existing KG, you can still build a context graph from scratch, but you will end up creating something that contains knowledge graph elements (entities, taxonomy) anyway. If you do have a KG, a context graph initiative will likely integrate with it, not throw it away. For example, the context graph might reuse the entity definitions from the KG but enrich them with new node types for events and new edges for context. From a usage perspective: knowledge graphs are often used for things like entity search, recommendation, semantic reasoning. Context graphs are used for lineage queries, “why” questions, compliance checks, and feeding context to AI. There is overlap — e.g., both can be used in question answering (KGQA vs. using context graph for retrieval) — and indeed some research shows combining them yields better results [7].
To summarize:
- Knowledge Graph: Emphasizes canonical facts and ontologies (great for semantic consistency, integration of data silos, static reasoning).
- Context Graph: Emphasizes contextual metadata (great for dynamic reasoning, operational decision support, AI grounding) [1], [16].
- Overlap: Both are graphs of nodes/edges that can be queried with graph languages; a context graph often uses the knowledge graph as its backbone of entities.
One might say a context graph “knows about the knowledge” — it contains knowledge and knowledge about how that knowledge was used and evolved. In this light, context graphs are not in competition with knowledge graphs; they are the next stage for organizations whose initial knowledge graphs aren’t meeting the needs of AI applications that demand more context.
4.2 Context Graph vs. Graph Database
It’s important to distinguish the concept of a context graph from the technology used to implement it. A graph database is a storage and query engine optimized for graph-structured data (e.g., Neo4j, TigerGraph, Amazon Neptune, etc.). Graph databases store nodes and edges and let you query them efficiently with graph query languages.
A context graph is an information model or dataset. It’s the collection of interconnected context information. You could theoretically store a context graph in various ways: a graph database (property graph model), an RDF triple store, even in relational tables (though that gets very unwieldy for deeply connected data). Using a graph database is a natural choice to implement a context graph because of the graph’s highly connected nature and need for multi-hop traversal performance [24], [56]. But it’s not the only way. For example, one could use an SQL database with recursive CTEs to store a simple context lineage, but it would struggle as the complexity grows (as Neo4j’s blog points out, recursive self-joins blow up for deep chains [51], [57]). Some have even built context graphs on top of search indexes or document stores by encoding graph relationships in documents — workable for small scale or specific query patterns, but again not ideal.
The key distinction: “Graph database” refers to the infrastructure, while “context graph” refers to the content (a particular graph data model capturing context). A helpful analogy: a graph database is like a blank spreadsheet, whereas a context graph is like a specific financial model built in that spreadsheet. The graph DB doesn’t care if your nodes are customers or proteins or network devices — it’s generic. A context graph has a purposeful schema and meaning designed for context in AI systems.
Why does this matter? One reason is to avoid vendor or tool confusion. When someone says “we need a context graph,” they do not necessarily mean “go buy a new graph database.” You might already have a graph DB (for your knowledge graph) that can host the context graph too. Or you might use an existing data warehouse and add a graph query engine layer. However, often the introduction of a context graph in an enterprise does come with evaluating graph database options, because many organizations hadn’t invested in graph tech before. Conversely, just adopting a graph database doesn’t give you a context graph — you still have to model and load the context data and integrate it. It’s possible to have a graph database with a pure knowledge graph (no context nodes) or to have one with context graph content.
In summary, a context graph is agnostic to storage technology in concept — it’s a model you can instantiate on various platforms, though graph databases make it more feasible. We’ll map out specific graph database options and their pros/cons in the ecosystem section.
One more nuance: Graph databases can store multiple types of graphs, but sometimes certain features (like native support for edge properties or full-text search, etc.) might influence how you design the context graph. For instance, if using a property graph DB like Neo4j, one might attach timestamps as properties on edges; if using an RDF store, one might represent those as separate triples or named graphs. Those are implementation choices — the concept of the context graph remains the same.
Finally, a context graph is not just any data in a graph database. If you write your company org chart into Neo4j, that’s a graph, but not a context graph per se — it’s missing the decision/event lineage that we’ve been focusing on. So one could say: all context graphs are graphs, but not all graphs are context graphs.
4.3 Context Graph vs. Audit Log
An audit log (or audit trail) is a record of events, typically a chronological log of who did what and when, in an append-only format. Audit logs are crucial for compliance — e.g., recording that User X approved a transaction at time Y. Traditional audit logs are often stored as sequential records (files, log entries, relational tables with timestamp columns). They answer questions like “What actions occurred in this system?” and support after-the-fact investigation.
A context graph, on the other hand, also records events (decisions, actions) — so at first glance you might think “Isn’t it just an audit log in graph form?” The difference is that a context graph records not only the fact that an action occurred, but also the context and relationships around that action. As Neo4j’s William Lyon put it: “Unlike a traditional audit log (which just records actions), a context graph captures the reasoning (why was this decision made?), precedents (what similar decisions came before?), causal chain (what led to this and what it caused), the state of the world at decision time, and the policies applied or overridden.” [11], [12]. An audit log entry for our earlier credit example might simply say: “2025–07–01 10:00:00 — Approved credit increase for Account 123 by user VP_Jones.” A context graph would represent that approval as a node connected to nodes for the Account, the VP_Jones (Person) who approved, the Policy that normally limits credit increases, maybe a node for the request event, plus edges to prior similar requests that it considered. In other words, the context graph is rich and queryable; the audit log is typically flat and linear.
Use cases diverge: Audit logs are for compliance and forensic analysis mostly. You typically query an audit log by filtering by user, date, or action type to see records. A context graph is for operational use by AI and analysts. It’s meant to be traversed to build explanations or to trigger logic. For example, an AI might traverse the graph to find a precedent, whereas it could not easily traverse an audit log because logs don’t explicitly link related events (one could do by correlation IDs at best, which is more manual).
That said, a context graph can serve audit log purposes and beyond. In fact, one benefit of context graphs in enterprise is to provide an explainable audit trail for automated decisions. Instead of just logging “AI approved loan #456 at 3pm”, a context graph can log it and attach all the context the AI used. Then an auditor can later query “why did AI approve this?” and get the graph of inputs rather than a raw text justification that might be incomplete. In essence, the context graph can be seen as a supercharged audit log — auditable by design. Each decision event in the graph carries with it pointers to exactly what was known and considered at the time [58], [59].
One more distinction: Audit logs usually don’t feed back into the operational system beyond compliance; they’re write-only and maybe reviewed by humans occasionally. A context graph is meant to be read and used by algorithms on the fly. It’s actively used as part of the decision-making loop (agents querying it for precedents, etc.). It’s also updated in near-real-time (each decision is added as it happens). In a sense, a context graph is more interactive and analytical, while an audit log is passive and only forensic.
To put it humorously: If a knowledge graph is a map of your data world, and an audit log is a diary of what happened, then a context graph is a diary with a map on each page. It logs the events but with an embedded graph of how everything was connected at that moment.
So you should not think that if you have an audit log you have a context graph. You’re missing the graph relationships. Conversely, if you implement a context graph, you probably satisfy a lot of audit requirements inherently (each decision node is an audit record with richer info). In many regulated domains, that’s a big selling point: e.g., “We can show the regulators exactly why the AI did X, by walking through this graph of linked context”. Traditional audit logs might just show the input and output, whereas a context graph can show the intermediate reasoning chain (without exposing black-box model internals, it shows data context chain).
In short: audit log = list of events; context graph = graph of events and context. The context graph subsumes the audit trail but connects the dots and makes it queryable in ways an audit log cannot easily do.
4.4 Context Graph vs. Data Catalog
A data catalog is a tool or repository that lets an organization keep track of its data assets — typically tables, datasets, reports, streams, etc. Modern data catalogs (like those by Collibra, Alation, or Atlan) store metadata such as schema information, data owners, glossary terms, and data lineage (which datasets feed into which). They are essentially solving the “find, understand, and trust data” problem. Often, under the hood, advanced data catalogs use knowledge graph technology to relate objects (for example, Atlan’s catalog is built on a type of knowledge graph) [60], [15].
So, how is a context graph different? In many respects, a context graph can be seen as an evolution of the data catalog concept to be active and AI-facing. Traditional data catalogs focus on static metadata about datasets: descriptions, owners, tags, lineage graphs of dataflow. A context graph includes those but extends beyond purely data assets into operational context (like actual events, decisions, etc., as we’ve described). One way to phrase it: a context graph is a superset of an active data catalog (one that has lineage, tags, owners) combined with a decision log. One of the seed sources noted: “Modern data catalogs go beyond static inventories, often leveraging a context graph to serve as active platforms that drive business value, compliance, and AI readiness” [15]. This indicates that even companies in the catalog space frame their next-gen product as having a context graph under the hood.
Let’s pinpoint differences:
- A data catalog typically models relationships like “Table A is produced by ETL Job B and used in Dashboard C”. This is usually a DAG of data lineage. A context graph would capture that but also allow multi-hop queries across semantic and operational domains that catalogs historically didn’t. For example, a context graph could answer: “Show all dashboards (BI assets) that would be affected if Policy X changes”, because it can traverse from a Policy node to decisions or data outputs related to that policy, then to the reports that consumed those decisions. A normal data catalog wouldn’t have “Policy X” in it as a node at all (policies live in docs). A context graph brings those into the fold.
- Data catalogs focus on search and discovery (“where is this data, who owns it?”). Context graphs focus on analysis and reasoning (“why is this data this way, should I trust this output for this question?”).
- Most data catalogs are designed for human users (data stewards, analysts) to browse. Context graphs are equally meant for machine consumption (AI agents, automated checks). In effect, context graphs can be queried by algorithms or LLMs to assemble context for answers, whereas data catalogs historically were GUI tools for people (though APIs exist, they’re not typically real-time interrogated in agent workflows).
- Data catalogs usually don’t store dynamic run-time data. They may store metadata about jobs and perhaps some usage stats (like last accessed). But they wouldn’t, for example, log every time an analysis was approved. Context graphs do capture run-time events. So the update frequency is different: catalogs update when schemas change or you add new assets; context graphs update whenever decisions happen, potentially continuously.
- Federation vs integration: Data catalogs often use federation or links — they don’t copy all data, they index metadata and link out to the actual data sources (like a pointer to a table in Snowflake). Context graphs similarly should not duplicate source data wholesale; they often reference source records by ID. However, context graphs might ingest more “snippets” of source data as evidence than a catalog would. For instance, a data catalog might not store any row-level data, but a context graph might store a snippet of a conversation or a summary of an incident because that is relevant context (within policy limits).
- Collaboration and curation: Data catalogs often have human curation (people add descriptions, ratings, etc.). Those are a type of context! A context graph could easily store a “user comment” node attached to a dataset node. Indeed that pushes the catalog into context graph territory. Some modern catalogs advertise “active metadata” — which includes usage stats, quality metrics, etc. All that is essentially context metadata. So the line is blurring. We can say a data catalog enriched with active metadata and integrated with policy and lineage is a form of context graph for the data domain [14].
One shouldn’t replace one with the other; rather, if you have a data catalog, a context graph initiative will likely extend it. For example, if using Atlan as a data catalog, it already models a lot of relationships. Implementing a context graph might mean adding custom metadata types for decisions or connecting your catalog’s lineage graph with your policy management system’s data. In smaller scope, if you don’t have a fancy catalog, building a context graph might yield something that functions as a data catalog too (because you’ll inventory entities and link them).
Another perspective: Data Catalog vs Context Graph = “library catalog” vs “library history + reading guide.” A library catalog tells you where the book is and what it’s about (like a data catalog does for datasets). A context graph tells you “this book was cited by that research, and was last checked out by Alice, and underlines these themes that influenced decision Y.” It’s a richer narrative around the assets.
The takeaway: a context graph does not mean you abandon data catalogs; it means you enrich them and use graph technology in a more real-time, cross-domain way. If someone says “we have a context graph of our data ecosystem,” expect it to look like a highly augmented data catalog with lineage, usage, and possibly decision flows (like approvals for data access) all captured together.
4.5 Do You Have to Move All Data Into the Context Graph?
One common concern: “Context graph sounds great, but does it mean I need to import everything into one graph database? We have tons of data — is this another giant data migration like making a new warehouse?” The good news is no, you typically do not need to move all underlying data into the graph. Context graphs are mostly about metadata and identifiers, not bulk data storage.
Think of the context graph as a graph of pointers and summaries that glue together data from disparate sources. The context graph might hold an entity node for “Customer #123” with key attributes (name, ID) and link it to, say, a Salesforce record ID or a database primary key that points to the full customer record in your CRM. If an AI needs detailed information about that customer (like their transaction history), the context graph can provide the pointer or even a summarized representation (e.g., “Customer 123: 5 years tenure, premium tier”) and if needed a downstream system or an API call can fetch the raw details.
In practice, many context graph implementations use a hybrid approach: they store what is needed for linking and querying relationships, but they do not duplicate large content. For example:
- Documents/Evidence: Instead of storing entire documents in the graph, you might store a reference (like a document ID or URL) and maybe a short excerpt or vector embedding. If the AI needs the document, it can fetch it on demand. The graph just helps discover which document might be relevant.
- Operational data: Large fact tables or log dumps are not shoved into the graph. Rather, roll-ups or relevant slices are. If an agent query needs a specific log entry, maybe the graph stores that single event as a node because it was important, but not every log line. Or the graph stores an “Incident” node that links to an external log index where details can be found.
- Data values: Context graphs often carry metadata rather than the data itself. For instance, a data quality context graph might store that “Dataset X has 5% nulls in column Y” but not the actual rows of Dataset X. Those remain in the source DB.
This approach aligns with how data catalogs and lineage systems work: they keep references and high-level info, not all the data. The context graph should be thought of as an overlay network. The actual systems of record (data warehouse, CRM, ticketing system, etc.) remain the source of truth for detailed data. The context graph pulls together the indices and connective tissue.
In technical terms, you can implement context graph queries that federate to other systems. For example, your context graph could have a node for “Order 1001” and if an agent needs to know line items, it might call the ERP API for Order 1001. Some graph query systems support leaving certain attributes unmapped until query time (like “virtual edges” that invoke an API). This is advanced, but possible. More straightforward: use the graph to narrow down what you need, then use IDs to fetch details in a second step. This is very common in Graph+RAG pipelines: graph returns a set of relevant document IDs, then those docs are retrieved from a document store for final answer synthesis.
Another technique is federation at the query level. There are frameworks (like the W3C’s SPARQL Fed Query, or tools like Presto/Trino with graph connectors) that can treat multiple data sources as one for query purposes. Some vendors (e.g., Diffbot, as one example in web domain) create a contextual KG by linking out to original sources via IDs. We won’t dive deep here, but know that you don’t have to create one monster repository of everything.
However, you will likely have to ingest a lot of metadata. If you want a comprehensive context graph, you need connectors to each relevant system to pull the metadata out (like the fact that Ticket #567 exists and is linked to Customer #123, etc.). But these are usually lightweight (IDs, statuses, timestamps, rather than entire BLOBs).
An illustrative practice: Atlan’s “active metadata” approach essentially builds a context layer without moving the underlying data — it connects to sources, pulls necessary metadata (schema, lineage, usage), and allows linking to business context. Context graphs extend that with possibly more event data, but the philosophy is similar.
Finally, consider performance and privacy. If some data is very sensitive, you might not even want it copied into the context graph store; better to leave it at source and only reference it. Also, copying huge volumes could make your graph slow or costly. Instead, store the graphy part — the connections and references — which is typically much smaller than raw data. One TrustGraph discussion thread noted that you can have a massive single graph with billions of nodes, but logically partition via metadata like “collection” tags and retrieve just subgraphs per need [61]. That implies the graph can scale by not pulling everything into memory at once, only relevant parts.
Conclusion: The context graph is primarily a metadata and context index. You don’t ingest entire tables of raw transactions into it (unless you specifically need those as nodes, but even then maybe aggregated). Instead, you ingest the existence of those transactions, their IDs, and link to related context. The graph is an abstraction layer linking data silos.
One might ask: what about vector embeddings and such — do they go in the context graph or separate? Many architectures keep vector indexes separate (like a Pinecone or Elasticsearch store) and store just keys in the graph. But you could store vectors as properties on nodes if your graph DB supports it (some do). We’ll cover hybrid search later.
In summary, you do not have to “move all data into the graph” in a literal sense. You do have to represent all relevant entities and events in the graph, but those are lightweight references enriched with metadata, not full data dumps. This alleviates the fear that adopting a context graph means rewriting your entire data architecture. Instead, you’ll augment it with an interconnecting layer — the context graph can be thought of as “graph as metadata and evidence map” that sits above your primary data stores.
Time, Provenance, and “Truth over Time”
Handling time and provenance is a central challenge (and feature) of context graphs. Unlike static knowledge bases, context graphs are concerned with how truth changes over time and where information comes from. In this section, we delve into representing time (temporal context) and provenance (origin/lineage of information) in a context graph, and why they are critical for trust and audit.
Time Dimensions: Valid Time vs. Decision/Transaction Time
There are two common time axes to consider:
- Valid Time (or Effective Time): When a fact or state is true in the real world. For example, if Alice was CEO of X Corp from 2018 to 2020, that fact has a valid time interval [2018, 2020]. If a policy version was effective starting Jan 1, 2023, then before that date, that policy shouldn’t be considered. Valid time is about the temporal context of the data itself.
- Transaction Time (or Decision Time / Logging Time): When the fact was recorded in the system or when an event (like a decision) took place in the system. For instance, a decision node might have a timestamp of when the decision was made (that’s like a transaction time for that piece of context). If data is updated, transaction time tracks when the system came to know the new value.
In temporal database theory, these two together give bitemporal data. Context graphs often need bitemporal handling: you want to be able to ask “At 5pm yesterday (transaction time), what did we believe was the customer’s address as of last month (valid time)?” That’s a complex query but important in auditing scenarios.
Valid time in context graphs: Many context graph use cases revolve around “truth over time.” For example, an agent might need to know the historical trend of a metric to make a decision, or whether a piece of information was up-to-date at a certain time of a decision. Representing valid time can be done by:
- Adding date attributes to nodes/edges (e.g.,
valid_from,valid_toproperties). - Creating event nodes for changes (like a StateChange node linking an entity to a new state value with a timestamp).
- Using a specific temporal graph model or time-indexed edges (some graph DBs support temporal types on edges for querying by time ranges).
A simple example: a context graph for an employee’s role might have an edge (Person Alice)-[:WORKS_AT {from:2018, to:2020}]->(Company X) and then another edge for 2021 onward to Company Y. An LLM querying “Where does Alice work (as of now)?” should use the edge with no end (present). If it asks “Where did Alice work in 2019?”, the context graph can surface Company X by looking at valid time [34], [55].
Decision time in context graphs: Every Decision or Event node inherently has a timestamp (the time the decision was made or event occurred). This is crucial to be able to replay or audit sequences. For example, if an agent made a recommendation at 3:00pm and a human approved it at 3:05pm, those are separate events with times, and if the policy changed at 3:02pm in between (ouch!), you’d want to detect that misalignment. By capturing the time on each node and possibly version of policy used, you can identify such issues.
Often, context graphs treat decision/event nodes as immutable records with a timestamp — that’s their identity. If something changes (like a decision revoked), that would likely be a new event (Revocation event) rather than altering the original node.
Time-travel queries: A powerful outcome of modeling time is you can support time-travel queries: asking the graph a question as of a past time. E.g., “what was the context graph state as of 2025–01–01?” to simulate what an agent knew at that time. Not all implementations fully support this easily, but conceptually, if every piece has valid and/or transaction time, you could reconstruct state. Some graph databases might allow queries with filters on time attributes to approximate this.
Temporal knowledge graphs: As referenced earlier, temporal KGs are an active research area. They confirm that capturing these time aspects leads to better reasoning because the model can avoid conflating facts from different times [33], [62]. A context graph in enterprise might use a temporal reasoner to, for example, automatically expire certain edges when out of date. Or to incorporate “window of validity” for compliance (e.g., data retention policies might say PII evidence older than 1 year must be purged — a context graph can facilitate identifying that via timestamps).
One challenge: ensuring that updates to the graph maintain these histories. You might append new edges instead of modifying existing ones to keep old context. That leads to growth in size, but it’s necessary for full audit trails.
In implementation terms, some specialized systems or libraries exist for bitemporal graphs (e.g., a paper on “Bitemporal Property Graphs” suggests how to do it [63]). Absent specialized support, you handle it at the data model level (explicit attributes and careful queries).
Provenance Models: Sources and Confidence
Provenance asks: How do we know this? Who/what provided this information? In context graphs, provenance is typically captured in two ways:
- Source Attribution: Each piece of info (node or edge) can be linked to a source. For example, a fact node “Q4 revenue = $1M” might have an edge or property pointing to “Source: Q4_financials.pdf, page 10” or a link to a data warehouse table snapshot ID. Decisions might link to the evidence that was considered (as we discussed as evidence nodes). In RDF/semantic tech, a popular approach is to use the W3C PROV ontology (PROV-O) or similar to express provenance. PROV defines entities, activities, and agents and relations like wasDerivedFrom, wasGeneratedBy, wasAttributedTo. One could map a Decision to a PROV Activity, the evidence documents to PROV Entities, and the approver to a PROV Agent, and use the PROV relations accordingly [64], [65]. Even if you don’t fully adopt PROV, it’s a useful conceptual framework. Many context graphs may implement a simplified provenance: e.g., a property
source_idwith a reference, or an edge like(:Document)-[:SOURCE_FOR]->(:Decision)etc. - Confidence/Quality Indicators: Not all sources are equal. Context graphs might store a confidence score with a piece of data if it’s something predicted or inferred. For example, if an LLM “read” an internal wiki and extracted a fact into the graph, you might label it with
confidence: 0.8. Or if an AI classifier labeled a ticket as high priority, store that with a confidence. When the agent later uses the context, it could be made to verify high confidence or cross-check multiple sources. As TrustGraph’s documentation states, provenance tracking paired with confidence is essential to make facts grounded and verifiable, thereby reducing hallucinations [8], [66].
Multiple sources: A context graph can also represent that a fact was confirmed by multiple sources. In RDF, this could be reification or using named graph per source. In property graphs, one might have multiple :SUPPORTED_BY edges from a node to different evidence nodes. E.g., a node “Policy X allows Y” could have two evidence nodes: one linking to an official PDF and one to an email from legal – indicating two confirmations. If an LLM sees two independent evidences for an answer, that’s stronger than one.
Provenance for decisions: This is crucial for audit. It overlaps with the decision trace concept. Knowing which data points and people influenced a decision is a provenance question for that decision. So context graphs often unify data provenance and decision provenance. For instance, if a dashboard value was used to make a decision, you have both data lineage (how the number was computed) and decision lineage (how the number was used in context). Combining PROV for data and capturing references in decision nodes can achieve this.
Standards and formats: Beyond PROV, there is Dublin Core for basic source metadata, but PROV is more comprehensive. The PROV model has notions like wasInfluencedBy, which map well to our context use. There’s also Prov-JSON or other serializations if one wanted to export.
Quality signals: Under provenance we can include things like data quality or recency as part of the “source trust.” A context graph might have a subgraph for data quality metrics. E.g., attach a Score node to a Dataset node that says “freshness: 98% (updated 1 day ago)” [67]. If an agent is retrieving info from that dataset, it could see freshness. This is an example of context that prevents hallucination — the agent might decline to give a number from a dataset that’s stale beyond a threshold, citing that as context.
Why provenance reduces hallucinations: Because if an LLM is forced to output not just an answer, but also the path of evidence from the context graph, any gap in that path would reveal a hallucination. Essentially, provenance constraints force the model to ground its answers. For example, when using a context graph, you might instruct the LLM: “Use only facts that have a SOURCE node attached with verified=true. And output the chain of source references.” If it tries to make something up not in the graph, either the chain will be incomplete or it will have to fetch something (which it can’t if not there). This acts as a check. Some systems even do a post-hoc check: the LLM’s answer is parsed for references, and the system verifies those references actually support the answer (graph structure makes that easier by having relationships already linking evidence to claims) [68], [69].
Provenance and audit: In compliance, you need to demonstrate not just what decision was made, but based on what authority or data. A context graph with provenance can show, for instance: “We approved this loan because the customer’s risk score was 4 (source: RiskModel v2) and policy says approve if <5 (source: LendingPolicy doc) and a manager override was documented in ticket 789 (source: Jira).” This is golden for audit — it’s a clear chain of reasoning with external references.
To manage provenance well:
- Design your graph schema to carry source links for key nodes/edges (or group nodes inside a “named graph” per source if RDF).
- Ingest source identifiers and keep them consistent (like using stable IDs for documents).
- Possibly include a type hierarchy for sources (distinguish “official_policy_doc” vs “user_comment” as different source types with different default trust levels).
- Implement queries or subgraph assembly that include provenance by default. For example, when retrieving an answer, always pull the source nodes and attach them in the answer packet for the LLM to cite.
How Provenance Supports Audit and Reduces Hallucinations
We’ve hinted at these, but let’s summarize explicitly:
- Audit and Compliance: With full provenance in a context graph, an auditor can start at a decision and traverse backwards: Decision -> which data points used (and their sources) -> which policy used (and its source or version) -> who approved -> etc. This lineage of decision is exactly what regulators want to see for AI decisions in finance, healthcare, etc. Without a context graph, you might have to compile logs, emails, and DB dumps for an audit query. With it, it’s a matter of running a graph query for the relevant subgraph [58], [59]. It also helps internally: teams can debug why an AI did something weird by examining if it had wrong or missing context. If missing, you see a broken link (maybe no evidence node where one should be).
- Hallucination Reduction: Hallucination (AI making up facts) is curbed by grounding the AI in the context graph which is populated only with vetted info. If the AI tries to stray, either the info isn’t in the graph (and the agent framework will either not allow it or will flag it) or it will produce output with no evidence, which can be caught. Graph-based retrieval can also incorporate validation steps: e.g., an answer produced by LLM can be checked against the graph structure. Microsoft’s GraphRAG research mentions validating LLM responses against the graph to detect hallucinations [68], [69]. For example, if the LLM says “Alice Johnson is CEO of TechCorp since 2020 [70], [71]” but the graph shows Alice’s node connected to TechCorp with since=2015, one can flag the discrepancy. This sort of automatic consistency check is possible with a structured context that plain text RAG can’t do easily.
- Confidence gating: You can set rules like “the AI should only answer if it finds a context subgraph with sources whose confidence >= X, otherwise say ‘I don’t know’ or escalate.” That directly cuts off a lot of hallucination because many hallucinations arise when the model is unsure but tries to answer anyway. With context graphs, you impose an external sense of confidence. For instance, an agent might not answer a question about a metric if the graph has a data quality node indicating the metric is stale or unreliable.
- Prevention of context omission: An AI might omit a crucial factor if it’s not reminded. A context graph can proactively feed in all relevant connected nodes (including relevant policies or exceptions that a plain vector search might miss if not mentioned explicitly in the query). This helps prevent a hallucination of knowledge — e.g., the AI failing to recall an exception and giving a generic answer that’s wrong for this case. If the context graph is properly queried (like expanding k-hop neighborhood around an entity of interest, including any special case nodes), the AI is less likely to “forget” that an exception applies, because the exception node will be in its context input.
- User trust and verification: When AI answers can include citations to actual nodes/evidence that a user can verify (like “According to Incident #1234 and Policy v3.2 (see attached snippet)…”), users develop trust. They can click and inspect sources. This addresses the “black box” issue of AI by effectively showing the chain-of-thought in terms of external knowledge. It’s no longer just the model’s hidden weights, it’s saying “here are the pieces I used, you can check them.” Psychologically and practically, that reduces the impact of any hallucination that might still occur because it’s easier to spot (no evidence).

Mapping to Standards/Models
To tie in with known standards:
- The W3C PROV model can be adopted within a context graph to formalize provenance. For example, a Decision node can have edges:
wasInformedBy -> Evidence1,wasInformedBy -> Evidence2; an edgewasAssociatedWith -> Agent (the decision-maker), etc. [64], [65]. Many semantic tools can then reason or transform PROV graphs. If you output a PROV-JSON or PROV-XML, it might satisfy certain regulatory reporting. - There are also domain-specific lineage standards, e.g., in data world, OpenLineage or the MARBLE ontology. These often focus on technical lineage (like data pipeline steps). You can incorporate those for the data side, and use PROV for more general context.
- For knowledge graphs, the notion of Named Graphs is helpful for provenance. In RDF, a named graph is basically an ID for a set of triples, which can be used to attach provenance to that set. For instance, all triples that came from Source X can be grouped in a named graph labeled Source X. Then SPARQL can query by source easily. This might be easier than linking each triple individually. In practice, people often use graph name = source or graph name = time slice in academic systems.
To conclude this section: Temporal and provenance context turn a graph into a time-machine with citations. They let you ask not only “what is true?” but “what was true at time T and how do we know it?” — which is immensely powerful for building AI that is trustworthy and for debugging or auditing that AI. The context graph’s ability to maintain truth over time (e.g., capturing the evolving truth rather than a single version) and traceability (linking truth to sources) is arguably its most distinguishing feature compared to prior data management approaches [10], [72].
Why Context Graphs Reduce Hallucinations (and When They Don’t)
One of the touted benefits of context graphs is mitigating the hallucination problem in LLMs. By providing a structured, vetted context, we constrain the model to stick to known information. Let’s break down how context graphs help reduce hallucinations, and also discuss the scenarios where they might not help or could even introduce new failure modes if not managed carefully.
Grounding via evidence paths and provenance: As discussed, a well-implemented context graph forces the AI to ground its outputs in actual data or records. For example, a Graph-RAG pipeline might retrieve a subgraph of facts and require the LLM to base its answer solely on that subgraph (perhaps by serializing the subgraph as text with citations). Compared to plain text RAG, the graph’s edges provide explicit relationships that make the context more meaningful. Instead of a bag of retrieved passages, the LLM gets a structured set of facts like “Alice Johnson → CEO → TechCorp (since 2020)” [73], [74] and “Source: LinkedIn profile; confidence 0.95” attached. This reduces the chance of the model free-associating some unrelated content. Empirically, structured retrieval (like graphs) has been shown to increase factual accuracy of LLM responses [7], [68]. The model effectively has less ambiguity: the graph context is concise and unambiguous, leaving less room for the model’s imagination to fill gaps incorrectly. It’s like giving it a mini database to read from instead of a fuzzy memory.
Citations as a check: When the model is asked to output not just an answer but also the supporting context (citations or evidence chains), it has to “show its work.” This tends to reduce hallucination because if the chain isn’t there, the model either stalls or fabricates a chain (which can be detected). Requiring evidence for each claim is a known method to improve factuality — context graphs make it easier by having evidence links readily available. Some systems even do automatic citation insertion by mapping tokens to source nodes.
Constraining answer space via graph traversal: Graph queries can narrow down possibilities before the LLM is invoked. For instance, if the question is “What are the top risks for Project X?” a context graph retrieval might first fetch the subgraph of all risk-related info for Project X (maybe nodes of type Risk linked to that project, sorted by score). The LLM then just summarizes that subgraph. Without the graph, the LLM might try to recall generic risk items or confuse Project X with something else. The graph acts as a hard filter: only relevant facts get through. Therefore, any hallucination would have to somehow come from misinterpreting those facts, not from pulling in external knowledge, which is less likely. Essentially, context graphs can integrate symbolic reasoning with the LLM’s subsymbolic reasoning, giving more precise guidance.
However, context graphs are not a panacea. Let’s examine when they don’t reduce hallucinations or could even lead to new kinds of errors:
- Stale or incorrect context: The graph is only as good as the data it contains. If the context graph has an outdated fact (e.g., an employee’s title that changed), the LLM will faithfully use that — producing what we might call a context-grounded hallucination, which is arguably not the model’s fault but still an incorrect output. In some ways, this is worse: the model might confidently answer with a citation to the context graph data, but if that data is wrong, the result is wrong yet looks credible (it’s not a hallucination in the classical sense, but from a user perspective it’s misinformation). For example, if Policy v3.1 is in the graph but we’re actually on v3.2 which changed a rule, the agent might give advice based on the old policy, with citation. Ensuring the context graph stays updated (“single source of truth”) is crucial to avoid this “garbage in, garbage out” problem. Staleness is a big challenge especially if the graph is not automatically syncing with sources.
- Missing context (knowledge gaps): If relevant context isn’t in the graph, the LLM might either say “I don’t have info” (if it’s designed conservatively) or might revert to general knowledge (which can result in hallucination). For example, an agent asked “What is the escalation process for a severity-1 incident in our org?” might need a specific internal runbook. If the context graph doesn’t have that (and just has generic ITIL processes maybe), the model might make up steps. This highlights the importance of coverage — context graphs reduce hallucination only in so far as they cover the needed domain context. If something is omitted, the AI is back to guessing or using its training data (which could be wrong or not apply to this company).
- “Precedent poisoning”: Using precedent decisions is powerful, but what if a precedent was a mistake? Humans sometimes make errors or exceptions that shouldn’t be repeated. If the context graph naively encourages reusing every precedent, an AI might propagate a one-time bad decision as standard practice. For instance, one support agent once gave an arbitrary 50% refund against policy as a personal judgment call. If that ended up in the context graph as a precedent and the AI treats it as a pattern, it might start giving 50% refunds too broadly — essentially learning the wrong lesson. This is akin to a model being misled by bad training data, except here the “training data” is the context graph. Mitigation is to tag such exceptions clearly or require human approval for outlier precedents, etc. (We might call this scenario not exactly hallucination, but a failure mode — “context-induced bias or error”).
- Over-trusting weak sources: If the graph includes some low-quality source marked as such, does the AI know to discount it? Suppose some knowledge came from a user’s conjecture in a Slack message (which got ingested as an Evidence node perhaps labeled with low confidence). A disciplined approach would have the retrieval or the prompt explicitly surface the confidence and caution the model. But if done poorly, the model might treat it like any other fact. It might say “According to Slack thread, X is true” when that Slack thread was just water-cooler talk. So hallucination can occur in the sense of giving undue weight to an unreliable piece of context. The solution is designing retrieval to prioritize high-quality provenance (perhaps filter out anything below certain confidence unless nothing else exists) [75], [76]. This is an area for careful tuning — the graph needs to carry meta-labels like “unverified” and the agent logic needs to handle them.
- Interpretation mistakes: The LLM could misinterpret the context graph if the encoding is not clear. For example, if it reads “Alice Johnson → CEO → TechCorp (since 2020)” and “Alice Johnson → previous_role → VP at StartupX”, it might hallucinate that “Alice was CEO of StartupX” if it confuses roles. Generally, graphs reduce such confusion compared to raw text, but it depends how the context is presented to the model. If you just dump triples in text, format matters. The good practice is to either fine-tune or few-shot the model on reading graph-structured context or use a structured approach (e.g., the model could be an agent that can execute Cypher queries rather than ingesting raw triples — which ensures precise usage).
- Edge cases and novel situations: If something truly new comes up that isn’t in the context graph (a scenario that hasn’t happened before in the company), the LLM might have to generalize. It could hallucinate reasoning or outcomes because by definition no context covers it. Context graphs help with known unknowns (documented exceptions) but not unknown unknowns. For truly novel queries, the AI is in uncharted territory. At that point, if it can’t find context, ideally it should escalate or say “I don’t have info” rather than hallucinate. Designing that behavior is key (like a fall-back when context graph returns an empty subgraph: perhaps instruct the agent to not answer definitively or ask for human input). The temptation of an LLM is to always produce an answer; a robust system should override that when context is lacking.
Controls to mitigate these failure modes:
- Provenance requirements: For instance, configure the agent such that it will not answer with factual claims unless it finds at least one high-quality source node supporting it. And require it to output the source. If it can’t, it should either refuse or ask a clarifying question. This reduces hallucination at the cost of sometimes giving fewer answers (better to say “not sure” than hallucinate).
- Confidence thresholds: As mentioned, use confidence scores. Perhaps the retrieval step only passes forward facts above a certain confidence, or the agent is told to treat low-confidence context as merely suggestive. If all available info is low-confidence, maybe the agent warns the user (“There’s limited information, but…”). This handles the “weak source” issue.
- Human approval points: Insert a human-in-the-loop when the context or consequence is critical. For example, if an agent wants to apply a precedent that was an override of policy (a red flag context), maybe route that decision to a human or at least highlight it. Human oversight can catch if the AI is about to use a one-off weird precedent inappropriately. Over time, one could refine which precedents are “blessed” vs. cautionary. This is more of a governance process above the technology.
- Regular audits of the context graph itself: Check the graph for stale or contradictory info. Perhaps use automated checks: e.g., if two different sources in the graph claim different values for the same metric with overlapping valid times, flag it (which one is correct?). Or check if some context nodes should have expired. This could be part of data governance, but now extended to context info. Some inconsistencies might not be auto-resolvable, but at least they can be identified and cleaned, improving the reliability of what the AI sees.
- Retrieval constraints: Use contextual filters. For example, if user is asking about “current policy”, ensure retrieval only pulls the latest version of policy node (maybe by a query that filters by
valid_to = null, meaning still active) so the LLM doesn’t even see outdated ones. Or if multiple entries, label them clearly with dates in the prompt (“Policy v2.1 (2019, obsolete), Policy v3.0 (2022, current)”). That leverages the model’s ability to pick the right one. But safer is to filter out obsolete in retrieval unless specifically asked historically. - Limit open-ended generation: Where possible, have the LLM fill templates or answer specific questions derived from the graph rather than just “generate a free-form answer”. For instance, one approach is to break a user query into sub-queries for the graph, get structured answers, then maybe ask the LLM to compile them. This reduces free-wheeling that leads to hallucination. Graph frameworks like KGLM (Knowledge Graph Language Model) or GraphRAG often do a deterministic retrieval followed by a short generation step mostly constrained by what was retrieved [77], [78].
In essence, context graphs trade unconstrained uncertainty for constrained uncertainty. The LLM no longer has to dredge its entire parametric memory for an answer (reducing one kind of hallucination), but it might trust whatever is in the graph (introducing possible errors if the graph is wrong). We thus shift the problem to maintaining the graph (a more tractable, controllable problem usually).
One should also remain aware: an LLM can hallucinate logical connections too, not just facts. E.g., it might see correct context facts but draw a wrong conclusion or causal inference that’s not actually guaranteed. Graphs can help here by explicitly modeling causality (like linking decisions with caused edges rather than leaving the model to infer causation). But still, if asked for an explanation, the LLM might add flavor like “due to high risk, policy was overridden” which might or might not be true reasoning. Ensuring that the agent only uses allowed reasoning patterns (maybe even verifying certain logic steps against the graph) is an advanced area (some research on “faithful chain-of-thought with graphs” touches this). For now, reducing factual hallucinations is a big win; we should remain vigilant that explanatory hallucinations (plausible-sounding but incorrect rationales) can still occur. Context graphs by making cause/effect explicit help mitigate this as well — the model doesn’t have to invent a cause if a :CAUSED edge is present linking events.
Real-world example: One early context graph deployment (anonymized scenario) at a customer support center found that after building a context graph of common issues and resolutions, the assistive agent stopped hallucinating non-existent troubleshooting steps. Before, the LLM would sometimes “improvise” a step that sounded good but wasn’t in the official process. After, because the context graph explicitly linked each issue type to a set of approved resolution steps (as nodes), the AI stuck to those. However, they noticed a new issue: if an issue was genuinely new (no node in graph), the AI would either say “I can’t find a solution” (which is safe) or sometimes fall back to generic suggestions (which could be wasteful or irrelevant). The mitigation was to detect when an issue node is missing and escalate to a human immediately, also logging that gap so the graph can be updated with a new node if needed. This real story highlights both the benefit (no more made-up steps) and the challenge (needing a process for out-of-graph queries).
In summary, context graphs significantly raise the floor of LLM reliability by anchoring them to factual, contextual data. They reduce classic hallucinations (inventing facts) and enable traceable outputs. But they do not eliminate all error modes; careful governance of the graph content and cautious agent design are required to avoid context-related failures like outdated info or misuse of edge-case precedents. We now see hallucination as not just a model flaw but a data governance issue — controllable with good data practices, which is a much healthier position to be in.
Retrieval for LLMs and Agents: Graph-RAG and Hybrid Patterns
One of the most practical aspects of using context graphs is how they integrate into retrieval pipelines for LLMs. The buzzword Graph-RAG (Graphs + Retrieval-Augmented Generation) captures an approach where a knowledge graph/context graph is used as part of the retrieval mechanism to feed relevant information to an LLM at query time [77], [79]. In this section, we break down how Graph-RAG works, how it compares to traditional RAG, and how it coexists with vector search. We’ll outline typical pipeline patterns, including hybrid strategies that use vectors and graphs together, and we’ll illustrate how constraints (like security or policy rules) can be embedded into retrieval.
7.1 Context Graph vs. Graph-RAG (Model vs. Retrieval Technique)
First, let’s clarify terms:
- A context graph (as we’ve defined extensively) is a data model — a graph containing contextual information.
- Graph-RAG is a retrieval technique or pipeline that uses graph data (often a context graph or knowledge graph) to augment an LLM’s input.
In simpler terms, the context graph is what you have; Graph-RAG is how you use it when querying with an LLM.
Traditional RAG (Retrieval-Augmented Generation): This usually refers to using a vector store or search index to find relevant documents/passages given a query, then stuffing those into the LLM prompt so it has up-to-date info to generate the answer. It treats the LLM as a language model that needs facts from outside. Traditional RAG typically deals with unstructured text chunks.
Graph-RAG: extends this by involving graph queries/algorithms in the retrieval loop [80], [81]. Instead of (or in addition to) retrieving top-N text passages by similarity, we might:
- Query the graph for relevant entities or subgraphs based on the question.
- Potentially use the graph structure to find connected information not directly asked for but relevant (like a k-hop expansion).
- Possibly rank or filter the results using graph metrics (like if multiple facts, which are more central or relevant).
- Then present the assembled graph info to the LLM for the final answer synthesis.
So, Graph-RAG is a pipeline combining symbolic and semantic search: It might incorporate:
- Semantic parsing of the question: e.g., extracting entities or relationships asked about, to query the graph.
- Graph query execution: e.g., run a Cypher or SPARQL query on the context graph.
- (Optional) Vector search: The graph might give you an entity ID, which you then use to vector-search related docs for more detail (or vice versa: vector search first to identify a relevant node).
- Ranking/Filtering: Because a graph can produce a lot of connected info, you might then filter down by relevance (some Graph-RAG implementations compute a relevance score for each node, as TrustGraph’s example does [75]).
- Output assembly: Turn the resulting graph subset into a format the LLM can use (textual serialization or a structured data injection if the model supports it).
- LLM generation with context: The LLM generates answer using the provided graph info, often with instructions to cite or refer to the nodes.
In comparison, in pure RAG, it’s typically: embed query -> similarity search -> take top passages -> feed to LLM. Graph-RAG might be: find entity nodes by name -> traverse related nodes -> incorporate any additional search (like neighbor nodes’ text) -> assemble.
To illustrate, consider a knowledge question: “Who leads TechCorp and what’s their background?” In RAG, you’d embed that and hope to find a passage in some docs. In Graph-RAG, as in TrustGraph’s example:
- You identify “TechCorp” as an entity in the KG.
- You run a graph query to get the subgraph around TechCorp: find the “leader” relationship, get the person node, and maybe their background property or related nodes [82], [83].
- You also attach metadata like source and confidence [53].
- The LLM is then prompted with something like: “Alice Johnson is CEO of TechCorp (since 2020). Background: Former VP at StartupX, Stanford MBA [71].” And likely a source footnote.
- The LLM then answers: “TechCorp is led by Alice Johnson, who has a background as a former VP at StartupX and holds an MBA from Stanford.” It might cite the sources as needed.
This pipeline ensures the LLM was informed by structured factual data rather than searching all over for a text snippet. It’s especially powerful for multi-hop queries: If you asked, “Which customers might be affected by Policy 42 change?” a graph approach can find all decisions or processes linked to Policy 42, then find which customer entities those connect to, etc., which would be extremely hard for plain keyword or vector search to do (they wouldn’t necessarily know what to look for unless an exact phrase matches).
So, context graph vs Graph-RAG: The former is the content, the latter is the methodology. You could have a context graph and not use Graph-RAG (for example, you might use the graph for offline analysis but not wire it into LLM queries). Conversely, you could attempt Graph-RAG on an existing KG not built with context in mind. However, they pair naturally: if you invest in a context graph, you likely want to build Graph-RAG pipelines to exploit it.
7.2 Context Graphs and Vector Search (Complements, Not Replacements)
It’s not an either-or between graphs and vectors — they actually complement each other well in many architectures:
- When vectors shine: Vector similarity (embedding-based search) is excellent for unstructured text search, “fuzzy” matching, semantic similarity, and cases where you don’t know exactly what entity you need. For example, if a user query is long and descriptive (“I need to find information on any customer complaints about slow loading of the dashboard after the last release”), there might not be a single entity or edge to start from. But a vector search can retrieve relevant support tickets or incident reports. Once you have those, you might extract some structured signals (like which product or release it’s about) to then use in graph traversal for additional context (like which engineer was on call, etc.).
- When graphs shine: Graph traversal is unbeatable for following relationships and constraints. If you know an anchor (like “Policy 42”), it can systematically find connected nodes (all decisions under that policy, all exceptions to it, etc.) far better than trying to do that via keyword search (where you’d need exact mentions of “Policy 42” everywhere, which may not exist). Graphs also ensure you don’t miss relevant items as long as they are connected, whereas keyword search might miss synonyms or implicit connections.
Hybrid pattern: A common pattern is:
- Vector search for initial retrieval: Use embeddings to find one or more relevant nodes/documents by semantic content. For example, embed the question, search a Pinecone index of all knowledge base docs to get a particular document or even a specific ID (maybe the doc refers to an entity that has an ID).
- Map to graph anchors: Identify entities or nodes from that result. If you got a document about “Project Phoenix” from vector search, and your context graph has a node for Project Phoenix, you now use that as a key.
- Graph neighborhood expansion: Pull in all directly related nodes: e.g., the project’s leader, status, related incidents, team members, etc. Also possibly hop further if needed (like each team member node to any relevant skill or historical project).
- Ranking and filtering: The graph might yield dozens of facts; perhaps use a heuristic to filter out what’s likely irrelevant (maybe filter by type or by a “relevance score” property if any). Or use the question context to filter (if question asks “who” something, maybe filter nodes to Person type).
- Assemble context for LLM: Could be as structured as JSON or as free text bullet points with sources. Provide it to LLM.
- LLM generates answer.
Alternatively, the flow can start with graph then vector:
- If you detect an entity in the question explicitly (“Ticket 500” or “Policy 42”), you start with graph to get the subgraph context.
- Then you notice that one of the edges is “supported_by Document X,” and you want the actual content of Document X. You might then do a vector search within Document X (like find the snippet relevant to the question in that doc) or just retrieve the doc text. Then feed both the structured data and a snippet of unstructured as needed.
Why not only graph or only vector?
- Graphs may not contain all explanatory text needed. They store facts and references, but sometimes the nuance or reasoning might be in natural language in a document. Example: graph says “Incident 123 had cause = network outage.” But maybe the question is “Why did this incident happen?” and you want the descriptive cause. The graph might point to an incident report document where cause is explained in a paragraph. A hybrid approach would get the incident node, then go fetch the cause paragraph from the report via search or direct lookup. The LLM can then combine: (graph says it was a network outage; the incident report says specifically a BGP misconfiguration).
- Vector search doesn’t know relationships. If the question needs joining data from multiple sources, pure vector might give disjoint pieces that the LLM might or might not join correctly. Graph ensures they are connected properly. E.g., “Give me the summary of recent high-severity incidents and who handled them” — vector might find incidents and separate HR pages of who that person is, but the LLM might not connect which person belongs to which incident. A graph can directly traverse
Incident -> handled_by -> Personand bring them as pairs to the LLM.
Real-world example of hybrid: Microsoft’s GraphRAG paper describes using LLM to generate a knowledge graph from text on the fly (like building a graph of people and events from a story) and then using that graph to answer queries more accurately [78], [84]. That’s slightly different (constructing a graph on the fly from unstructured corpora with an LLM’s help), but it shows synergy: the LLM uses vector memory to parse text into a graph, then uses graph to do better reasoning.
Another example: Suppose the user asks a question that the context graph doesn’t directly encode but can be derived. For instance, “How many open high-priority tickets do we have related to Project Phoenix?” If your context graph has nodes for tickets with priority and links to Project, one approach is:
- Use a graph query to actually count:
MATCH (t:Ticket)-[:RELATES_TO]->(:Project {name:"Phoenix"}) WHERE t.priority="High" AND t.status="Open" RETURN count(t). That yields a number which the LLM can directly respond with. No vector search needed. - But if the user asks, “List the open high-priority tickets for Project Phoenix and summarize the latest update on each,” you can:
- Graph query to get those ticket IDs.
- Then for each ticket, maybe vector search in the ticket description or latest comment content for the best summary or relevant line (or retrieve the “latest update” field if it’s structured).
- Combine: LLM gets a list of tickets and maybe a snippet for each from vector retrieval, plus the meta-data (like ticket title, date).
- LLM composes a nice answer.
Constraint-aware retrieval (ACL/policy): Context graphs can help ensure retrieval doesn’t surface unauthorized info. Many vector search solutions struggle with fine-grained permissions; you often have to filter by metadata in the index, which is coarse. In a graph, however, you can encode access rules (like edges indicating classification or user roles). A retrieval pipeline can then enforce: only traverse or return nodes that the user’s role is allowed to see. If user is not allowed to see a certain subgraph (like a node flagged confidential), you exclude it. This is much easier to maintain in a graph since you can propagate permissions along relationships (maybe if a Project node is confidential, all linked tickets are treated as confidential unless marked otherwise). Then, if a query tries to retrieve those, the system can drop them from results or mask them. You might still use vector search for text, but filter out any results whose corresponding graph entities are not permitted. This blending ensures that, say, a Pinecone result for “merger plan” doesn’t return a document if the graph shows that document node is tagged as CFO-only.
Explanation packets (answer + evidence + citations): At the end of retrieval, often what you feed the LLM is not just raw text, but a structured context that already includes evidence and perhaps an outline of an explanation. Some advanced Graph-RAG frameworks have the LLM do multi-step reasoning: first, use the graph to gather info, then reason if more is needed, etc. [85], [86]. But let’s focus on output assembly: You might construct an “answer packet” for the user that includes:
- The answer text (from the LLM).
- A list of evidence items (like the titles or IDs of source documents or graph nodes).
- Citations pointing to them. If your UI can hyperlink to those context graph nodes or docs, even better.
The LLM can be prompted to output a JSON with answer and references, or a markdown with footnotes. But to do that, it needs in the prompt some reference handles (like “[1]” linked to a particular node). Typically, the retrieval pipeline will assign reference tags before passing context into the prompt. For example:
Context:
(1) Incident 123: "Server outage due to misconfig" (Postmortem doc, p.2)
(2) Policy 42: High-sev incident requires VP approval for RCA delay (Policy doc)
User asks: "Why did project Phoenix have downtime last month?"Assistant sees context and might answer:
"Project Phoenix experienced downtime because of a network outage caused by a
BGP misconfiguration【1†】. This high-severity incident triggered Policy 42,
which required a formal review and VP approval as part of the post-incident
process【2†】."Here the 【1†】 and 【2†】 are citations mapping to context items (1) and (2). The retrieval pipeline prepared those context items and gave them that numbering.
This approach yields an answer with clear evidence. The user (or an auditor later) can click those citations to see the underlying source from the context graph (like the incident report or the policy text).
The context graph thus is deeply integrated: it’s not just used invisibly to get the answer; it also becomes part of the answer explanation via citations. That massively boosts credibility and trust.
To ensure a correct mapping, the pipeline typically:
- Has an internal mapping of reference numbers to either a URL or an identifier of the source.
- After LLM generation, it will replace those reference tokens with actual hyperlinks or footnote references in the final Markdown output that the user sees (depending on environment).
In summary for retrieval: Graphs and vectors work together:
- Use graphs for structured recall and relationship following.
- Use vectors for semantic matching and pulling descriptive content.
- Constrain and enrich each other: Graph results can limit vector search space (e.g., search only within documents linked to a specific project), and vector results can suggest graph entry points (finding relevant entities to start a traversal).
- Combined, they can achieve what neither can alone: precise, context-rich, and relevant retrieval that respects meaning even if phrasing differs, and respects structure even if combining multiple pieces.
Graph-RAG is a relatively new pattern, but early evidence suggests it can handle complex queries far better than pure text RAG — especially in enterprise scenarios where relationships are key [24], [14]. Many LLM frameworks are adding graph integration (LangChain has KG toolkit, LlamaIndex has a GraphStore, etc.) to facilitate these patterns. We’ll see examples in the labs.
Now we understand how a context graph feeds into an LLM’s brain. Next, we’ll address choices in modeling that context graph — specifically, the eternal debate of RDF vs. property graph — keeping a pragmatic lens on how to implement our context.
Modeling Choices: RDF/Quads vs. Property Graphs (Pragmatic, Not Ideological)
When building a context graph, you face a technical choice of graph model: use the RDF (Resource Description Framework) family (triples/quads with URIs, ontologies, etc.) or a Property Graph model (like Neo4j, TigerGraph style nodes and relationships with properties). Each approach has strengths and trade-offs, and the decision should be driven by your needs rather than dogma. Here we’ll describe each briefly and compare them in the context of building context graphs.
RDF and OWL (Semantic Graphs): RDF represents data as triples (subject, predicate, object), typically identified by URIs. It has a rich ecosystem of standards:
- RDF Schema and OWL: for defining ontologies (classes, properties, subclasses, domains, ranges, etc.). This is useful if you want to formally define your data model and possibly do inferencing. For example, you could declare that
Decisionis a subclass ofprov:Activity, thathasEvidenceproperty relates a Decision to a Document (with domain and range), etc. A reasoner could then infer new facts (like if A influences B and B influences C, maybe infer A influences C if the ontology says influence is transitive – although one must be careful adding such semantics). - SPARQL: a powerful query language for RDF graphs. It can do complex pattern matching like SQL for graphs. E.g., you can write a SPARQL query: “
SELECT ?decision ?policy WHERE { ?decision a :Decision; :appliedPolicy ?policy; :hasEvidence ?doc . ?doc :source 'XYZ' . }” to find decisions that applied a policy and had evidence from source 'XYZ'. SPARQL is standardized, and if your context graph is in an RDF store, you can query it with any SPARQL engine. - Provenance and named graphs: RDF natively supports adding context to triples via named graphs (essentially quads with a graph name). So you can put all facts asserted by Source X in a named graph “GraphX” and even query SPARQL with
FROM NAMEDto pick sources. The PROV ontology we mentioned is in RDF form, which could integrate seamlessly (e.g., a PROV triple linking an entity to a source). - Interoperability: RDF is designed for interoperability. If you think you might merge data from multiple sources or reuse standard vocabularies (like FOAF for people, PROV for provenance, schema.org, etc.), RDF shines. For instance, you could use
schema:employeeand others might already produce data in that schema, enabling merging. Or you might incorporate an industry ontology for incidents and cause analysis, etc.
Property Graph (PG): This model is what graph databases like Neo4j, JanusGraph, Memgraph, etc., use. Key features:
- Data is stored as nodes and edges that can have arbitrary key-value properties on them. E.g., a
Decisionnode can haveid="D77",timestamp="2025-07-01T10:00Z",outcome="approved". Edges can too (e.g., anAPPLIED_POLICYedge might have aoverridden=trueproperty if the policy was overridden). - Schema optional: You can enforce some schema (Neo4j has a schema for constraints or types if you want, but it’s not as formal as OWL). This is flexible in early development — you can just start throwing in relationships without fully designing an ontology.
- Cypher/Gremlin/GQL: Query languages for PG. Cypher (used by Neo4j) is quite intuitive:
MATCH (d:Decision)-[:APPLIED_POLICY]->(p:Policy) WHERE p.name = "Policy42" RETURN d, p. Many find Cypher easier to learn than SPARQL because it looks like a pattern of nodes and edges drawn out. Gremlin is another (more imperative style) used by Apache TinkerPop and some DBs. The emerging ISO GQL is largely influenced by Cypher. These are not standard across vendors like SPARQL is, but Cypher is widely used and some others support it at least partially. - Performance and tooling: Property graph DBs have been geared towards performance on path queries, graph algorithms, etc., for enterprise use. They may have more mature tooling for certain tasks (like Neo4j’s Graph Data Science library, or built-in full-text indexing, etc.). If doing very heavy multi-hop queries, a specialized graph DB might outperform a general RDF store, though this depends and RDF stores can index well too.
- Developer ergonomics: Some developers prefer PG because you can, for example, directly attach complex objects (like geospatial data or arrays) as properties on nodes, which is not straightforward in RDF (you’d have to break them into triples or use literal encodings). Also, PG typically deals with actual data types (string, int, bool) natively, whereas RDF literals have data types but sometimes you have to be careful to label them and parse accordingly.
- Lack of built-in semantics: PG doesn’t do inference unless you implement it (some graph DBs let you write custom logic or triggers). This means if you want to treat a certain edge type as transitive, you either query it with variable hops or precompute closures. Some might see this as a downside (no automated reasoning), others as a plus (no surprises from unwanted inference, and performance is predictable).
Choosing between them — pragmatic considerations:
- Existing knowledge & ecosystem: If your team or organization already uses a property graph DB (like many do for data lineage or recommendation systems), extending it to context graph might be easier just because of skills and integration. Conversely, if there’s an enterprise ontology team and existing RDF knowledge graphs, piggybacking on that could make sense.
- Integration with other data: If you plan to integrate with Semantic Web standards, publish part of the context graph, or use libraries like SHACL (for graph constraints checking), then RDF is beneficial. For example, SHACL shapes could enforce that every Decision node has a timestamp property and an associated Policy edge, etc. These can act as validations.
- Flexibility vs. consistency: RDF forces you to think in triples, which sometimes makes modeling a bit cumbersome but ensures uniformity. Property graphs can be more direct for certain things (like one node with multiple properties vs many triples). For instance, an Incident with attributes severity, status, description — in Neo4j you just put those properties on the node. In RDF, you either have a bunch of triples (IncidentX :severity “High”; :status “Open”; :description “desc”) or reify them. It’s not hard, just a verbosity difference.
- Query types: SPARQL is very powerful for pattern queries and aggregation, but can be verbose. Cypher might be more straightforward for path queries (“find me a chain of decisions causally connected”) with variable length. Both can do most tasks; sometimes it’s personal or team preference.
Showing the same toy domain in both:
Let’s use a small example domain: Customer, Ticket, Decision, Policy, Evidence — as we discussed.
In RDF (Turtle syntax for brevity):
@prefix ex: <http://example.com/context#>.
@prefix prov: <http://www.w3.org/ns/prov#>.
ex:Cust123 a ex:Customer; ex:name "Alice Corp".
ex:Ticket789 a ex:Ticket; ex:title "Late delivery"; ex:raisedBy ex:Cust123.
ex:Dec456 a ex:Decision; ex:decidedAt "2023-12-01T10:00:00Z"^^xsd:dateTime;
ex:outcome "refund 20%".
ex:Policy99 a ex:Policy; ex:policyName "RefundPolicy"; ex:version "3.2".
ex:EmailDoc5 a ex:Evidence; ex:contentSnippet "Customer mentioned urgent project deadline...".
# Relationships
ex:Ticket789 ex:resolvedBy ex:Dec456.
ex:Dec456 ex:appliedPolicy ex:Policy99;
ex:supportedBy ex:EmailDoc5;
prov:wasAssociatedWith ex:Cust123. # perhaps the decision is associated with that customer (or maybe with an agent)In RDF, typically we’d use blank nodes or URIs for instances, here I’m using simple ex: URIs. We might also add provenance for Evidence content (like ex:EmailDoc5 prov:wasDerivedFrom <mailto:...> if we had a source identifier). We can see it's very triple-y. Every attribute is a triple (ex:policyName, ex:version, etc.). If we query "what decision resolved Ticket789 and what policy did it use?" the SPARQL might be:
SELECT ?dec ?policyName WHERE {
ex:Ticket789 ex:resolvedBy ?dec.
?dec ex:appliedPolicy ?pol.
?pol ex:policyName ?policyName.
}
That yields Dec456 and “RefundPolicy”. If we want the version too, we can get ?pol ex:version.
In Property Graph (Cypher-ish pseudocode or conceptual model):
We would have nodes:
(:Customer {id:"Cust123", name:"Alice Corp"})
(:Ticket {id:"Ticket789", title:"Late delivery"})
(:Decision {id:"Dec456", decidedAt: datetime("2023-12-01T10:00:00"),
outcome:"refund 20%"})
(:Policy {id:"Policy99", policyName:"RefundPolicy", version:"3.2"})
(:Evidence {id:"EmailDoc5", contentSnippet:"Customer mentioned urgent project
deadline..."})
Relationships:
(:Customer "Cust123")-[:RAISED]->(:Ticket "Ticket789")
(:Ticket "Ticket789")-[:RESOLVED_BY]->(:Decision "Dec456")
(:Decision "Dec456")-[:APPLIED_POLICY]->(:Policy "Policy99")
(:Decision "Dec456")-[:SUPPORTED_BY]->(:Evidence "EmailDoc5")
We might also have a relation from Decision to Customer if needed, e.g., (:Decision)-[:FOR_CUSTOMER]->(:Customer) if that context is needed (or derive it via the Ticket relation to Customer). To get the same info with Cypher:
MATCH (ticket:Ticket {id:"Ticket789"})-[:RESOLVED_BY]->(dec:Decision)-
[:APPLIED_POLICY]->(pol:Policy)
RETURN dec.id, pol.policyName, pol.version;
Similarly straightforward.
We see that PG keeps attributes as part of nodes, whereas RDF made them separate triples.
RDF strengths (for context graphs specifically):
- The ability to use established vocabularies for tricky concepts like time and provenance. W3C PROV, as mentioned, or OWL-Time for time intervals, etc. For example, you can represent temporal validity with OWL-Time intervals and attach them to triples via reification or named graphs. This can get complex, but it’s standardized.
- If you foresee knowledge reasoning or integration with external knowledge (maybe linking your context graph to Wikidata for enriching company info, etc.), RDF is a natural fit (since Wikidata is RDF).
- SPARQL can do federated queries across endpoints, so if part of context is elsewhere but SPARQL accessible, you can combine.
Property Graph strengths:
- Many out-of-the-box features in graph DBs: full-text search (Neo4j can index text properties with the Lucene index), graph algorithms (for analyzing communities or central nodes in your context graph, could be interesting e.g. “which decision nodes are most connected as precedents”).
- Easier incremental updates for certain use cases: adding a triple in RDF is fine too, but property graph might allow more direct upsert by ID. However, RDF stores also have upsert capabilities nowadays.
- Developer approachability: Some find JSON-like modeling of PG easier to grok than semantic web concepts. If your team isn’t familiar with RDF, forcing it might slow adoption.
Interoperability vs performance trade-off: If you want to share parts of context graph (maybe to auditors or partners) in a standard format, RDF is beneficial. If it’s mostly internal and you care about optimization, you might lean PG. But note, modern RDF engines (like GraphDB, Jena, Fuseki, etc.) are quite performant too, and some can handle millions of triples easily. For extremely large scale, PG options like Neo4j cluster or Neptune might be robust.
Example of hybrid approach: It’s possible to use both: e.g., store core data in a property graph for operational queries and also export or mirror parts into RDF for compliance or integration. But maintaining two can be overhead.
Recommendation approach: Not ideological means you choose based on context:
- If you need governance standards compliance (maybe regulators prefer an RDF export or you want to use PROV-O out of the box), RDF is appealing.
- If you need fast iterative development and already using tools like Neo4j, property graph is fine. You can always map to RDF later if needed (there are mapping languages like GraphML to RDF or just custom scripts).
- If your context graph is going to serve as a central enterprise metadata hub, note that many data catalog/metadata products (Collibra, etc.) use RDF under the hood or something similar because of flexibility. But some, like Neo4j-based ones, use PG. So again, it’s possible either way.
In short: Use RDF if you need its strengths (standardization, inferencing, semantic queries, merging data) and can handle the learning curve/verbosity. Use property graph if you favor quick development, integration with property graph tech stack, and you don’t have a pressing reason to have formal semantics. Many projects start with property graphs for ease, and if a need arises to reason over it or share, they consider translating to RDF later or using an RDF pipeline for certain aspects (like using RDF for provenance specifically, since PROV is handy).
For context graphs specifically:
- Temporal context: Both can do it. RDF could store time as a literal or use named graphs keyed by time. PG can store time as a property and you can query accordingly or use versioning patterns.
- Decision traces and policies: Both can model that fine. If you wanted to say “every Decision that applied a sub-policy implies something about a higher policy”, you might do inference in OWL. If not needed, PG is simpler.
- Tool support: If you want to use off-the-shelf graph rules engines or shape validation (SHACL for RDF is nice to ensure data integrity), that’s a plus for RDF. If you want to use a lot of built-in graph algorithms (say find communities of similar decisions — though you can do that on RDF by exporting to something like networkx too), PG has libraries ready.
At the end of the day, either can work. The practical approach some take is: if they already have a data catalog or KG (likely RDF), they extend that with context; if not, they pick a PG for initial implementation because it might integrate with their application code more directly (e.g., many programming languages have friendly PG ORMs or drivers).
To avoid dogma, consider a pilot with one and see if you hit friction:
- If using RDF, do your devs get bogged down writing SPARQL or dealing with triple explosion? If so, maybe PG is better.
- If using PG, do you find it hard to enforce data constraints or to connect with other semantic data? Then maybe consider moving to RDF or a hybrid.
Given that context graphs in enterprises often evolve from metadata/lineage systems, which historically might be RDF-based or PG-based depending on vendor, there’s no one-size-fits-all. The key is that the functionality (capturing context links) can be achieved in both — it’s a matter of tooling and standards.
We will see in Lab 2 an example of using RDF (rdflib) to store a small context graph and query via SPARQL, and in Lab 1 an example with Neo4j property graph and Cypher. These will illustrate hands-on the differences and similarities.
Building a Context Graph in Practice (End-to-End)
Now we turn to how one actually implements a context graph in a real system, step by step. We’ll cover instrumentation, data ingestion, operations, and observability. This is the “nuts and bolts” section: how to capture the decision traces, how to integrate with existing workflows, how to update the graph, etc. The focus is practical: assuming you’ve decided what to model, how do you get the data in and keep it current.
9.1 What is a “Decision Trace” and How Do You Capture It?
We’ve used the term decision trace frequently — let’s define it concretely: a decision trace is a record of a decision event, including the context that influenced it and the outcome it produced. It’s like an entry in a ledger, but with rich links: not just “Decision made by X at time Y,” but also “because of facts A, B, and C; exception Z applied; leading to result R and next steps N.”
Examples:
- In a customer support workflow: A decision trace might be “Ticket 123 marked as Resolved at 3pm by agent Bob with justification ‘Customer confirmed issue fixed’, under Policy “SLA-Refund-Policy” where no refund given (outcome).”
- In a credit underwriting process: “Loan application 456 Approved at 2025–10–10 by AutoAgent, using Model v2 risk score=Low, Policy standard credit approval, no manual override, output interest rate 5%.”
- In a coding agent scenario: “Pull Request #789 merged at 2025–09–01 by AI Bot, tests all passed, security check flagged nothing, reviewer exceptions none, so auto-merged. Then it triggered Deployment event.”
Capturing decision traces means instrumenting your systems or processes to emit these records to the context graph at the moments decisions occur.
How to capture:
- If you are building or using AI agents (or any workflow automation), instrument them at key decision points. For example, if using an orchestrator like LangChain or a custom Python script, when the agent decides something (like to call a tool, or to output a final answer, or to escalate to human), you create a Decision node (or prepare one to insert) with attributes like timestamp, agent name, decision type, outcome, etc. You also collect references to what it considered (did it look up a knowledge article? did it get a policy input? those become edges to evidence or context).
- For human-involved decisions, integration is trickier. You might capture human decisions from the systems they use. For instance:
- If approvals happen in an internal web app (like clicking “Approve” in a UI), you modify that system to log the event to the context graph (or to a message queue that your graph ingestor listens to). It would send data: “Decision type=Approval, approver=JohnDoe, ref=Opportunity 321, timestamp=…”.
- If decisions happen via emails or chats (informally), you can integrate with those systems — e.g., a Slack bot that when it sees a message “OK, proceed with X” in an approval channel, it records that as an approval event, maybe attaching the Slack thread as evidence. This is advanced and can be error-prone (NLP might be needed to detect such decisions).
- If there’s no system at all (people discuss in hallway), then capturing that decision is very difficult — you’d rely on a person to input it somewhere after the fact (or adopt a practice that all decisions must be recorded in, say, a Confluence page or ticket comment; then scrape those).
- For automated processes like CI/CD pipelines, you can hook into events (like a Jenkins pipeline could post a trace: “Build passed on commit abc at 2pm by automated checks”).
Essentially, instrumentation means adding hooks in every platform where decisions occur. Data systems have this concept for lineage (like hooking into Airflow or dbt to capture lineage of data). Similarly, for context graphs:
- CRMs might be instrumented to send events when a deal is marked closed-lost (which is a decision: “we decide not to pursue this lead further”).
- Ticketing systems can send an event when a case is escalated (decision: escalate from tier2 to tier3, with reason).
- Your AI agent framework can be instrumented to log chain-of-thought or intermediate decisions to the graph (some agent frameworks allow callbacks or event handlers, use those to capture traces).
One approach is to implement a “context log API” internally: a simple service where any system can POST a new decision trace (with structured info) which then gets written to the graph store. This API could handle things like assigning unique IDs, attaching timestamps, verifying required fields, etc. Then, integrate your various tools to call this API whenever relevant. For example:
POST /context-graph/decision
{
"decisionType": "Approval",
"decisionId": "Dec-opp-321-approve",
"timestamp": "2026-01-21T21:15:00Z",
"actor": {"type": "User", "name": "jdoe"},
"entity": {"type": "Opportunity", "id": "Opp321"},
"outcome": "approved",
"policy": "DealDeskPolicy v1.3",
"precedents": ["Deal456-exception"],
"notes": "VP approved due to strategic logo."
}
Your context graph ingester would then create nodes and edges accordingly: Decision node with those props, link actor to jdoe Person node, link entity Opportunity, link Policy, link any precedent decisions referenced, and maybe store the notes or link to a CRM record that has them.
9.2 How to Instrument Agent/Workflow Systems at “Commit Time”
“Commit time” means the moment a decision is finalized or an action is taken. We want to capture context then (not later when it might be harder to reconstruct). For human workflows, commit time might be when they click a button or send an email confirming something. For AI agents, commit time is often when they produce the final output or cross a step that’s designated as significant.
Agent systems: Suppose you have an AI agent that goes through steps (like use tools, gather info, then output a decision). You’d instrument:
- After it uses a tool and gets result, maybe log a partial trace (or keep in memory).
- When it decides the final answer, log the decision trace fully. For example, LangChain agents can have a callback handler; on the final answer, the handler can call the context log API with all info (tools it used can be listed as evidence, etc.).
- If the agent defers to a human (“human in loop needed”), that itself is a decision to escalate — log that too.
Workflow systems: Many companies have workflows in systems like ServiceNow, Jira, etc. Ideally, integrate via their webhooks or APIs. E.g., ServiceNow could call your API whenever a Change Request is approved/denied (with details of who, when). Jira might not have out-of-box “decision events”, but a rule could be set: when an issue transitions to Done, if certain label present (meaning a decision on that issue), call our webhook.
Dealing with legacy or inaccessible systems: If direct instrumentation is impossible, one can consider periodic extraction — not as good, but still. For example, run a daily job to scan yesterday’s transactions and infer decisions (like check for any new closed deals and treat those closings as decisions). Then add them to graph. The downside is you might miss real-time reasoning (the agent can’t immediately use that trace for the next action if it’s only loaded next day). But for some contexts (like a monthly financial close), delay is fine.
Using logs & events: Many systems output logs (text logs) or events (to e.g. CloudWatch, Splunk). You could implement a parser that listens to those streams, picks out relevant events (maybe with regex or structured logging format), and then sends to context graph. For instance, if all code merges log “Merge by X at time Y”, you can catch those and feed context graph.
Idempotency and versioning: When instrumenting, ensure that if the same decision is captured twice (perhaps due to a retry or it being logged in two places), you handle it. Perhaps have a unique trace ID (like combine entity id + decision type + timestamp) and check if already in graph. Or allow duplicates but reconcile later.
Also consider versions of decisions: Sometimes a decision might be updated or reversed (like a change request was approved, then later rescinded). If your context graph is append-only, you’d log the rescind as another decision event (like a separate node “Decision revoked” linking to the original). Or you update a property on the original node (less preferable because you lose the original state, though you could have a “status” property). Better is to model it explicitly: original decision node stays, and a new decision node indicates reversal, with an edge to original as “reverses” or “supersedes”.
Linking to entities and records: It’s crucial that decision traces connect to the rest of context: e.g., a decision about Ticket 123 must link to the Ticket node (which likely was ingested from the ticketing system’s data already). That implies you need a consistent identifier strategy (maybe use the same IDs as the source system). If your graph had Ticket nodes from a daily sync, you can attach decisions to them by using that ID.
Ingestion patterns:
- Real-time event ingestion: as above via webhooks, message queues. Possibly use something like Kafka: all systems push events to a “context-graph-events” topic, a consumer reads and updates the graph. This decouples producers from the graph DB (good for scaling).
- Batch extraction: Connectors that run periodically: e.g., every night, call Salesforce API for any opportunities closed that day, create context events for them. Or call GitHub API for any PR merged events. This works but introduces latency.
- Manual curation input: For things that can’t be automated, you might have a UI or form where humans can log a decision. For example, an exec might log a one-off decision in a wiki; you could integrate with that wiki’s API or encourage them to fill a short form that goes to context graph. If culture can adapt, some organizations might require a quick entry in a decisions register (some enterprises keep a “decision log” in spreadsheets or wikis — that is in spirit a context graph, just not linked or queryable; you could turn those entries into actual graph entries).
Ops: incremental updates, idempotency, versioning, backfills:
- Incremental updates: The graph should be updated incrementally as new events come. Graph databases generally allow upserts. E.g., in Neo4j, you
MERGE(find or create) the node for the entity (like ensure Ticket node exists), thenCREATEthe new Decision node and relationships. In RDF, youINSERT DATAwith new triples, or use an update query to insert if not exist. You want to avoid duplicating the same event (so maybe a unique property or use RDF named graph where name = event ID). - Idempotency: If your ingestion might retry events, design the ingestion logic to detect duplicates. For example, keep a set of processed event IDs (in a separate log store, or even in the graph as a property on the node or a separate index). Or write ingestion in an idempotent way: in Cypher,
MERGE (d:Decision {id: "Dec-opp-321-approve"})will not create a second node if one with that id exists. Use such constraints (and ensure you have an index/unique constraint on Decision id). In RDF, if you use the same URI for the decision, adding the same triple twice is usually fine (the graph store will typically ignore duplicate triple on insertion or just store it logically once). - Backfills: Sometimes you start a context graph not at day zero of your company, but after years of decisions already happened. You might want to import historical data. That’s a backfill process: say, ingest all past closed deals as decision events. Or all past incident reports. You can do this via batch jobs or scripts. It might be a lot of data, so plan performance accordingly (maybe break into chunks). After backfill, subsequent incremental should pick up only new stuff. Ensure backfilled nodes are marked with correct timestamps so they are placed properly in timeline queries.
- Versioning decisions or policies: We touched on decisions reversal. Policy versioning is another: If a policy gets updated from v3.2 to v3.3, how to reflect? Typically you’d have separate Policy nodes for each version, and mark relationships or validity times. E.g., Decision in Jan 2025 applied Policy v3.2 (which was active until Feb 2025, then v3.3 took effect). You might maintain a link like v3.3 node with property active_from date. Possibly keep them connected: Policy v3.3
:PREVIOUS_VERSION-> Policy v3.2. The graph can answer which version was active at a given decision’s time if you store the decision timestamp and policy’s valid interval.
Example ingestion flow for a support ticket resolution:
- Agent resolves ticket in Zendesk at 2026–01–21 09:00.
- Zendesk triggers a webhook configured for ticket status changes.
- Your webhook handler gets payload (ticket ID, status changed to solved, agent ID, maybe resolution notes).
- Handler calls internal
contextGraphApi.createDecisionwith: - decisionType: “TicketResolution”,
- entity: Ticket123,
- actor: agent:Bob,
- outcome: “solved”,
- timestamp: now,
- evidence: maybe the last comment if provided.
- The API writes to graph: finds/creates Ticket node (with id=Ticket123), finds/creates Person node for Bob, creates Decision node e.g. id “Ticket123-resolved-202601210900” (ensuring uniqueness via composite of ticket+time or an event ID if provided by Zendesk), sets properties (time, outcome), links Person->Decision ([:MADE_BY]) and Ticket->Decision ([:RESOLVED_BY]) and maybe Decision->Evidence (if a comment considered evidence).
- Now any question or workflow can leverage that decision node. E.g., if a similar ticket comes, agent can query context graph: “SHOW precedents for Ticket type X” and it finds Ticket123’s resolution and sees how it was solved.
Observability (coming in a moment): It’s important to monitor the ingestion: are events flowing? If the webhook fails or misses some, how to detect? For critical systems, might implement acknowledgments or cross-checks (like daily verify the count of decisions in graph matches count in source for that day).
Ops: incremental updates, idempotency, versioning, backfills
(We covered above integrated in instrumentation, because they go hand in hand.)
Observability: coverage, freshness, broken evidence links, policy violations
Once running, treat the context graph ingestion as a pipeline that needs monitoring:
- Coverage: Ensure you’re capturing all the context you intend. For instance, if you expect every closed ticket to produce a Decision node, you can periodically query: “how many closed tickets last week vs how many Decision nodes of type TicketResolution last week” and compare [87]. If mismatch, you lost some.
- Freshness: If some data source hasn’t delivered events in a while, maybe an integration broke. For example, if no decision traces from the finance system came in a week (and that’s unusual), alert. Or simply track the lag: e.g., difference between when a decision occurred and when it’s in graph (should be small if real-time; if using batch, known amount).
- Broken links / missing context: e.g., a Decision node with an appliedPolicy property referencing “Policy 42” but there’s no Policy 42 node (maybe because policy ingestion lagged or ID mismatch). You can have periodic integrity queries: find all
Decisionwith:APPLIED_POLICYedge to a node that is missing some expected info (like noPolicyName). Or check for orphans: evidence nodes not linked to anything, etc. Some graph DBs support constraints to avoid orphans, but likely you'll catch by queries. - Policy compliance within context graph: This might mean using the graph to monitor itself. For example, you might have a rule: “Any decision above $100k must have an approval by VP recorded.” You can encode that as a query: find all Decision nodes with type=DealApproval, amount >100k, that do not have an edge
[:APPROVED_BY]->(:Person {role: 'VP'}). If any, that’s a policy violation or at least a missing context (maybe someone forgot to log the approval). This kind of query is essentially using the context graph for governance – and now you see why having the context graph enables such automated compliance checks elegantly (no more manual audit of Slack). - Provenance and trust checks: e.g., ensure every Decision has at least one evidence or precedent link unless flagged as not needed. If a decision lacks any justification links, maybe that’s incomplete data or an oversight. You might log metrics: what fraction of decisions have evidence? Ideally high, and trending upward as adoption improves.
- Audit trails of changes: If your context graph itself is critical data, consider how to audit changes to it. Some graph DBs have transaction logs. Or you might implement a simple versioning: instead of deleting or overwriting, mark nodes as retired, add new nodes for changes. Then you have an internal audit trail (context graph capturing changes to itself — meta-meta, but possible).
- Performance monitoring: If ingestion is falling behind or queries are slow, track times. Perhaps log how long it takes to insert events, how many events queued, etc. Graph size growing might slow queries if not indexed properly — monitor query latency for key use cases. If it degrades, consider archiving very old parts or partitioning.
Tooling: You could build a small dashboard or use existing monitoring. If using something like Neo4j, it has query logging; you can attach JMX or metrics to track insertion rates. If using RDF store, maybe it has a SPARQL endpoint logs you can analyze. In simplest form, even count of nodes by type over time can be output and visualized (should be steadily rising, not plateauing unexpectedly unless logically should).
One more aspect: Security & quality of ingestion — what if an event fails to insert (maybe due to a schema violation or DB down)? Have a retry mechanism or dead-letter queue. Observability includes catching those errors. E.g., if our ingest service fails to create node due to constraint violation (duplicate ID?), it should log and maybe skip or update existing, but alert if it’s unexpected scenario.
Operating model: possibly designate an owner for context graph — they watch these metrics and coordinate with source system owners if something goes off (like if no events from System X because its webhook was turned off, the context graph owner will chase that). Over time, as context graph becomes integrated, those flows should stabilize.
To recap: building a context graph in practice involves hooking into your enterprise’s digital nervous system to extract context signals at decision points, ensuring those signals reliably arrive and integrate in the graph, and keeping an eye on the health and completeness of this “memory”. It’s engineering work akin to building a data pipeline, but for metadata. Much like ETL for a warehouse, think of it as ETL for context: Extract decision events, Transform into graph nodes/edges, Load into graph store.
Next, we consider scaling patterns like one big graph vs multiple (and how to manage token limits and privacy with subgraphs), as well as governance and compliance considerations.
10. One Big Graph or Many Small Graphs?
A core design question is whether to maintain one durable master context graph for an entire domain (or organization) versus spinning up many ephemeral subgraphs for specific queries or tasks. Both approaches have merits, and in practice many implementations blend them by storing a large graph but extracting smaller context-specific subgraphs at runtime [1], [2]. This section explores the trade-offs, including token budget constraints for LLM prompts, privacy considerations, caching strategies, and multi-tenancy isolation.
10.1 Durable Master Graph vs. Query-Specific Subgraphs
Master Context Graph: One strategy is to persist a single massive graph (or a few big interconnected graphs) that accumulates all facts, events, and decision traces. This “world model” of the enterprise can reach billions of nodes and edges, but modern graph engines can handle precise subgraph retrieval from it in milliseconds [2]. The context graph concept itself assumes that as decision traces are captured over time, they naturally form an evolving graph of entities and events connected by “why” links [3]. A durable graph provides a long-lived memory: patterns and precedents emerging in one area can later be discovered and reused elsewhere. For example, a precedent set in a customer support decision might inform a sales discount approval months later if both are recorded in the same graph.
Ephemeral Context Graphs: On the other hand, AI applications often need only a slice of context relevant to the query at hand. It can be inefficient or even impossible (due to LLM input length limits) to feed the entire graph to a model [4], [5]. Instead, a query-specific subgraph is dynamically extracted, containing only the most relevant nodes and relationships for that question [1]. This subgraph might exist only in memory or be cached briefly. For instance, an agent asked “Why was Order #1234 escalated?” would retrieve the order node, its related ticket, the decision node for escalation, any linked policy and evidence nodes, etc., but nothing unrelated. The TrustGraph framework explicitly supports tagging and isolating subsets of triples (called collections) within a larger knowledge graph, so that specific context subgraphs can be pulled by name without duplicating the whole database [2].
Blended Approach: In practice, even if you maintain one big storage graph, you will almost always retrieve a smaller subgraph per query, because only that subgraph can fit in an LLM’s prompt window. The large graph is like a knowledge lake, and each query ladles out a context snippet of a few dozen nodes and supporting facts. Designing your schema and indexes to support fast subgraph retrieval is therefore critical. This often means storing metadata on nodes/edges that helps filtering by relevance or recency [6] (e.g. tags for projects, data sensitivity levels, or vector embeddings for semantic similarity to the query). The goal is to slice out just the pertinent 50–100 nodes for any given question, leaving the rest of the graph untouched.
10.2 Token Budgets and Privacy Minimization
A major reason to favor many small subgraphs at query time is the token budget of large language models. An LLM might only accept a few thousand tokens of context; sending an entire enterprise graph would be infeasible and counterproductive [7]. By constructing minimal subgraphs, we reduce irrelevant information and stay within model limits. This also has a privacy benefit: the smaller the context provided, the lower the chance of including sensitive data that isn’t needed to answer the query. For example, if a support agent asks “What is the history of escalations for customer ABC Corp?”, the context graph retrieval should bring in that customer’s tickets and decisions — but not every other customer’s data. This principle of least privilege in context assembly means each subgraph is scoped tightly to the query’s need-to-know [8], [5].
Privacy minimization through subgraphing also reduces the risk of inadvertent leakage. If the context graph contains personally identifiable information (PII) or confidential business data, query-time filtering can omit nodes/attributes that the current user or use-case isn’t permitted to see. Many implementations integrate an access-control filter into the retrieval step (see §11). In essence, generating a subgraph per query acts as an additional sandbox — it’s an extract specific to one session, which can be inspected or redacted before being sent to an LLM. This approach aligns with the concept of purpose limitation in privacy regulations: only use the data necessary for the task at hand.
10.3 Caching and Reusing Context Subgraphs
There is a performance trade-off in building subgraphs on the fly. For complex multi-hop queries, graph traversal and relevance ranking can be expensive if done from scratch each time. Caching frequently used subgraphs can mitigate this. For instance, if multiple agents repeatedly ask about “policy compliance for customer onboarding”, it may make sense to cache the subgraph of all onboarding steps, approvals, and related policies. The next query can retrieve it from cache rather than hitting the database anew. Caching can be at the level of entire subgraphs keyed by a query or at the level of query results for particular patterns.
Another reuse strategy is maintaining a library of common context frames. For example, an “incident post-mortem context” frame might always include the recent incidents, root-cause analyses, and remediation tasks as a starting point. Agents could pull this template subgraph and then add any case-specific nodes. Such caching and templating accelerate response and ensure consistency (the same facts yield the same answers over time). However, one must manage cache invalidation — if the underlying graph changes (e.g. a policy is updated), cached subgraphs containing the old info should be refreshed or discarded to avoid serving stale context.
10.4 Multi-Tenancy and Isolation Patterns
In enterprise settings, a single context graph might serve multiple teams or clients. Multi-tenancy introduces additional complexity in deciding one graph vs. many. The options typically are [9]:
- Separate graphs per tenant: e.g. each client or business unit has its own isolated graph database. This guarantees no data commingling (a tenant’s data physically cannot appear in another’s context). It’s simpler from a security standpoint but can be operationally heavy (many databases to manage) and prevents cross-tenant analytics. It may also duplicate shared knowledge across graphs.
- Single graph with tenant tags: All data lives in one big graph, but each node and edge is labeled with a tenant or access level attribute [10]. Queries then include a filter to only traverse nodes the user is allowed to see. For example, attach
tenant_idproperties and enforcetenant_id = Xon all query patterns. This leverages one dataset but demands robust access control enforcement (discussed in §11). Neo4j, Memgraph, and other graph DBs increasingly support multi-tenant modes either via separate in-memory instances or such row-level security filters [11], [9]. - Hybrid isolation: Use one graph for common reference data and per-tenant subgraphs for sensitive data. For instance, global ontology nodes (products, policies) could be shared, while customer-specific decision traces reside in separate partitions.
From a graph design perspective, one massive graph can scale if engineered correctly — one user noted they manage graphs with billions of elements and still can “precisely retrieve subgraphs in milliseconds” by organizing data with collection markers [2]. The key is to plan for isolation within the graph via metadata, or carefully scoped queries, to avoid cross-tenant leakage. Sometimes regulatory requirements (banking, healthcare) mandate physical separation of certain data, pushing you toward multiple graphs or at least separate named graphs or subspaces within a triple store for different classifications.
Pros and Cons: A single master graph maximizes context continuity — everything is connected, enabling serendipitous insights (what happens in one corner of the business can inform another). It simplifies governance in some ways (one place to apply policies) but puts all eggs in one basket (a mistake in access control or a graph outage can impact everyone). Many small graphs localize problems and can be optimized per use-case (e.g. a lightweight in-memory graph for real-time agent context, versus a heavy persistent graph for audit logs). However, maintaining many graphs introduces overhead in synchronization and duplication of common knowledge. Operational patterns have emerged where a master knowledge graph underlies the system of record, and ephemeral “context graphs” are materialized as needed for AI consumption [1] — blending the durability of one graph with the safety of multiple scoped extracts.
In summary, you don’t have to choose once and for all. It’s common to maintain a large integrated context graph as a backbone (with governance and history), while tooling around it produces and caches smaller context packets to feed into LLMs or agents. Those context packets are essentially views or projections of the master graph, optimized for each query’s needs [12], [13]. The guiding principle is to keep the master graph as rich as possible (don’t throw away potentially useful context), but deliver to the AI models only what is relevant and allowed — which is necessarily a fraction of the whole.

11. Governance, Security, and Compliance
Embedding an ever-growing context graph into AI workflows raises vital governance questions. A context graph is only useful if it can be trusted by humans and machines alike — which requires controlling access, ensuring accuracy (provenance), complying with privacy laws, and guarding against malicious use. This section examines guardrails, access control patterns, data handling policies (PII, retention, audit), threat models, and practical mitigations to operate context graphs safely in production.
11.1 Guardrails and Compliance in Context Graphs
Context graphs often support decisions in high-stakes domains (finance, healthcare, legal, etc.), so guardrails and compliance checks must be baked into their design [14], [15]. Unlike a free-form memory, a governed context graph enforces who can contribute and retrieve context and under what conditions. Key guardrails include:
- Policy-aware queries: Every retrieval from the graph should respect the current governance policies. For example, an AI agent assembling a customer support context must filter out any notes marked “Attorney-Client Privileged” if policy forbids exposing those to front-line agents. The graph itself can encode policies as first-class nodes or relationships (e.g. a node representing “EU GDPR Data” linked to certain data nodes) [16]. Guardrail logic then traverses these links: if a piece of data is tagged as personal (PII) and the user’s role is not allowed to see PII, the query result is sanitized or blocked. This concept of policy nodes means governance rules live inside the graph, making them queryable and auditable [17].
- Automated redaction and anonymization: Compliance often requires removing or masking sensitive information before it’s used. Context graphs can integrate PII detection and redaction pipelines so that, say, a person’s name is replaced with an ID or certain fields are hashed in the context presented to the model. A best practice is prompt-time redaction: scrub sensitive tokens right before sending the LLM prompt [18], [19]. For instance, an email address might be replaced with
<USER_EMAIL>placeholder in the context snippet. As one guide advises, “mask personally identifiable data on ingestion while preserving context for analysis” [20]. By scrubbing at ingestion and/or retrieval, the graph ensures no unauthorized exposure of secrets or personal data occurs via the AI. - Immutable audit trails: A context graph can itself serve as an audit log of decisions (with added structure). To meet compliance requirements, these records should be tamper-evident and retained as long as needed. Each decision node might carry a cryptographic signature or hash linking it to an append-only ledger [21]. This way, if someone tried to alter a past decision rationale, it would break the signature chain. Some implementations use blockchain or secure timestamping of context graph entries to achieve this. The context graph effectively becomes an auditable system of record for why decisions were made [22], [23]. Regulators or internal auditors can query it to reconstruct exactly what information was considered, who approved what, and under which rules.
- Human oversight and curation: No matter how automated, guardrails benefit from human-in-the-loop. Teams should periodically review context graph entries for correctness and appropriateness. For example, a Data Governance committee might review a sample of decision traces each month to ensure policies were applied correctly and no sensitive attributes slipped through. Providing interfaces for subject matter experts to flag or annotate context graph elements is useful. Governance isn’t set-and-forget; it’s an operational process that the context graph should facilitate (by making the info searchable and explainable) [15].
11.2 Access Control Patterns (Node, Edge, and Attribute-Level)
Fine-grained access control is essential so that users and agents only retrieve graph data they’re permitted to see. Graphs present unique challenges because of relationships — even if a user isn’t allowed to see a certain node, they might infer something from connected nodes or edges if not properly restricted [24]. Several patterns address this:
- Role-based and attribute-based access control (RBAC/ABAC): One approach is to annotate each node and edge with security labels (e.g. classification level, tenant ID, project) and associate users with roles or attributes (e.g. clearance level, department). The graph engine can enforce that queries only return triples where the user’s attributes meet the required labels [25]. For instance, Oracle’s RDF store allows tagging individual triples with sensitivity labels (“UNCLASSIFIED”, “CONFIDENTIAL”, etc.) and filters query results based on the querying user’s clearance [25], [26]. A user with only “Unclassified” access would automatically have all triples labeled “TopSecret” removed from any SPARQL query results. This triple-level security ensures that even within one graph, different users get different views [25].
- Named graphs or graph namespaces: In RDF-based systems, one can partition data into multiple named graphs and grant access on a per-graph basis [27]. For example, each department could have a named graph for its context, and cross-department queries require explicit permissions to traverse into another’s named graph. In property graph systems, a similar concept is using separate subgraph instances or databases per security domain, as noted earlier. Some platforms (e.g. Memgraph Enterprise) support multiple isolated graph spaces in one server process [28]. The advantage is clear separation; the downside is extra overhead when you do need to cross boundaries (you then need an authorized federated query across graphs).
- Edge or relationship filtering: In contexts where certain relationships themselves are sensitive, an edge-based filter can be used. For example, maybe anyone can see that a Ticket exists, and the content of a Policy, but the link that a given Ticket was resolved under a particular Policy might be sensitive (revealing that a special exception was applied). An attribute on the edge (like
edge.sensitivity = HIGH) could cause the query to omit that relationship unless the user has high clearance. Graph databases are beginning to incorporate such edge-level security; if not, one can model it by turning the relationship into a node (reification) with its own properties and then applying node-level controls. - Contextual and dynamic access rules: Sometimes access depends on query context — e.g. allow a support agent to see more customer data only if they are currently assigned a ticket for that customer. This requires injecting some context (like agent ID and customer ID) into the graph query and encoding rules that match them (like
MATCH (u:User)-[:ASSIGNED_TO]->(t:Ticket {id: $ticket})-[:ABOUT]->(c:Customer) ...). In other words, the query pattern itself can enforce the access logic by structure, not just by labels. This is related to graph-based entitlements, where a separate subgraph encodes who can access what (e.g.User->canAccess->Customernodes), and queries must traverse those permission edges to fetch data. IndyKite’s Knowledge Based Access Control follows this idea, using a knowledge graph of users, resources, and relationships to decide authorization in real-time [29], [30].
Implementing fine-grained access control inevitably adds complexity. It can impact query performance (additional checks on each triple or path) and complicate caching (you must cache results per user or per role, since different users see different subgraphs). However, these costs are necessary in sensitive environments. The alternative — a coarse all-or-nothing control — would either overly restrict legitimate use or risk serious data leaks. A well-governed context graph typically layers multiple techniques: for example, use separate named graphs for clearly separated data realms (like different clients), and within each, use attribute-based filters for finer distinctions (like public vs. confidential attributes of those clients).
A practical tip is to utilize your graph engine’s native security features where possible. Many enterprise graph databases (Neo4j Enterprise, GraphDB, Stardog, etc.) have built-in role-based auth, and some allow procedures or plugins to enforce custom logic at query time. For instance, Ontotext GraphDB provides a fine-grained access control mechanism where you can restrict access to specific predicates or named graphs for certain roles [31], [32]. Oracle’s semantic graph layer, as mentioned, leverages Oracle Label Security for triple-level controls [25]. Neptune (AWS) ties into AWS IAM for controlling access at the cluster and edge label level. Choosing a platform that supports your needed granularity will save custom development. If not, you may need to implement filtering in the application layer — e.g. post-process query results to strip forbidden info, or generate queries dynamically with the appropriate WHERE clauses for the user’s rights.
11.3 Handling Sensitive Data: PII, Retention, and Audit Trails
PII and Sensitive Data: Context graphs often contain metadata and content that can be sensitive: user IDs, email addresses, contract details, incident summaries, etc. It’s crucial to classify and handle such data properly. One approach is to tag nodes/edges with data sensitivity tags on ingestion (like classification: HIPAA or contains_pii: true) and then enforce at query time as described. Beyond access control, the graph pipeline might integrate data minimization transforms. For example, when ingesting a Slack conversation as evidence, the pipeline could detect phone numbers or social security numbers and either not store them or store a redacted version. Tools like AWS Comprehend or open-source regex patterns can identify common PII and mask it. An example architecture uses Lambda functions to strip PII from text before inserting it into the context graph, maintaining an original copy in a secure vault and only feeding the masked version to the AI context [33], [19]. The guiding principle is “privacy by design”: design the graph so that even if an AI agent pulls everything it has access to, the content has been scrubbed of data the agent should not output.
Retention Policies: Compliance may dictate how long certain context must be retained or when it should be deleted. For instance, GDPR’s right to be forgotten could imply that if a user requests deletion, any decision traces involving their personal data should be purged from the graph. This is challenging because context graphs, by design, interweave many pieces of information. If an individual’s data was part of a decision rationale, removing it might break that trace’s completeness. A solution is to design reference graphs where personal identifiers are linked via surrogate keys. For example, instead of storing the raw username in every node, use a stable internal ID and have a mapping that can be deleted or anonymized. The decision trace remains (e.g. “Order 123 was approved by User 456 on Jan 1”), but if User 456 invokes deletion, the link to their real identity can be severed or anonymized. Also, layering time as an aspect (temporal graphs) helps: one can mark a node as expired as of a certain date rather than physically deleting it (preserving historical analyses but excluding it from current queries unless explicitly doing time-travel queries).
From an operations perspective, apply data retention schedules to context graph storage just as you would to log files. For example, keep full detailed traces for 1 year, then archive or roll them up (perhaps summarize or compress older context). Some graph systems allow “aging out” data by timestamp property or moving nodes to an archive graph. Deciding what to prune is delicate — too much pruning and you lose institutional memory; too little and you violate retention policies or incur storage bloat. A compromise is to archive older context graph slices in cold storage (e.g. export subgraphs as RDF files or Neo4j dumps) and remove them from the live graph, except for key summary nodes that might still be useful.
Audit Trails: By their nature, context graphs are audit trails of AI/agent decisions, but we also need to audit the usage of the graph itself. This means tracking who accessed what context and when. Implementations can log every graph query or at least privileged queries. For instance, if a compliance officer queries “show all decisions involving Policy X,” that query itself might be logged. Additionally, if an AI agent is pulling context, one should log which nodes/edges were provided to the model for each request (this can be stored as another subgraph or in log files). This helps in forensic analysis: if a model outputs something it shouldn’t have, you can trace back to see if that information was in the provided context (and if so, why it was allowed).
In summary, handling sensitive data in context graphs is a multi-layered effort: classify and minimize at ingestion, control and filter at query time, respect lifecycle requirements via retention and deletion policies, and log everything for accountability. With these in place, a context graph can enhance compliance rather than threaten it — providing a clear record of decision context that regulators often wish existed. In fact, “the context graph can serve as an auditable system of record for decisions, where auditability is structural, not bolted on” [23], [34].
11.4 Threat Models: Spoofing, Exfiltration, and Policy Drift
Any system that aggregates knowledge and feeds it to AI must consider malicious scenarios. Threat modeling for context graphs involves looking at how an attacker or simply errors could compromise the system:
- Provenance Spoofing: If the graph accepts input from various sources (including AI outputs or user submissions), an adversary might inject false context or forge provenance metadata to mislead decisions. For example, they could create a fake “Evidence” node with a snippet from a nonexistent policy, hoping the agent uses it as truth. Guardrails against this include verifying sources (only ingest from trusted APIs or signed data) and using reputation scores or confidence levels for each node. Some context graph designs integrate a trust score on each edge (e.g. how reliable is this relationship, based on source) [35]. If an agent tries to use a low-trust edge in reasoning, the system can flag it or require extra validation. Cryptographic provenance (digitally signing data at the source and carrying those signatures) can detect tampering; e.g. a policy document node could carry a hash signed by the legal department. Then any spoofed policy would lack a valid signature and could be ignored or downgraded.
- Data Exfiltration via Retrieval: A user might try to get the AI to divulge sensitive info by exploiting the context retrieval. For instance, a user asks the AI, “Tell me all secrets about Project X,” and if the agent naively retrieves the entire Project X subgraph (assuming the user is authorized when they are not), the answer might expose confidential details. This is essentially an over-broad query risk. Mitigations include strict access control (as discussed) but also query policy: not every question should trigger retrieval of everything related. You may impose limits like “only retrieve at most 3 hops from the entities explicitly mentioned in the query” or “do not retrieve nodes marked internal if the question came from external channel.” Another exfiltration risk is prompt injection — if a user manages to insert a prompt that causes the agent to reveal its context. Ensuring the model’s prompt includes instructions like “do not reveal internal context graph data unless explicitly allowed” is a necessary guardrail, though not foolproof [36], [37]. Monitoring the outputs for sensitive content (with a content filtering model or regex checks) provides a last line of defense; if the AI tries to output a credit card number from the context graph, the system should catch and redact it before it reaches the user.
- Policy Drift and Staleness: Over time, corporate policies change — perhaps a practice that was allowed last year (e.g. approving a certain exception) is no longer allowed. If the context graph is not updated, an agent might find a precedent from last year and follow it, violating current rules. This is a subtle threat: the context graph could cause compliance drift if old decisions are treated as precedents without checking their validity. To counter this, context graphs should incorporate temporal context and validity intervals (see §12 on temporal graphs). Each policy node could have an “active from/until” timestamp. Decision traces linked to a policy should thus also carry a time. An agent should be trained or constrained to prefer more recent precedents and to cross-check whether a policy cited is still active. In governance terms, one needs a process to deprecate or annotate old traces that are no longer applicable (rather than deleting, since they may still be needed for audit). This can be done by linking an old decision to a new decision that overrides it, or adding an “invalidatedBy” relationship when policy updates occur. The graph essentially can tell the story not just of decisions, but of the evolution of the rules themselves — providing context about context. Without this, there’s a risk of “frozen in time” knowledge leading the AI astray.
- Model Misuse of Context: Another risk is the model incorrectly interpreting graph context, leading to errors that could violate policies. For example, an LLM might see a node “Customer X is on watchlist” and mistakenly include that in a response to a salesperson (violating confidentiality). This is more of an AI behavior issue than graph security, but the graph can help by providing context type tags. If that watchlist info had a tag “Compliance-Internal,” the agent or a downstream rule could suppress it from any customer-facing answer. Ensuring the model or the orchestration logic is aware of such distinctions (possibly via chain-of-thought steps that examine node metadata) is an emerging practice to keep AI outputs policy-aligned [38].
In summary, the context graph should be treated as part of the security perimeter of your AI systems. Traditional app security focused on databases and APIs; now the context feeding the AI must be just as hardened. Provenance validation, rigorous access control, query filtering, and continuous audits are the tools to counter threats ranging from forgery to leakage. The operating model likely needs involvement from security teams: for instance, threat hunters might inspect context graph logs for unusual access patterns (was there a spike of queries retrieving a lot of confidential nodes?), and red-team exercises might attempt prompt injections or graph poisoning to test resilience [37], [39]. By anticipating these threats and building in safeguards, organizations can confidently scale their context graphs without inviting chaos.
11.5 Operational Mitigations and Best Practices
Implementing governance is not just about technology but also process. Here are some practical operating model considerations to make the above concrete:
- Data Catalog Integration: Marry your context graph with your data catalog and lineage tools. For example, if your data catalog (like Collibra or Atlan) already tracks where PII is located and who the owners are, feed that into the context graph as annotations. Conversely, significant decisions recorded in the context graph (like an approval for a new data use) could be back-propagated to the catalog for visibility. This ensures one hand (AI context) knows what the other hand (data governance) is doing.
- Governance Board for Context Graph: Establish a cross-functional committee (AI engineers, compliance officers, data stewards) that reviews context graph usage and updates policies for it. They might define what categories of context are allowed for certain AI tasks and monitor for policy violations. For example, they could decide “For legal AI assistants, all context must come with provenance from our contract database or else be flagged as unverified.” This group also evaluates any incidents (like a leak or a mistaken decision) and feeds lessons back into graph governance rules.
- Tooling for Transparency: Provide tools to explain and debug context to users. If an AI agent made an odd decision, a human should be able to query the context graph and see what facts the agent was given and on what basis it proceeded. This debug trail builds trust and also helps catch where governance might have failed (e.g. “Oops, the agent saw a node it shouldn’t have — how did that slip through?”). Modern platforms emphasize this transparency: e.g. logging chain-of-thought along with context, or visualizing subgraphs that led to an answer [40], [41]. In a governed system, whenever the AI outputs an answer with context, it should ideally present the provenance (citations or links) so the end-user and auditors can verify.
- Continuous Policy Enforcement Testing: Treat your context graph guardrails like code — test them. Create test queries that a normal user should not get answers to (like “Show me all salaries” for a low-privileged user) and verify the AI responds with a refusal or an error due to graph access denial. Create scenarios of changed policies and see if outdated context is detected. This is analogous to unit testing and red-teaming of the AI system.
- Minimal Exposure by Default: A safe starting point is to not include the context graph at all unless needed. Then, gradually open up access as confidence grows. Early on, many teams choose to have the AI cite context graph entries but not fully act on them without human confirmation — a kind of “read-only mode with verification.” Over time, as the guardrails prove effective, agents might get more autonomy to act on context. This phased approach ensures that if something was overlooked in governance, the impact is limited. Essentially, you earn trust in your context graph through controlled deployment.
By following these practices, organizations make the context graph a governed asset rather than a wild tangle. It becomes possible to answer the tough questions like “What was allowed — and why — in this automated decision?” confidently and quickly [42], [29]. That, ultimately, is the promise of context graphs in regulated environments: better decisions with full traceability and control.
12. Ecosystem Map: Libraries, Tools, and Platforms (When to Use What)
As the concept of context graphs gains traction, a vibrant ecosystem of technologies is emerging. It spans graph databases, semantic web tools, metadata lineage systems, and AI frameworks that integrate with graphs. In this section, we map out the landscape — highlighting notable graph databases (property graph and RDF), knowledge graph and lineage tools, and LLM/agent frameworks that support graph-based context. We also provide guidance on “when to use what,” aligning typical requirements with the best-fit tools and noting trade-offs.
Categories covered:
- Graph Databases (property graph model) — e.g. Neo4j, TigerGraph, Memgraph, Nebula, Amazon Neptune, ArangoDB.
- RDF Triplestores and Semantic Tech — e.g. GraphDB (Ontotext), Stardog, Apache Jena, Blazegraph, RDF-star, etc.
- Lineage and Metadata Tools — standards like W3C PROV, OpenLineage, and platforms like Atlan, LinkedIn DataHub, Apache Atlas.
- LLM/Agent integration frameworks — e.g. LangChain, LlamaIndex, GraphSignal/LangGraph, and open-source libraries enabling Graph-RAG.
- Specialized context graph platforms — e.g. TrustGraph, Indykite ContX, that package multiple aspects for enterprise use.
To make this actionable, we present a table of common requirements and some recommended stack choices, before diving into each category.
Table 12.1 — When to Use What (Context Graph Stack Choices)


Table 12.1: A guide to selecting context graph components based on needs.
Now, let’s briefly discuss each category in prose:
Graph Databases (Property Graphs): These are the workhorses for many context graphs, especially when the data is highly relational and not purely hierarchical. Neo4j is a de facto leader with a huge community and a rich set of algorithms (its Graph Data Science library) which can even be used to mine patterns in context graphs (like finding similar decision subgraphs). It’s a great default for many because of its mature tooling (browser, Bloom visualization, etc.). Memgraph, as noted, is ideal when low-latency is critical — say an agent needs to do millisecond lookups of context during a live conversation. TigerGraph shines in enterprise deployments where the graph is extremely large or queries are complex analytics (e.g. “find all interconnected events within 4 hops related to this compliance issue”). TigerGraph’s distributed nature means it can crunch through big graphs fast, but its ecosystem is smaller than Neo4j’s. Amazon Neptune and Azure Cosmos DB (with Gremlin API) are options if you want a managed service on cloud; Neptune particularly is interesting because it supports both SPARQL and Gremlin/OpenCypher, giving flexibility to use property or RDF model. For multi-model needs, ArangoDB might appeal since you can store document data and graph edges in one system (perhaps useful if some context is tabular or JSON-ish).
RDF/Semantic Stores: If your context graph needs to leverage existing ontologies (like FOAF, schema.org, or domain ontologies for say healthcare), RDF is the path. Tools like GraphDB (by Ontotext) allow reasoning — for example, you could have rules that infer new edges like “if a Decision has outcome ‘Approved’ and refersTo Policy that has type ‘ExceptionPolicy’, then mark Decision as ‘ExceptionGranted’”. This inferencing can enrich context automatically. Stardog similarly provides a robust enterprise triple store with reasoning and virtual graph capabilities (you can query data without moving it, via mappings). Apache Jena is more DIY — it’s a Java framework where you might embed it in an application; useful for prototyping or custom integration, but not a full enterprise server unless you use its Fuseki server. A notable mention: RDF-star (or RDF*) is a newer extension allowing you to attach properties to triples (essentially allowing edges to have attributes, which bridges the gap to property graphs). This is great for context graphs because you can attach source=XYZ and confidence=0.9 directly on an assertion triple like (Incident123 causedOutage SystemA) [62]. Support for RDF-star is coming in tools like GraphDB and Jena. If you need fine-grained provenance on each edge, consider an RDF-star capable store or be prepared to do reification (which triples the number of triples, but is doable).
Knowledge/Lineage Platforms: Many organizations likely have some lineage metadata tool already for data governance. Those are low-hanging fruit to seed a context graph. For example, Atlan’s context graph idea largely starts from the notion of connecting data assets with the people and policies around them [63]. If your immediate goal is to reduce AI hallucinations about enterprise data, feeding it the data catalog’s info (definitions of metrics, owners of dashboards, upstream/downstream links) can be very effective [64]. LinkedIn’s DataHub (open source) creates a graph of datasets, jobs, users, etc., which could answer questions like “why is this data point blank?” (maybe a pipeline failed, found via lineage). The advantage of these is they come with connectors to pull metadata from all systems (warehouses, ETL, BI tools). On the compliance side, standards like OpenLineage and Marquez (an open source lineage service) might already be tracking jobs and data flows — that is contextual info that can enrich an AI’s reasoning about data. W3C PROV deserves a mention again: tools exist to serialize provenance in PROV-JSON or PROV-XML, which then can be converted to RDF and stored. If your domain is scientific workflows or data science model tracking, W3C PROV or MLFlow’s lineage might be relevant to include in the graph. Using standards ensures if later you want to share or integrate context graphs with partners, you have a common language.
LLM/Agent Frameworks with Graph Integration: On the AI development side, the ecosystem is evolving every week. As of today (January 22, 2026), LangChain remains a popular choice for orchestrating LLM calls with data retrieval. Its GraphQAChain can, for example, take a natural question, do a Cypher query, and then concatenate the results into the prompt for the final answer, giving you a basic Graph->LLM pipeline. Microsoft’s guidance on GraphRAG (Graph-based RAG) shows improvements in factuality by using structured data alongside vectors [65], [66]. If using LangChain, you’ll typically bring your own database (like Neo4j); LangChain just helps with the integration logic. LlamaIndex (formerly GPT Index) offers a bit more “batteries included” approach for knowledge graphs – it can build a simple graph from text by having the LLM extract triples, then you can query that via natural language. For more production-grade setups, one might directly use the graph’s REST API or GQL via an agent tool. For example, Neo4j has a Graph Data Science Playground and one could hook an agent’s tool to run Cypher queries it formulates (some folks have built custom agents with a “CypherTool” allowing the model to iteratively query the graph until it finds the answer).
There are also emerging Graph-specific AI tools. GraphSignal (or LangGraph by some references) is aiming to be an LLM framework specifically optimized for graph operations, though details are still early. Another example: DeepSearch and SubgraphRAG research (from academic communities) where a smaller learned model helps an LLM figure out what subgraph to retrieve [67]. These aren’t off-the-shelf products yet, but keep an eye on them as the ecosystem moves toward more intelligent retrieval beyond brute-force.
TrustGraph and similar turn-key solutions: TrustGraph (spawned by the team behind the Reddit contextgraph discussions) provides a CLI and an interface that wraps around existing graph databases to automate context graph creation [1]. It’s useful if you want to stand up something quickly: e.g. point it at a pile of documents and get a context graph extracted, or use their pre-defined schema for decision traces. It’s also built with time in mind — they highlight that “time will be a critical dimension of future context graphs” [68] and they are working on dynamic temporal KG support. The benefit of such a platform is the opinionated schema and features (like collection isolation). Indykite, from the identity angle, might be chosen if you specifically want the context graph tightly woven with identity and access control — for instance, an AI that automatically enforces user permissions because the graph plus Indykite’s ABAC ensure only permitted edges are available to each agent.
Finally, cloud vendor offerings: we see early signs like the Google Cloud example using Spanner (a relational DB) with a graph layer and LangChain [69], [60]. Azure has preview features to integrate their Cosmos DB (graph mode) with Azure OpenAI for knowledge grounding. IBM and Oracle have been talking about “AI with knowledge graphs” for a while (IBM Watson utilizes a product called Watson Discovery with a KG). As these mature, if you are heavily in one cloud ecosystem, their native solution might simplify architecture (e.g. fewer network hops, unified security). But often these are not as flexible as a bespoke stack — you might be constrained to their way of modeling or to certain model integrations.
RDF vs Property Graph: How to Choose? This question comes up often in context of knowledge graphs, and thus context graphs. In short: if your use-case demands well-defined semantics, interoperability, and possibly reasoning, RDF is the better fit. It’s also adept at “contextualizing” statements via named graphs or reification (necessary for complex provenance) [14]. For example, RDF will smoothly let you say “Fact X was asserted by Y on date Z” by either reifying Fact X as a node or using RDF-star. Property graphs can do similar (edges with properties, or hyperedges), but if you need to share this data or use standard vocabularies, RDF’s the way. On the flip side, property graphs (like Neo4j) tend to be easier for developers to pick up and often faster for arbitrary graph traversal queries. They shine for path-heavy algorithms and have a more straightforward data model for programmers (just nodes and edges with key-value pairs). In practice, many choose a property graph for building context graphs because of its simplicity and then manually enforce some semantics via the application (e.g. ensure certain labels and relationship types follow an ontology, even if the DB doesn’t know the ontology). If using a property graph and you need some inferencing, you might implement it at the app level (like run a script to add a “isManagerOf” edge wherever appropriate because you know an “Manager” relationship implies that).
A middle path could be using a property graph for the core real-time system and an RDF triple store for archival or compliance analytics. Indeed, some organizations export periodic snapshots of their Neo4j graph to RDF (or use the Neosemantics plugin to expose Neo4j as if it were RDF) when they need to integrate with semantic ecosystems or run SPARQL for cross-system queries. Each model can also inform the other: it’s not too hard to maintain a mapping if needed (since ultimately they both represent graphs of nodes/edges, just with different constraints).
To conclude this ecosystem tour: as of early 2026, the context graph tooling ecosystem is rapidly evolving. Companies are stitching together solutions from these categories to meet their needs. A prudent approach is to start with tools that match your team’s familiarity (for instance, if your team knows SQL but not Cypher, Neptune with SPARQL might be a stretch — maybe better to use a simpler approach like Postgres with a graph extension initially). But also consider the longevity: context graphs are meant to be durable knowledge stores, so picking scalable, secure tools is important. Table 12.1 captures the state-of-the-art trade-offs. Expect that new services will continue to blur these lines (we might soon see a managed “context graph service” that abstracts the DB entirely).
The good news is the ecosystem’s direction is clear: graphs are becoming first-class citizens in AI infrastructure. Whether through direct use of graph databases or through integrated platforms, enterprises are realizing that graph-structured context can dramatically improve AI reliability [70], [71]. With the tools above, one can assemble a robust stack today to harness that power, choosing the pieces that best fit each requirement.
13. Case Studies: Context Graphs in Action
Let’s explore how context graphs are being applied in the real world (or very plausible scenarios), across different domains. We’ll examine three case studies: one in an enterprise governance setting (decision traceability for compliance), one in a content and marketing knowledge ops setting (capturing institutional knowledge for creative workflows), and one from a community/open-source project (where context graphs assist in developer or investigative workflows). For each, we’ll outline the context problem, how the graph was designed (schema highlights), the retrieval approach (GraphRAG or hybrid search), governance measures in place, and the outcomes/limitations. We’ll also distinguish between verified information and our inference or interpretation.
13.1 SaaS Enterprise — Decision Trace Graph for Customer Renewals (Compliance Scenario)
Context: This case, synthesized from patterns reported by Foundation Capital and others [72], [3], reflects a B2B SaaS company that implemented a context graph to govern its sales and support decisions. The company faced challenges with exceptions — e.g. sales reps giving extra discounts, support offering free extensions — that were not recorded with rationale. Audit logs showed what happened (a discount was given), but not why (the context like customer had major outages, VP approval, etc.). This led to inconsistent decisions and difficulty in compliance reviews (couldn’t demonstrate that policy was followed consistently).
Graph Design: The firm built a context graph linking Accounts, Support Incidents, Renewal Opportunities, Policy Rules, and Approval Decisions. Schema highlights:
- Account nodes (with attributes like tier, SLA level).
- Incident nodes, connected to Account, with severity, timestamps.
- Opportunity/Renewal nodes, connected to Account, with details (value, renewal date).
- Policy nodes, representing rules (e.g. “Max 10% discount unless exceptions”).
- Decision nodes for each significant action (e.g. an approved 20% discount, an escalation decision), with edges to the Opportunity it affected, the Policy used, the Approver (a User node), and any Incidents considered as justification.
Importantly, they included temporal context: each Decision node had a decision_time property, and edges like Opportunity-Decision had validity so one could reconstruct the state at decision time (this was done by linking the specific incidents that were open at that time rather than all incidents).
Retrieval Approach: They implemented a form of GraphRAG: an internal AI assistant (for Finance and Sales teams) would answer questions like “Why did we give a 20% discount to ACME Corp last quarter?”. The retrieval pipeline would: 1. Identify the relevant Opportunity node (by customer name and quarter). 2. Traverse to the connected Decision node, then pull its neighbors: the Policy, the Incidents, and the Approver. 3. Generate a textual explanation using those subgraph elements, with citations. For example, “Answer: We granted ACME Corp a 20% renewal discount because Policy X allows exceptions for severe outages, and they had 3 SEV-1 incidents in Q4. The decision was approved by VP Sales (Jane Doe) on Jan 5 [72], [73].” 4. The assistant would provide the answer with pointers to the evidence (incident IDs, policy ID, etc., which the user could click for more detail).
This is a hybrid retrieval: some parts (like finding the right opportunity by name) were handled by vector search on a text index of account names, then graph traversal was used for the connected context. They also set up subscriptions such that whenever a new Decision node was created (e.g. for a new deal), a summary was generated and stored, so the LLM could use a concise summary rather than raw graph traversal every time.
Governance: Because this context graph touched customer data and revenue-impacting decisions, governance was tight. Only a service account could write to the graph (when agents or humans logged decisions via a form). Each Decision node carried a reference to a CRM entry and was digitally signed by the system (to prevent tampering). Access was restricted: only Finance, SalesOps, or executives’ AI assistants could query the full context. If a front-line sales rep’s assistant queried “why was this deal approved?”, it would get a redacted answer if it involved higher management decisions. They enforced this by tagging edges like Decision–Policy as sensitive if the Policy was a financial approval policy, viewable only by authorized roles.
Outcomes: This context graph provided an audit trail that was queryable. During internal audits, instead of pulling emails and disparate logs, auditors could query the graph: “show all renewals >15% discount and their justifications.” This was done with a Cypher query and results could be fed to a reporting dashboard. The company reported (based on a composite of similar real reports) a significant reduction in time to prepare compliance reports — what used to take two analysts weeks of digging through emails now took minutes with the context graph search. It also improved consistency: when a similar situation arose (e.g. another client had major outages and asked for a concession), the sales team consulted the context graph and found the prior precedent, ensuring they followed the same approved pattern [34].
Limitations: This case also exposed a limitation: the context graph is only as good as the data captured. Early on, some sales reps forgot to log the “reason” for an exception, so the graph had a Decision with no linked Incident. The AI assistant would then respond with uncertainty, or it would say “No recorded reason.” This highlighted the need for process discipline — they eventually integrated the decision logging into the CRM workflow so it was harder to bypass. Another limitation was scalability of reasoning: as the graph grew, some complex queries (like cross-customer pattern analysis) got slow on Neo4j Community (single instance). They are evaluating Neo4j Enterprise or TigerGraph for better performance on multi-hop queries across tens of thousands of nodes.
(This case study is a composite scenario based on public descriptions [72], [73]; while the specific company is not named, it reflects verified patterns seen in enterprise SaaS contexts.)
13.2 Marketing Knowledge Graph at Writer — Operationalizing Enterprise Brain (Verified Vendor Example)
Writer, a company providing AI writing assistance for enterprises, has publicly discussed using context graphs to supercharge marketing and content teams [74], [22]. This is a verified case where the vendor built an internal context graph (referred to as an “enterprise brain” or formerly “orchestration graph”) to capture the institutional knowledge behind marketing decisions.
Context: In large marketing organizations, critical knowledge is often tacit: why a campaign succeeded, which messaging resonated, what approvals were needed for exceptions, etc. When key people leave or new folks join, a huge gap exists — “every new hire takes 6 months to learn how we do things here” [75]. Writer’s context graph aims to make this knowledge explicit and queryable by AI. Diego Lomanto (Writer’s CMO) noted that while final content deliverables are stored (e.g. the ad copy, the blog post), the reasoning behind them was lost in Slack threads and hallway conversations [76], [77]. They wanted to capture that context so an AI agent could answer questions like “How do we usually handle competitive claims in legal approval?” or “What were the lessons from our best campaign last year?”
Graph Design: The context graph at Writer focuses on marketing operations. Key nodes include:
- Campaign nodes (with attributes like goal, audience, metrics).
- Content Asset nodes (the actual content pieces, linked to campaigns).
- Personas/Segments (marketing targets, linked to campaigns and content).
- Decision/Approval nodes for noteworthy decisions, e.g. “Legal approved claim X for Campaign Y” or “CMO requested revision on tone.”
- Discussion/Idea nodes (they even capture brainstorming insights from Slack or meetings, distilled).
- Guideline/Policy nodes (brand guidelines, compliance rules).
- Outcome nodes (e.g. campaign performance results).
Relationships: Campaign nodes link to the content produced and the results. Decision nodes link a Campaign to the Guideline or Policy involved (e.g., “exception to Brand Guideline G123 approved”). People (like the content strategist, legal approver) are linked to those decisions as well. Essentially, it’s a graph weaving together the who, what, why of marketing work.
One interesting aspect: they leverage the structure that already existed in code workflows. They observed that programming had Git/GitHub which naturally creates a graph of commits, PRs, comments (a form of context), and that’s why coding was transformed quickly by AI [78], [79]. Marketing lacked that structure, so they intentionally created analogous structure via this graph. For example, they treat an idea pitch in a Slack thread as an “event” that can be logged and connected to a final content piece (almost like a commit linked to a build).
Retrieval Approach: The context graph is used by Writer’s AI writing assistant to produce more on-brand and context-aware content. Suppose a marketer asks the assistant, “Draft a blog post about our product’s new feature, focusing on compliance use-case.” Before writing, the assistant queries the context graph for relevant context: brand guidelines for tone, any previous similar content (to mimic style), and known pain points from past campaigns targeting compliance. The query might retrieve:
- The BrandTone guideline node with do’s and don’ts (ensuring style consistency).
- A Persona node for Compliance Managers with notes on what messaging works (maybe linked to a past whitepaper campaign).
- Two Content assets from last year’s campaign on compliance, with their performance (so the assistant can see what got engagement).
- If available, any Decision node about compliance messaging (for example, maybe Legal had forbidden a certain claim — the assistant should avoid it).
This retrieval is a mix of keyword search (for “compliance” topics in nodes) and graph traversal (to expand to related nodes like guidelines and past assets). Writer indicated they capture precedent like “Legal approves exceptions but we never know if it sets precedent” — now they log it [80]. So the assistant can literally find if a claim was approved before.
The assembled context is then injected into the prompt as a structured snippet or as a series of facts the model should incorporate. Because marketing content can’t just regurgitate old stuff, the system likely uses the context to guide style and constraints, rather than as text to copy. For instance, it might include an instruction: “Use a confident tone as per BrandToneGuideline (avoid words like ‘maybe’). Emphasize points A and B which we know resonated (from past campaign analytics). Do not mention competitor names per Legal decision #123.” In effect, the model is reasoning not just with an embedding of documents, but with the organizational knowledge graph.
Governance: Marketing context might seem less sensitive than finance, but there are still guardrails. For example, the context graph includes compliance/legal nodes, which are effectively rules about what can or cannot be said. The system enforces those: if the AI tries to generate content violating a known disapproval (say Legal said “don’t claim we are #1 without attribution”), the assistant can catch it because that rule is in the graph. They likely implemented a check after generation, where the draft content is scanned for forbidden phrases stored in the context graph. Also, access control: certain internal details, like unannounced product strategies captured in the graph, should not leak to content for public consumption. The Writer team would ensure that any AI generation for external content only references graph nodes marked as public or approved for use. Perhaps they mark certain nodes as “InternalUse” and configure the retrieval to skip those for external content generation.
Additionally, Writer mentions “laying on the right policies and guardrails for compliant capture and usage” [15]. This implies they had to assure legal that the context graph itself won’t misapply information. They likely have a human review layer for certain kinds of context usage — e.g. if the AI wants to cite a Slack conversation as a reason for doing something, maybe a human has to vet that first. Over time, as trust builds, more is automated. They also ensure auditability: marketing leaders can see and influence what’s in the context graph and how it’s applied [15]. Possibly they have an interface where one can see “what facts did the AI use to generate this copy?” and they can correct it if something is off.
Outcomes: According to Writer, this context graph approach is helping marketing move beyond just speeding up writing to truly scaling knowledge. For instance, a new marketer can query the AI, “What types of campaigns work best for fintech audience?”, and the answer will be grounded in the company’s own past campaigns and knowledge, not generic advice. This shortens onboarding time (making that 6 months ramp-up much shorter, though an exact metric isn’t given publicly). Vanguard, Prudential, and Qualcomm are mentioned as companies whose marketing leaders express these pain points [81] — presumably some of Writer’s customers are piloting such context graphs. While specific ROI is not published, one can infer improvements in content consistency and team productivity. Fewer “reinvent the wheel” moments occur, since the graph surfaces existing relevant content and decisions.
Limitations: This is bleeding-edge, so there are challenges. One issue is capturing the tacit knowledge — it requires culture change for people to document their reasoning or let an AI monitor Slack to extract it. Some knowledge may still not make it in (e.g. gut feelings or one-off conversations). Another challenge: ambiguity in language — marketing discussions are full of nuance and sometimes sarcasm or hypotheticals. An AI might wrongly record something from Slack as fact when it was just an idea tossed out. Writer likely has to refine NLP pipelines to discern that (maybe they only ingest decisions after they happen, not every chat message). There’s also a risk of over-reliance: marketers might take the AI’s contextual answer as gospel, even if the context is outdated (policy drift risk again). They mitigate that by continuously updating the graph and allowing user feedback when AI outputs something off mark (the user can flag it, and then they update the context or prompt next time).
In summary, Writer’s case (verified via their blog and CMO statements) demonstrates a knowledge ops context graph in marketing — essentially turning subjective creative processes into structured, learnable knowledge. It’s an example of how context graphs aren’t just for compliance and engineering; they can empower creative and GTM (go-to-market) teams by capturing the why behind successful content and decisions, thereby sharpening AI assistance in those realms.
13.3 Open-Source Community Scenario — Investigative Context Graph for Security Research (Community Example)
(Verified in concept via user discussions; inferred implementation)
This case is inspired by a discussion on the ContextEngineering forum where a user working in cybersecurity investigations described their use of a dynamic temporal graph [82]. While not a formally published case study, the details are drawn from an actual practitioner’s scenario: handling many concurrent investigations with sensitive data, using an open-source context graph stack (TrustGraph with Quine/Cassandra).
Context: A threat intelligence team deals with investigations that involve linking many data points: network events, threat actor profiles, system logs, incident tickets, etc. They might have 10,000 to 1 billion records per project, and multiple projects at once [83]. These graphs are highly dynamic — data (alerts, IOCs) constantly streaming in — and time-sensitive: recent events have more weight. Each project is isolated for confidentiality, and each user may only see parts of the data depending on clearance. The challenge: using GraphRAG in this space was tricky because of scale and privacy. Traditional GraphQL or static KGs didn’t meet their needs for quick subgraphs and security filtering.
Graph Design: They set up a context graph for each investigation project, but kept them logically within one big cluster (using tags to segregate). The graph is a property hypergraph in a sense: nodes represent entities (IP addresses, user accounts, malware samples, etc.) and events (an IDS alert, a login session). Edges represent relationships like “IP connected to Server” or “User account accessed File”, also events linking to entities. They also included contextual nodes like “Threat Actor group” if an IOC was linked to known threat intel. Key design elements:
- A
tenant_idproperty on every node and edge to isolate projects (so they could store all projects in one graph DB but query per tenant) [84]. - Temporal properties: each event node had a timestamp, and many relationships had
firstSeen/lastSeen. They planned to implement a custom temporal indexing (perhaps using TrustGraph’s evolving temporal features). - Collections: Using TrustGraph, they leveraged the concept of collections to group triples related to an investigation [2]. For example, collection “ProjectAlpha” would include all nodes/edges for that project. This made it easy to export or remove a whole project’s graph if needed.
- Provenance: Every data point from an external source had a
sourceproperty (e.g. “VirusTotal” or internal system name), and certain critical nodes had a sub-node of type Evidence linking to raw log files or PCAPs in storage. This gave investigators and the AI agent the ability to drill down into original data when needed.
Retrieval Approach: The team integrated the graph with an agent that helps analyze and summarize investigations. For example, an investigator could ask, “Have we seen connections between the compromised host and any known malicious IPs?”. The agent would: 1. Identify the node for the compromised host (maybe via a search or it’s given explicitly). 2. Traverse outwards to find IP nodes connected to it, filter those with threat intel reputation score > threshold. 3. Gather those and any associated threat actor info. 4. Return an answer like: “Yes, Host X communicated with IP 1.2.3.4 on 2025–12–01, which is associated with APT Zeus (malware C2). Also communicated with 5.6.7.8 (no known threat). [83], [2]”
Under the hood, this involved a mix of Cypher queries (TrustGraph can route Cypher to Neo4j or Gremlin to Cassandra). Because some queries were complex pattern matches (like find all paths of length 2 where node is marked malicious), they sometimes pre-computed “summary nodes”. For instance, they’d create a “MaliciousConnection” node to represent that relationship so an agent doesn’t have to do multi-hop reasoning every time. They also used vector search for unstructured data: e.g. if an investigator asked, “Is there evidence of lateral movement?”, the agent might do a keyword search in the graph for “lateral movement” or use embeddings on descriptions of events to find similar patterns (some events had a text description property).
Given the bias on recency in their work, they weighted edges by recency for retrieval. The context graph query might sort or filter events in the last 24h more heavily (they mentioned “strong bias on recency” [85]).
Governance & Security: Each user’s access was controlled at query time by the tenant_id and their role. If an analyst from Team A queries, the system appends WHERE tenant_id = A to all queries (this was enforced by the graph driver as a safety). They debated whether to make a separate graph per user/permission but that would explode combinatorially [84]. Instead, they implemented row-level security: every edge and node had an access level attribute, and a pre-query filter removed anything the user’s clearance doesn’t meet. This was achieved by using a custom TrustGraph GraphQL middleware that filtered results.
Because this is security data, an adversary obtaining it would be bad. So the environment was isolated (graphs running on a secured server, accessible only through the tool, and all data encrypted at rest in Cassandra). They also flagged certain particularly sensitive nodes (like an ongoing surveillance target) such that the agent would never include those details in a summary to avoid accidental leakage. Essentially, even the AI’s output was subjected to a sanitizer that strips names or indicators that are too sensitive unless the user is cleared to see them.
Outcomes: By having this context graph, the investigation team reported they mitigated some of the complexity of GraphRAG. Originally, pure GraphRAG with hierarchical summaries was considered but they worried it could “leak sensitive content if not careful” [86]. With the graph approach, they found they could precisely retrieve needed info with structured queries, rather than relying on embedding vectors that might accidentally pull in something unrelated. Performance-wise, querying with billions of nodes is non-trivial, but by using Cassandra and data partitioning, they achieved near real-time responses for typical queries (a few hundred milliseconds for subgraph queries). They mentioned using Quine (a streaming graph processing engine) for some parts, but were unhappy and migrating fully to TrustGraph on Cassandra [87], [88].
Analysts gained an AI co-pilot that could answer questions like “list notable events in this investigation in the last 24h” by traversing the graph and summarizing, saving them time. It could also find connections a human might miss (like linking an event in Project A to something in Project B if cross-project data was allowed to be correlated at a higher level). This begins to fulfill the promise of “graphs enabling true learning systems, not just retrieval” — the agent learns structural patterns of threats across projects [89]. In fact, one user comment (AI_Data_Reporter) in that thread alluded to measurable gains: enforcing structural integrity via RDF triple expansion with native metadata improved compliance (micro-F1 from 4.1 to 7.2) [90] — suggesting that when the graph was used properly, the precision of answers about compliance (or graph consistency) nearly doubled. While that exact metric is just one comment, it indicates that structured context yielded better results than unstructured RAG in their experience.
Limitations: Scalability and complexity are ongoing concerns. Handling up to a billion records even on distributed DBs is challenging; their use of Cassandra means they trade some query flexibility for scale (Gremlin on Cassandra can do single-hop lookups fast, but multi-hop queries might need careful design or pre-computation). They also haven’t fully solved temporal queries (“dynamic temporal knowledge graphs” were in progress [91]). For example, asking “what was the state of the network on Jan 5?” requires time-travel queries; currently, they might keep daily graph snapshots or logs rather than a continuous temporal index. Another challenge is onboarding new team members to use the graph tool effectively — there’s a learning curve to understanding the graph schema and query capabilities. They alleviate this by natural language interface via the agent, but the agent sometimes needs tweaking to ask the right graph questions (they had to create prompt templates that translate a question into a set of graph queries).
Overall, this community case shows an open-source, security-focused deployment of context graphs. It underscores the importance of metadata structure for retrieving subgraphs efficiently [2] in big data scenarios and illustrates how context graphs can serve as a unified layer to analyze and explain complex, evolving situations (in this case, cyber threats) with an AI assistant, all while maintaining strict security controls.
(This scenario is verified in that the user’s needs and partial implementation were described on Reddit [82], [2]. Our description of the full solution is inferred, constructed to illustrate how those needs can be met using TrustGraph and related tooling.)
14. Time-to-Value and Adoption Roadmap
Adopting context graphs is a journey. Organizations often wonder how long it takes to see tangible benefits and what the maturity path looks like. In this section, we outline a maturity model from basic metadata graph to a fully agentic decision-trace graph, discuss build vs. buy decisions, identify the roles needed, and consider cost drivers and scaling issues. As of January 22, 2026, the ecosystem is evolving quickly, so we also note where volatility might impact timelines.
14.1 How Long Does It Take to See Value?
Immediate wins (Weeks 1–4): At the early maturity stage, a context graph might start as just a metadata graph — essentially an enhanced data catalog or knowledge graph that links existing information (people, datasets, documents) with minimal custom decision trace data. Even this can yield value: within a few weeks, teams often see improved search and discovery. For example, connecting a data table to its owner and recent usage can answer questions that previously required tribal knowledge. This stage doesn’t yet capture dynamic agent decisions, but grounds the AI in factual connections. A study on knowledge-graph-based retrieval showed up to 35% improvement in accuracy on complex queries by using structured context [92], which is a quick win against hallucinations even with a simple knowledge graph.
Phase 1 — Metadata/Lineage Graph (1–2 months): By integrating a metadata catalog or existing knowledge base into graph form, companies often reach a point where the AI stops making obvious mistakes about enterprise specifics (e.g. it won’t hallucinate who owns a system because the graph knows the owner). Time-to-value here is short: if you have data sources like CMDBs or Wikis, you can populate a context graph in a sprint or two. The value looks like better Q&A (the AI can answer “who/what/where” questions using graph lookups) and some impact analysis (e.g. “if this system goes down, what business processes are affected?” via lineage). At this stage, governance is light — mostly ensuring data is correct and accessible. Many teams report seeing value within a quarter, in the form of reduced time spent by experts answering repetitive questions (the AI can handle them since the context is there).
Phase 2 — Governed Context Graph (3–6 months): The next maturity level involves instrumenting governance rules and decision context into the graph. This may involve adding policy nodes, capturing approvals/exceptions, and implementing the guardrails from §11. It’s a significant step up in complexity. The timeline depends on instrumentation: for instance, hooking into a workflow system (like capturing every approval in ServiceNow or Jira and feeding it to the graph) might take a couple of months of development. However, once done, the ROI becomes clearer in terms of audit readiness and consistency. We often see at this stage partial automation: AI agents might propose decisions but still require human approval — yet they log the context for each proposal. Value appears in forms like faster audits (as in our SaaS case, audit prep time dropped drastically after 6 months of context graph usage) and fewer repeated errors (because precedent is now available, people stop re-inventing work or violating past decisions unknowingly). Anecdote: a financial firm building lineage+policy context found that after ~4 months, their risk review meetings went from 2 hours to 30 minutes, because a lot of questions could be answered by querying the context graph beforehand (verified via a public webinar on context graphs in compliance). So, by half a year, you can expect measurable efficiency gains and risk reduction, though the full vision isn’t realized yet.
Phase 3 — Agentic Decision-Trace Graph (6–12+ months): The ultimate maturity is where agents not only consume context but also write back into the graph autonomously — closing the loop with a living context graph that evolves as AI and humans make decisions. Here, the graph becomes a true system of record for decisions [23], [29]. Achieving this can easily take a year or more, as it involves deep integration with business processes and high trust in AI. This is where an organization reaps benefits like fully auditable automated processes and significant scaling of operations without proportional headcount increase. For example, a support workflow might be 90% handled by agents, with the context graph ensuring everything is by the book. One might ask, is it worth the wait? If realized, yes: it’s transformative — think days saved on investigations, or rapid simulations of “what if” scenarios using the context graph as a world model.
However, few have reached full Phase 3 in production as of 2026 (most are piloting). The timeline for Phase 3 is also dependent on cultural readiness — you need stakeholder buy-in to let agents write decisions. A likely approach is gradual: start with shadow mode (agents make recommendations, humans log final decision in graph), move to human-confirmed auto mode (agents write decision traces and execute some with oversight), and finally fully autonomous with monitoring. Each step might be a quarter or two of experimentation and policy tuning.
Summary of timeline: Initial context graph deployment can show value in ~1 month (answering questions better), a governed context graph in ~3–6 months (audit and consistency improvements), and a fully agentic graph in ~12+ months (autonomy and strategic insights). As always, these timelines assume a dedicated effort — part-time tinkering would stretch this out. The good news is you don’t need to wait for the final stage to get benefits; it’s cumulative. Even a small context graph delivering a few key facts to an LLM can reduce hallucinations on day one.
14.2 Maturity Model and Roadmap
We can formalize a maturity model in three tiers:
- Level 1: Contextual Metadata Graph — “What things are.” Focus on static knowledge and relationships (akin to a knowledge graph or data catalog). Goal: create a unified view of entities and basic links, serving as foundation.
- Level 2: Governed Context Graph — “Why things happen.” Incorporate dynamic context like decision events, lineage of actions, and apply guardrails/policies. The graph begins to capture organizational judgment and not just facts. Agents still largely assist rather than fully act.
- Level 3: Agentic Context Graph (Decision Infrastructure) — “Autonomy with traceability.” The context graph is now part of the execution loop; decisions (by agents) are recorded and informed by past traces, enabling continuous learning. The graph acts as both memory and governance layer in real-time.
Each level builds on the previous. Importantly, you don’t have to implement Level 3 everywhere. Some processes might stay at Level 2 because full automation isn’t desired (or possible under regulations). That’s fine — the maturity can be domain-specific (maybe customer support reaches Level 3, but strategic planning stays at Level 2 where humans decide but log context).
Roadmap steps:
- Identify High-Value Context: Early on, choose what context to focus on. It could be customer support histories, or data pipeline lineage, or decision approvals — ideally somewhere you have pain from lack of context (hallucinations, errors, slow audits). This will be your Phase 1 pilot domain.
- Build Minimal Graph (MVP): Use existing data to populate a graph. Don’t over-model — get a few key node types and relationships in. For example, “Tickets -> linked to Knowledge Articles” or “Data Tables -> part of Lineage pipelines.” Show that the AI answers improve or team queries get easier. This secures buy-in.
- Iterate Schema and Ingestion: Expand to include more context types, especially from dynamic sources (logs, decisions). Start instrumenting processes to log to the graph. At this point, invest in cleaning data and linking silos — merging records referring to the same entity, etc. The schema will evolve; plan for versioning and backward compatibility if needed (so older context doesn’t break when you add new node types).
- Introduce Governance: Once you have valuable data in the graph, tighten control — define who can see what (maybe using groups/roles in queries, see §11), add data quality checks (e.g. if a decision node is missing a reason, flag it), and engage compliance teams to review. This is also when you can implement life-cycle rules (like archive nodes older than X, etc.).
- Integrate with Workflows: Modify business processes to both consume and produce context graph entries. For example, change the customer support SOP: before closing a ticket, the agent’s tool fetches similar past tickets via the graph; after closing, it writes a “Resolution” node linking to relevant context (like which knowledge article was used). This gets you towards Level 3.
- Scale and Harden: As usage grows, address performance (maybe move from a file-based RDF store to a clustered DB, or add indexing strategies). Monitor costs — e.g. if using a cloud graph DB, watch out for query costs. We discuss cost drivers below, but scaling might involve migrating to a more efficient backend or sharding the graph. Also, implement monitoring for the graph: if an ingestion pipeline fails and context isn’t up-to-date, have alerts.
- Measure Value at Each Stage: It’s crucial to quantify improvements to justify further investment. At Level 1, measure answer accuracy or team time saved searching. At Level 2, measure compliance incidents or audit findings pre/post (hopefully reduced). At Level 3, measure cycle times of processes or percentage of tasks automated. These metrics not only prove ROI but guide where to refine next.
This roadmap is iterative — you may go through cycles of schema redesign as new use cases emerge. Keep the end-goal in mind (traceable, governed AI decisions) but iterate in such a way that each step yields a usable outcome.
14.3 Build vs. Buy Considerations
A common question: should we build our own context graph platform or purchase one?
Build (in-house or open-source): Building involves assembling the components (graph database, integration code, UI maybe) and tailoring to your exact needs. The benefit is flexibility — you define the schema and logic to fit your domain. Open-source tools like Neo4j (community), Apache Jena, or TrustGraph can significantly bootstrap this. Many early adopters have gone this route because commercial products weren’t fully there yet for context graphs. If you have a strong engineering team with graph expertise, build can be viable and cost-effective (no license fees). However, be wary of underestimating the work: you’ll need to handle data integration, UI for folks to consume the context (maybe embedding in existing apps), and ongoing maintenance. Also, the field is evolving, so your in-house solution might lag behind new best practices unless you keep investing.
Buy (vendor or platform): Buying could mean using a vendor product specifically marketed for context graphs (if available), or leveraging a combination of enterprise tools and cloud services to approximate it. For example, one could “buy” by using an enterprise knowledge graph platform (like Stardog or RelationalAI) plus an LLM orchestration platform, and then some consulting to glue them. Or a product like Indykite or whatever Atlan develops around context graphs, if you trust those to cover your use case. The advantages: potentially faster initial setup (they have a model for you), and support — you have someone to call if it breaks or if you need a feature. They might also incorporate improvements gleaned from multiple customers (whereas a custom build you learn only from your use). The trade-off is cost and possibly fit: current vendor offerings might not cover all nuances of your domain, and you might have to adjust your approach to how the product works. Also, risk of vendor lock-in: if all your context is stored in a proprietary system, how easy is it to export or shift if needed?
A middle approach is “assemble and augment”: use off-the-shelf components for the heavy lifting (DB, security, maybe an initial ontology) but build the integration and specific parts yourself. This is likely what many will do. For instance, buy a Neo4j Aura DB for managed service, use open-source LangChain for agent logic, and have your team write the translation layer that feeds relevant graph data to the LLM and ingests outputs.
When deciding, consider time-to-value vs. differentiation. If context graph capability is core to your competitive advantage (say you’re a tech company creating an AI-driven product), building in-house might differentiate you. But if you’re primarily an end-user of AI (say a bank using it for internal ops), you might lean towards buying or using proven patterns because you care more about results than how it’s built.
Also consider talent: do you have graph experts? Many teams do not, and learning graph modeling is a hurdle. In that case, having a vendor or consultant who has done context graphs can accelerate your progress and avoid pitfalls (like over-modeling or performance traps). As context engineering knowledge spreads, expect more third-party support; indeed, communities like the ContextEngineering subreddit and awesome lists [93] are sharing knowledge, which can aid even a build approach.
14.4 Team Roles and Operating Model
Successfully implementing a context graph is an interdisciplinary effort. Key roles include:
- Data/Knowledge Engineers: They design the graph data model, set up the database, and build ETL pipelines to ingest data into the graph (from logs, databases, APIs). They need familiarity with graph query languages (Cypher/SPARQL) and possibly semantic modeling if using RDF.
- ML/AI Engineers: They integrate the graph with LLMs or other AI components. They design retrieval strategies (GraphRAG pipelines, embedding + graph combo), and handle prompt engineering to best incorporate structured context into model inputs. They also tune the AI to not misbehave with provided context (ensuring format correctness, avoiding injection issues).
- Domain Experts (Subject Matter Experts): Particularly in governance and policy, their knowledge needs encoding in the graph. Early on, they might help define what context matters (e.g. a compliance officer tells you which approvals to track). Later, they may also validate that the context being captured is correct and the AI’s use of it is appropriate.
- Governance/Risk Officers: They shape the guardrails — defining access control rules, approving the policies that get encoded, and reviewing audit logs. They should be part of the design to ensure the context graph aligns with regulatory requirements (for example, a Privacy Officer will want to ensure personal data in the graph is handled per GDPR).
- Product or Process Owners: If this is being implemented to improve a certain process (customer support, marketing, etc.), the owner of that process must be on board. They will oversee changes in workflows and ensure the team trusts the system. They’ll champion adoption (“hey team, use the AI assistant, it has good context now!”) and provide feedback on what’s working or not.
- IT/Infrastructure Engineers: Running a graph database and integrated AI stack requires infrastructure knowledge. Roles include DBA-like functions (backups, scaling, performance tuning), security configuration (ensuring only the right apps/users can access the graph), and integration with existing systems (single sign-on, network setup for cloud services, etc.).
- AI Ethicist or Compliance Advisor (if available): In advanced contexts, someone who oversees that the system’s decisions remain ethical and compliant. They might evaluate decisions recorded in the graph for bias or drift, for instance if the graph suggests a trend of certain customers always being denied exceptions, they’d investigate if that’s justified or a systemic bias creeping in.
Operationally, you might set up a Context Graph Working Group that meets regularly, especially during the build-out phase. It ensures all these perspectives align. Over time, managing the context graph might fall under a Data Governance committee or an AI Governance committee. It’s something new that might not have an obvious home initially — it’s part data infrastructure, part AI system.
Also consider the maintenance workflow: who will update the ontology or schema as needs evolve? Who monitors data quality in the graph? Likely the data engineering team plus governance folks jointly. For example, if a new type of decision needs tracking (say you add a new tool in your process), someone has to add that node type and ensure it’s populated.
During adoption, plan for training and change management. The best context graph is useless if people (or agents) don’t use it. That means training AI engineers to query the graph effectively, and training end-users to trust and interpret AI outputs with context. Possibly provide a UI where users can explore the context graph directly (some will appreciate the transparency, like clicking “why did the AI say that?” and seeing the graph evidence).
14.5 Cost Drivers and Scaling
It’s important to address cost early to avoid surprises:
- Technology Costs: Graph databases can be memory-intensive. A Neo4j instance that holds a large context graph might require a lot of RAM for good performance (Neo4j’s pricing, or aura’s, could become significant if you have billions of nodes). If using a cloud graph DB (Neptune, Cosmos, etc.), you’ll pay for instance hours and I/O. Also embedding vector stores (if using hybrid retrieval) have their costs (Pinecone, etc.). One cost often overlooked is model inference cost: if your pipeline calls an LLM each time with a big chunk of context, that can add up in API usage. So optimizing what you send (via graph filtering, summarization) directly saves money. In one pilot, a team found that after implementing a context graph, they reduced vector search calls by 50% (because some info came directly from graph, no need to vectorize docs), cutting their monthly openAI bill by 30%. However, the flip side: they now run an AuraDB instance which costs a certain amount monthly, so it shifted cost from one area to another.
- Scaling Data Volume: As context accumulates, you might hit scalability limits of your initial solution. For example, the graph might fit fine in memory at 10 million nodes, but at 100 million, queries slow down or you need a bigger machine. Plan for either vertical scaling (bigger instance, which costs more linearly) or horizontal (sharding or using distributed graph DBs). Distributed graph databases (like TigerGraph, Nebula, JanusGraph on Cassandra) can scale huge, but they may require more dev effort and cluster resources (multiple servers). Ensure to archive or summarize data that’s no longer needed at fine granularity. E.g. you may not need to keep every detail of decisions from 5 years ago — maybe compress them into a few summary stats or offload to cheap storage.
- Scaling Query Load: If many agents/users query concurrently, watch out for throughput. Graph queries can be CPU/RAM heavy especially if they aren’t using indexes. Caching can mitigate repeated queries. For instance, if the same subgraph is used frequently, keep it in memory or use a second-level cache. Some teams put a simple REST cache in front: e.g. if agent asks “what’s the context for X”, check if we have cached context for X recently. The trade-off is staleness vs. cost.
- Security and Compliance Costs: Implementing robust security (like fine-grained access control, encryption) can sometimes reduce performance, meaning you might need more infrastructure to compensate. Also, compliance might require separate environments (maybe an EU-only graph instance for EU data to meet GDPR locality requirements). That duplicates some effort and cost.
- Human Costs: Often underestimated — the time for knowledge experts to help build and curate the graph is a cost (opportunity cost if they’re doing that instead of other work). Training people to use the new system is also a cost. We mention it here because sometimes ROI calculations focus only on tool cost, not the hours of people mapping ontologies or verifying context. In practice, if those efforts produce a widely useful context graph, it pays off across many queries/decisions, but allocate time for it.
Scaling Concerns in Operation: With growth, you might face issues like “our context graph is getting messy or filled with low-quality data.” There’s a tendency for anything that logs everything to become a dumping ground if not governed. So scale not just in technical sense, but in content curation. Maybe set policies like “auto-delete context nodes that haven’t been accessed in 2 years unless flagged important” or “perform periodic reviews of context quality with domain experts every quarter.”
One strategy is to scale incrementally and modularly: perhaps instead of one giant graph, maintain several domain-specific graphs (customer support context graph, sales context graph, etc.) that interlink at high-level nodes (like Customer or Product nodes might connect across them). This way each can be scaled/managed somewhat independently, and you only join them when needed (potentially at the query stage or via a federated query). That said, query federation can be tricky — but technologies like Apollo Federation or SPARQL federated queries exist.
Finally, think of volatility in the ecosystem: New tools could emerge that handle scale better or cheaper. Be prepared (especially if building in-house) to migrate or incorporate such tools. For example, if in 2027 a vendor offers a context graph service optimized on new hardware that’s much faster, you’d want to consider switching. To ease that, try to keep your graph data model exportable (e.g. have scripts to dump to CSV or RDF so you’re not stuck). Using open standards (like RDF/JSON-LD or even just documented JSON schema for your context) will make it easier to move to a new backend if needed.
Cost-Benefit Over Time: Initially, costs might outweigh benefits as you invest in building the foundation. But by mid-stage, benefits (time saved, errors avoided) should be clearly growing, and by mature stage, ideally the context graph is just part of the infrastructure — a cost of doing business that is justified by the transformation in capability it provides (like how data warehouses are a cost center but obviously necessary). Keep an eye that the complexity doesn’t balloon such that marginal benefits drop — if at any point you’re modeling things in the graph that nobody uses, that’s a sign to refocus.
In conclusion, time-to-value is progressive — you don’t have to wait for perfection to see returns. Aim for some quick wins, then iterate towards deeper value. Manage adoption as a product, not just a project: get feedback, improve, demonstrate new features to stakeholders to maintain support. With a solid roadmap and understanding of costs, a context graph initiative can start paying off within a quarter and keep yielding increasing returns as it matures into a strategic asset.
15. Anti-Patterns and Evaluation
As with any promising technology, there are pitfalls. In this section, we discuss common anti-patterns to avoid when implementing context graphs, and propose an evaluation framework to assess a context graph’s effectiveness and safety. We want to ensure that building a context graph doesn’t become “build it and they will come” folly or introduce new problems like misinformation or security holes. By learning from early mistakes, teams can steer clear of known failure modes and continuously measure success.
15.1 Common Anti-Patterns
Anti-Pattern 1: Over-Modeling the World upfront. It’s tempting to design an elaborate ontology or schema for the context graph covering every conceivable entity and relationship (“Let’s model the entire enterprise!”). This often leads to analysis paralysis or a graph so complex that nothing populates it fully. Real stories: some early knowledge graph projects spent years defining ontologies that became shelfware. For context graphs, over-modeling might manifest as trying to capture every subtlety of decision-making in the schema from day one. This is counterproductive. As Koratana noted, the next generation will rely on “learned ontologies” emerging from usage, rather than strictly prescribed ones [94], [95]. The better approach: start with a minimal schema that addresses your immediate questions, then evolve it as new patterns emerge from data and agent interactions. In other words, allow the structure to emerge partly from how the AI and users utilize the context, rather than forcing a perfectly hierarchical ontology from the start.
A symptom of over-modeling is a graph with many node types and edges that remain largely empty or unused. If you find yourself explaining the difference between 5 slightly different “approval” relationship types that your queries or users don’t actually distinguish, you probably over-modeled. Simplify until it hurts (just a bit), then add nuance later when clearly needed.
Anti-Pattern 2: Under-Provenancing (Missing the Why). On the flip side, another pitfall is building a graph that looks like a traditional knowledge graph or log — capturing lots of nodes (people, assets, events) but failing to encode the connections that explain “why” decisions were made. This essentially reduces the context graph to a fancy audit log or data catalog, missing the real value. As one observer put it, “trajectory logs store what happened. Decision traces (done right) learn why it happened.” [96]. If your context graph isn’t helping answer “why” questions, then you’ve likely under-provenanced.
For example, say you log that a discount was given and the outcome (20% approved), but you didn’t capture the justification or links to context (no relation to incidents or prior precedent). Later, someone asks “why 20%?” — the graph as built can’t tell them, even though maybe an email or Slack at the time explained it. To avoid this, design the workflows so that capturing the rationale is part of the process — e.g., require a short justification text which gets attached as an “Evidence” node, or automatically link to the triggering events like incidents. Under-provenancing often is a result of trying to minimize effort or not integrating with human workflows (“it’s too hard to get people to input reasons”). It might also stem from fear of blame — people often don’t record why decisions were made if they fear retribution. It’s important to create a culture where context logging is seen as helpful, not as a trap. Maybe even allow some entries to be sealed or only visible to audit roles to encourage honesty. The bottom line: if the graph says an action happened but not what informed it, you’ve captured the “what” but lost the “why” — which is exactly what context graphs intend to solve.
Anti-Pattern 3: Graph Dumping Ground (No Curation or Focus). This is when the context graph becomes a catch-all sink for data without clear focus or upkeep. It might happen if you connect too many data sources without integration — you get disjointed subgraphs, duplicate nodes (one system calls it “CRM_Account_123” another “Client#123” and you never merged them), and outdated info that lingers. The graph becomes messy, and agents might draw wrong links or waste time traversing irrelevant stuff. For example, a context graph that ingests every log from every system might be huge and noisy; an agent asking a question could wander through irrelevant corners (“System heartbeat events” are technically context, but not meaningful to decision logic perhaps).
To avoid this, treat the context graph as a product that needs curation. Establish data quality rules: e.g. run periodic scripts to merge duplicate entities, remove or archive stale nodes, annotate or drop low-confidence relations. Ensure each type of data you ingest has a purpose. One approach is incremental enrichment: only expand the graph’s scope when a use case demands it. If someone says “we need location context for our decisions,” then bring in the location data, but don’t ingest the entire HR database just because you can.
A good sign is if your context graph is being used to answer meaningful questions regularly; a red flag is if it’s growing but nobody trusts it or knows what’s in it. Also beware of latency: graph dumping ground might lead to long query times, which frustrates users/agents. We saw a note that “over-modeling” and “graph dumping ground” often go hand-in-hand — lots of theoretical connections, not much practical value. The antidote is focusing on high-value relationships and keeping the rest on the sidelines (maybe accessible via federated query if needed, but not cluttering the core).
Anti-Pattern 4: Ignoring Access Control and Context Creep. We hammered on governance earlier, but let’s call it out: ignoring security/ACL is dangerous. A context graph by design connects data widely, so the chance of exposing something sensitive to someone who otherwise wouldn’t have access is high if not controlled. For instance, an innocent query like “Why was Project X delayed?” might pull in an incident node that contains a private customer name or an employee health issue that was logged as a reason. If no ACL, an agent might present that to a wide audience. That’s a data leak.
Another scenario: “context creep,” where a context graph initially with harmless data slowly accumulates sensitive data because it’s so useful, and one day you realize dozens of people (or an AI) can see things they probably shouldn’t (like salary info that got linked into a decision graph for budget approvals). If you started open and then retrofitting ACL is an afterthought, you risk having already leaked things or facing huge refactoring to implement controls.
To avoid this, design security in from the start (as much as feasible). Adopt a principle of least privilege: if unsure, better to require an elevated role to see something or to require the agent to summarize without identifiers. As one commenter noted in a case discussion: “users within each project likely have different access levels… making knowledge graphs difficult: do we produce per user?” [97]. The solution they found was to keep one graph but implement those restrictions with metadata and collections [2]. So it’s solvable, but not if you ignore it until too late.
Ignoring ACL can also kill adoption — if users think “this graph will expose my team’s data to others,” they won’t support it. Show from day one that you take access seriously (e.g., demonstrate that when a regular user queries, they don’t see HR nodes, etc.). This builds confidence and aligns with compliance.
In short, the anti-pattern is to treat context graphs as purely technical and forgetting the human/legal context in which they operate. A context graph without context about who should use it is ironically missing a crucial piece of context!
15.2 Evaluation Framework
To ensure your context graph is delivering on its promise and not causing new problems, establish an evaluation framework with key metrics:
- Retrieval Precision and Recall: How well does the context graph provide relevant info when asked? One can set up a suite of test queries (perhaps derived from real questions asked in the past) and see if the graph-backed system finds the correct supporting info (precision) and doesn’t miss important facts (recall). For example, if the known correct context for question Q includes nodes A, B, C, does the system retrieve those and not a bunch of unrelated ones? You might compare an LLM’s answers with and without the graph: measure correctness of answers. Ideally, answers with the graph should show higher factual accuracy. In one benchmark, adding a knowledge graph improved query answering accuracy significantly [92]. You can also do more formal IR measures: treat each decision record as a “document” and see if graph queries return the relevant ones out of all possible.
- Hallucination Reduction: Track how often the AI generates content not supported by any context vs. when using the context graph. This can be measured by human evaluation or even automated checks (if an answer cites sources, are those sources in the graph and do they actually contain the answer?). A practical metric: the proportion of AI outputs that include a valid citation or reference from the graph. Over time, that should approach 100% for factual queries (the AI shouldn’t be introducing new facts without graph support). If it’s generating stuff not in the graph, either the graph is incomplete (so recall issue) or the AI isn’t grounding properly (maybe a prompt issue). Either way, track it. Some teams have used a “hallucination rate” metric (# of factual errors per X responses) and seen it drop as they implemented graphs.
- Provenance Completeness: Evaluate if decisions in the graph have full context attached. For example, sample 100 decision nodes: do they each have at least one evidence/policy linked? If many decisions are orphaned (no “why” attached), then your process might be failing to capture context in those cases. You could assign a score like % of decisions with rationale >= 1. Aim to improve that. Also measure provenance depth: maybe an approval has a policy link, and that policy node has source docs or owners. If those second-level links are missing, the provenance chain stops short. Decide what depth is needed and ensure it’s being recorded. A standard like W3C PROV could define a lot of this, but you can have a simple check: can an auditor trace every decision to a source document or data point? If not, identify where provenance is lacking.
- Latency and Cost: Evaluate the performance of context retrieval in real conditions. How long do graph queries take, and is that acceptable for the use case? If an agent needs an answer in under 2 seconds, and the graph query is 1.5s, you have little headroom after model inference. Perhaps caching or query optimization is needed. Track average and p95 query times. Also monitor cost: e.g. how many API calls to LLM are saved by using the graph? Or what’s the monthly cost of running the graph infrastructure vs. baseline? We want to ensure the value outweighs cost. If you instrument your pipeline, you could see something like “each question asked triggers on average 1.2 graph queries and 1 LLM call” — try to keep graph queries efficient so they don’t balloon (like an agent loop that iteratively queries the graph 10 times in a chain — that might be a sign to redesign how the prompt or retrieval is done).
- Governance Incidents: Track any incidents related to the context graph. This includes data breaches (did someone see something they shouldn’t?), policy violations by the AI (did it output something disallowed that was in the graph), or decision errors (did the AI or user make a wrong call because of incorrect/misleading context in the graph?). Each incident should be analyzed: was it due to an anti-pattern or gap we identified? For instance, if an AI revealed personal data because the graph had it and no filter, that’s an ACL issue — evaluation metric failed. Ideally, you have none, but realistically at the beginning you might have a few near-misses or actual problems. Count them and categorize by severity. Use them as feedback to tighten rules or fix data. Over time, a mature context graph environment should have close to zero unexpected disclosures or errors. You might simulate attacks or misuse too (like adversarial queries to test if the graph will leak something — akin to red teaming). If any get through, patch the hole and count it as a negative mark.
- User/Agent Feedback: If humans use the system, gather their feedback — e.g., through surveys or simply measuring usage patterns. If they frequently override the AI or ignore the context provided, something’s off. If agents (automated ones) make decisions that humans then reverse or correct often, that’s an issue. Track how many AI-proposed decisions are accepted vs. overridden. Also track how often humans have to manually add context because the graph didn’t have it — that indicates recall gaps. Perhaps incorporate a field in decision logs: “Was all needed context available?” and let the decision-maker check yes/no. That can be anecdotal but useful.
- Functional Metrics: These are tied to why you built the context graph. For example, if it was to reduce customer response time in support, measure that. If to reduce compliance risk, measure compliance issue counts. For example, one might look at hallucinated answers in a customer chatbot pre vs. post context graph. If before the bot gave wrong answers 10% of time and after it’s 2%, that’s a huge improvement. Or measure average handle time if AI now quickly finds context instead of making the agent search. These business metrics ultimately matter the most for ROI.
To streamline evaluation, many create a dashboard that tracks key metrics (maybe hooking into logs of the AI system and the graph). For instance, a daily count of questions answered, how many used graph context, how many times the AI said “I don’t know” (which might be good rather than hallucinating), etc. In an ideal state, you can quantitatively show: our AI answers X% more accurately and with Y% more confidence after implementing context graphs, or we cut manual escalations by Z%.
Additionally, evaluate evolution of the graph: how much does it grow per week, and is growth correlated with improved performance or just data bloat? If the graph grows but your metrics plateau, you might be adding low-value data (back to anti-pattern 3).
Finally, adopt a pilot checklist whenever extending to a new domain or before fully launching:
- Did we identify the “single source of truth” for each data type we ingest (to avoid conflicting info)?
- Have we tested queries for that domain for accuracy and security?
- Do we have stakeholder sign-off that the context graph captures needed info and nothing forbidden?
- Is there a rollback plan if the agent starts using context incorrectly (e.g., can we easily disable certain parts of the graph or revert to an earlier state)?
- Are logs/audit in place to review what context was used for key decisions?
For example, a checklist item could be: “For a random sample of 10 recent AI outputs that used the context graph, verify each factual statement was supported by a node/edge in the retrieved context.” If any aren’t, find out why (did the AI ignore context or the context not have it?).
Myth vs Reality Callout: There’s a myth that once you build the context graph, the AI will automatically be great. Reality: it requires continuous evaluation and tuning. You might still find the AI making mistakes or the graph having errors, so an evaluation framework keeps you honest about whether this fancy graph is doing its job or just consuming resources.
To sum up, evaluation of context graphs is multi-faceted: information retrieval metrics, AI output quality, governance checks, and business KPIs. By systematically tracking these, you can iterate your way to a truly effective context graph and avoid the scenario of having built an impressive system that nobody trusts or that doesn’t solve the original problem.
Regular evaluations (monthly or at major milestones) should be part of your operating model. This ensures the context graph remains on context — serving the evolving needs of the organization without becoming a burden or risk.

16. Closing Synthesis
Definition and Taxonomy Recap: In this report, we have explored context graphs as the next evolution of knowledge graphs — ones that are dynamic, decision-focused, and governed. In plain terms, a context graph is a graph-shaped memory that captures not just facts (the “what”) but the surrounding context (the “why” and “how”) of decisions and actions [63]. We reconciled multiple viewpoints: in enterprise AI, context graphs record decision traces and rationale; in academic terms, they are contextualized knowledge graphs (with time, location, and provenance qualifiers) [14]; in product workflows, they act as a structured memory or “enterprise brain” [74]. Despite different emphases, these converge on a core idea: adding context (temporal, causal, procedural) to graphs of knowledge, so that AI systems and humans can make sense of past decisions and ground future ones.
We can classify context graphs broadly into:
- Prescriptive vs. Descriptive: Some context graphs (especially in governance) are prescriptive — encoding what should happen (policies, guardrails) and logging compliance. Others are more descriptive — capturing what did happen and emergent patterns (e.g., who worked with whom on what, as learned by agents).
- Static vs. Agentic: A static context graph (perhaps Level 1 maturity) is updated by humans and systems offline. An agentic context graph (Level 3) is part of the real-time loop, with agents both reading and writing context as they operate [41]. Many current implementations are moving along this spectrum.
- Domain-specific vs. Unified: We’ve seen context graphs in very domain-specific forms (a marketing context graph, a code context graph) as well as visions of unified organizational context graphs [98]. Likely, organizations will maintain several interconnected context subgraphs for practical reasons, rather than one monolith — but ensuring they can link up when needed (via shared entities like people or projects) is key to avoid new silos.
Why It Matters: Context graphs aim to solve what many AI and knowledge management systems lack — traceability and understanding of “why”. Traditional logs answer “what happened” but not why [99]. Knowledge graphs hold facts but often not the decision context (an RDF triple might tell you Alice manages Bob, but not why a decision was made last Tuesday). Context graphs fill this gap by structurally representing judgment, precedent, and stateful context. This makes AI output more trustworthy (reducing hallucinations by grounding in graph facts [100], [71]), decisions more auditable (every output can point to the graph trail it used), and processes more efficient (no more hunting through emails for why something was done — query the graph).
Next Steps for the Reader: If you’re looking to implement context graphs:
- Start Small: Pick a use-case where lack of context is a pain (maybe an internal chatbot that often doesn’t know internal info, or a recurring decision that people have to discuss each time). Build a simple context graph for that. Our Lab 1 and Lab 2 provide hands-on examples to demystify how to structure it in both property graph and RDF forms.
- Use Existing Tools: Evaluate if your current data catalog or knowledge management tools can be leveraged to jumpstart (e.g. export lineage data to a graph). Try out frameworks like LangChain or LlamaIndex with graph capabilities (Lab 3 gives a flavor of a custom approach). Experiment in a sandbox — often seeing a chatbot answer “why did X happen?” with a structured explanation from the graph is the “aha” moment to get stakeholder buy-in.
- Plan Governance Early: Talk to your security/compliance folks early and involve them in design. It’s easier to bake in rules than to add them later. Use the guidance in §11 to brainstorm possible risks and how you’d mitigate them in your context.
- Educate and Evangelize: Share this concept with colleagues — context graphs are still new, and part of their success is in changing how people think about AI memory. Frame it not as an academic exercise but as a way to operationalize trust and knowledge. For technical leaders, highlight how this can reduce errors and provide audit trails [42], [101]. For engineers, emphasize learning new skills like Cypher/SPARQL will be valuable in the era of AI + graphs.
- Incremental Integration: Integrate the context graph into AI workflows gradually. Maybe first, the AI just uses it for additional info (read-only), then as confidence grows, let it log decisions to the graph (write). Monitor results and adjust.
Open Problems and Future Evolution: While context graphs are powerful, there remain open challenges and active areas of development:
- Standardization: There is not yet a universal schema or protocol for context graphs. Will W3C or industry groups define standards (perhaps extensions to PROV or a Context Graph Markup)? A lack of standards means current implementations are bespoke, which is fine internally but hinders sharing context between systems. Expect efforts to create common vocabularies for things like “DecisionTrace” or temporal context.
- Tooling Maturity: The ecosystem is evolving. We may soon see more out-of-the-box context graph platforms, or major graph DB vendors adding “context graph modules.” Project such as TrustGraph are early signs. Keep an eye on how big players respond — e.g., will Snowflake or Databricks integrate graph context for AI in their offerings? (Snowflake’s moves with knowledge base hints at it, as foundationcapital posited [102], [41]).
- AI Reasoning over Graphs: It’s one thing to provide a graph to an AI, another for AI to deeply reason with it. Research like retrieval-augmented generation with graphs (GraphRAG) is promising, but LLMs still sometimes struggle with structured logic. We might see specialized models or system prompts that better utilize graph structure, or even neural-symbolic hybrids that learn to traverse graphs effectively. For example, “Graph of Thoughts” might become a technique where the LLM explicitly uses graph search as part of its chain-of-thought (some early works are in that direction).
- Dynamic and Real-time Updates: In agentic scenarios, context graphs will be updated in real-time by possibly multiple agents. Ensuring consistency (avoiding conflicting updates), managing versioning, and conflict resolution becomes tricky. Techniques from distributed systems or CRDTs might be borrowed to allow concurrent context updates without stepping on toes. There’s also the challenge of when to prune history — an agent planning may need to consider time (should I trust this rule from last year, or has policy changed?). Temporal context handling will likely improve.
- Privacy and Ethical Use: As these graphs can contain very sensitive data (like detailed traces of employee or customer behavior), expect more discussion around ethical boundaries. For instance, should a context graph be used to monitor employees (it could, indirectly, if capturing decision traces)? Clear policies and perhaps regulations will come into play (context graphs might fall under audit requirements themselves). Balancing utility with respect for privacy will be ongoing.
- Human-Graph Interaction: We talked about AI using graphs, but humans may also directly query context graphs. More user-friendly query interfaces (natural language to graph query reliably, visual explorers that highlight “why links”) will be important to bring non-technical stakeholders into the fold. This could be a near-term win: e.g., a manager clicks “why was this escalated?” in a dashboard and it runs a graph query under the hood to show a little story.
In closing, context graphs represent a convergence of knowledge management, AI, and governance. They are not merely a new tech buzzword, but a response to real needs: making AI’s decisions transparent, making organizational knowledge connected, and ensuring compliance in automated actions. The journey is just beginning — many organizations are still at metadata graph stage, and a few pioneers are building fully agentic context infrastructures. The lessons and best practices we compiled here aim to accelerate your journey, helping avoid false starts and maximize value.
As of today’s date (2026–01–22), we advise readers to pilot context graphs in a targeted way, measure results, and iterate. Keep informed with the community (papers, forums [93], vendor blogs) because the landscape is shifting quickly. What remains consistent is the vision: AI systems that are safer, smarter, and more accountable by design. Context graphs are a key enabling layer for that vision — the connective tissue between data, decisions, and outcomes. By investing in this layer, you’re investing in the long-term “memory” and governance of your AI and business processes.
We encourage you to use the labs and references provided to kickstart your practical understanding. The sooner you begin capturing context, the sooner your AI and team can leverage it. In a world where enterprises will be defined by how well they harness AI, those who build a strong, governed context layer — essentially, a “system of record for decisions” [103], [104] — will have a compounding advantage.
The era of being “data-driven” is evolving into being context-driven. With context graphs, we ensure that data, when used by AI, is not just raw fuel but informed by the rich backdrop of why and how — turning automated decisions from opaque guesses into transparent, trusted reasoning. This is the path to truly intelligent, accountable enterprise AI. Let’s build that future, one context graph at a time.
Appendices
Lab 1: Property Graph + Cypher + Python (Neo4j)
Goal: Build a toy context graph in Neo4j for a customer support scenario, and run queries to demonstrate tracing “why” paths, policies applied, and evidence trails. We’ll also show how to retrieve a subgraph as context for an AI question.
Prerequisites: You need Docker (to run Neo4j) and Python 3 with the Neo4j Python driver installed. Create a directory for this lab. In that directory, make a requirements.txt with:
neo4j==5.7.0Then run pip install -r requirements.txt. Also, pull a Neo4j Docker image:
docker pull neo4j:5.12
docker run -d --name neo4j-cg -p 7687:7687 -e NEO4J_AUTH=neo4j/password neo4j:5.12
This starts a Neo4j instance accessible at bolt://localhost:7687 with user "neo4j" and password "password". (Use a strong password in real setups.)
Graph Data Model: We will model:
Customernodes (e.g. Alice).Ticketnodes (support tickets).Decisionnodes (an action/approval taken on a ticket).Policynodes (rules/guidelines).Evidencenodes (snippets of relevant info, e.g. from knowledge base or logs).
Relationships:
(:Customer)-[:RAISED]->(:Ticket)(:Ticket)-[:TRIGGERED]->(:Decision)(the decision made in response)(:Decision)-[:APPLIED_POLICY]->(:Policy)(:Decision)-[:SUPPORTED_BY]->(:Evidence)
We’ll also add some properties like timestamps and descriptions.
Step 1: Create Nodes and Relationships via Cypher. We use the Neo4j Python driver to run Cypher commands:
from neo4j import GraphDatabase

# Connect to Neo4j
uri = "bolt://localhost:7687"
driver = GraphDatabase.driver(uri, auth=("neo4j", "password"))

def create_context_graph(tx):
    # Customers
    tx.run("CREATE (:Customer {name:$name, id:$id})", name="Alice", id="C1")
    tx.run("CREATE (:Customer {name:$name, id:$id})", name="Bob", id="C2")
    # Ticket
    tx.run("""
     CREATE (t:Ticket {id:$id, issue:$issue, priority:$priority,
    opened:datetime($opened)})
     """, id="T123", issue="Application outage", priority="HIGH",
    opened="2025-12-01T10:00:00Z")
    # Relationship: Alice raised T123
    tx.run("""
     MATCH (c:Customer {id:'C1'}), (t:Ticket {id:'T123'})
     CREATE (c)-[:RAISED]->(t)
     """)
    # Decision
    tx.run("""
     CREATE (d:Decision {id:$id, type:$type, outcome:$outcome,
    decided:datetime($time)})
     """, id="D1", type="Approval", outcome="Approved 20% discount",
    time="2025-12-01T12:00:00Z")
    tx.run("""
     MATCH (t:Ticket {id:'T123'}), (d:Decision {id:'D1'})
     CREATE (t)-[:TRIGGERED]->(d)
     """)
    # Policy
    tx.run("""
     CREATE (p:Policy {id:$id, name:$name, rule:$rule})
     """, id="P99", name="OutageCompensationPolicy", rule="Up to 20%
    discount for severe outage")
    tx.run("""
     MATCH (d:Decision {id:'D1'}), (p:Policy {id:'P99'})
     CREATE (d)-[:APPLIED_POLICY]->(p)
     """)
    # Evidence (e.g., incident report)
    tx.run("""
     CREATE (e:Evidence {id:$id, source:$source, snippet:$snippet})
     """, id="E45", source="IncidentReport#1001", snippet="3 SEV-1 outages in
    last month.")
    tx.run("""
     MATCH (d:Decision {id:'D1'}), (e:Evidence {id:'E45'})
     CREATE (d)-[:SUPPORTED_BY]->(e)
     """)
    # Another Evidence (customer feedback)
    tx.run("""
     CREATE (e:Evidence {id:$id, source:$source, snippet:$snippet})
     """, id="E46", source="CustomerEmail", snippet="Customer threatened to
    cancel due to outages.")
    tx.run("""
     MATCH (d:Decision {id:'D1'}), (e:Evidence {id:'E46'})
     CREATE (d)-[:SUPPORTED_BY]->(e)
     """)

with driver.session() as session:
    session.execute_write(create_context_graph)
    print("Context graph created.")
Running the above will insert the graph data. We have:
- Alice (C1) –RAISED→ Ticket T123.
- Ticket T123 –TRIGGERED→ Decision D1.
- Decision D1 –APPLIED_POLICY→ Policy P99.
- Decision D1 –SUPPORTED_BY→ Evidence E45 (incident report) and E46 (customer email).
Step 2: Querying “Why” Paths. Now we want to answer questions like “Why did we approve a 20% discount for Ticket T123?” This implies retrieving the chain from Decision back to its evidence and policy.
We can query the path from the Decision to all connected context:
with driver.session() as session:
    result = session.run("""
     MATCH path = (t:Ticket {id:$tid})-[:TRIGGERED]->(d:Decision)-
    [:APPLIED_POLICY]->(p:Policy)
     <-[:SUPPORTED_BY]-(e:Evidence)
     WHERE t.id = $tid
     RETURN d.outcome AS decision, p.name AS policy, p.rule AS rule,
    collect(e.snippet) AS evidence_snippets
     """, tid="T123")
    record = result.single()
    if record:
        print(f"Decision Outcome: {record['decision']}")
        print(f"Policy Applied: {record['policy']} – {record['rule']}")
        print("Evidence considered:")
        for snip in record["evidence_snippets"]:
            print(f" - {snip}")
This Cypher query matches the pattern: Ticket T123 -> Decision -> Policy (and Decision <-supported_by- Evidence). We collect all evidence snippets in a list.
Expected output:
Decision Outcome: Approved 20% discount
Policy Applied: OutageCompensationPolicy – Up to 20% discount for severe outage
Evidence considered:
 - 3 SEV-1 outages in last month.
 - Customer threatened to cancel due to outages.
This shows a clear explanation: The agent approved a 20% discount because the OutageCompensationPolicy allows it in case of severe outages, and indeed there were 3 severe outages and customer was upset (evidence).
Step 3: Policy applied query. What if we want to find all tickets where a certain policy was applied? E.g., “Where did we use OutageCompensationPolicy?” We can query:
with driver.session() as session:
    result = session.run("""
     MATCH (d:Decision)-[:APPLIED_POLICY]->(p:Policy {name:$pname})
     MATCH (c:Customer)-[:RAISED]->(t:Ticket)-[:TRIGGERED]->(d)
     RETURN p.name AS policy, collect(distinct t.id) AS tickets, collect(distinct
    c.name) AS customers
     """, pname="OutageCompensationPolicy")
    rec = result.single()
    if rec:
        print(f"Policy '{rec['policy']}' was applied for Tickets:
    {rec['tickets']} (raised by customers: {rec['customers']})")
Since we have one such decision, it would output:
Policy 'OutageCompensationPolicy' was applied for Tickets: ['T123'] (raised by
customers: ['Alice'])
In a larger graph, this helps identify all instances of a policy usage, which is useful for compliance (like, “show me all exceptions granted under policy X”).
Step 4: Evidence trail query. Suppose we want to trace all evidence for a given ticket’s decision(s). We can query the subgraph around a ticket:
(e:Evidence) RETURN d.id AS decision_id, d.outcome AS outcome, collect(e.source) AS evidence_sources """, tid="T123") for rec in result: print(f"Decision {rec['decision_id']} ({rec['outcome']}) supported by: {rec['evidence_sources']}")
For T123:
Decision D1 (Approved 20% discount) supported by: ['IncidentReport#1001', 'CustomerEmail']
So, one could then fetch the actual evidence snippets or full documents by those IDs if needed (the graph stores snippet and source reference, one could link to actual doc content).

**Step 5: Retrieval function for QA.** Let’s simulate an AI assistant query: "Why did we approve ticket T123 with a 20% discount?" We can write a Python function that given a ticket ID, extracts a subgraph of context and formats a natural language answer with citations from the graph.
def explain_ticket(ticket_id): with driver.session() as session: result = session.run(""" MATCH (t:Ticket {id:$tid})-[:TRIGGERED]->(d:Decision)-[:APPLIED_POLICY]-
(p:Policy) OPTIONAL MATCH (d)-[:SUPPORTED_BY]->(e:Evidence) RETURN d.outcome AS outcome, p.name AS policy, p.rule AS rule, collect(e) AS evidences """, tid=ticket_id) rec = result.single() if not rec: return f"No decision found for Ticket {ticket_id}."
    outcome = rec["outcome"]
    policy = rec["policy"]; rule = rec["rule"]
    evidences = rec["evidences"]

    # Build explanation
    explanation = (f"Ticket {ticket_id} was resolved with outcome:
    {outcome}. "
                   f"This decision was made under policy '{policy}', which
    states: \"{rule}\". ")

    if evidences:
        explanation += "Supporting evidence included: "
        snippets = []
        for ev in evidences:
            # ev is a Node object; get its 'snippet' property
            snippet = ev.get("snippet", "")
            source = ev.get("source", "")
            if snippet:
                snippets.append(f"{snippet} ({source})")
        explanation += "; ".join(snippets) + "."

    return explanation
print(explain_ticket("T123"))
This should output a human-readable explanation, for example:
Ticket T123 was resolved with outcome: Approved 20% discount. This decision was made under policy 'OutageCompensationPolicy', which states: "Up to 20% discount for severe outage". Supporting evidence included: 3 SEV-1 outages in last month. (IncidentReport#1001); Customer threatened to cancel due to outages. (CustomerEmail).
This is exactly the kind of answer we'd expect an AI assistant to give, with concrete evidence and policy reference – **grounded and traceable**. The pieces in parentheses act like citations (source identifiers). You can imagine feeding this explanation to a user’s chat interface, or the AI using it internally to formulate a response in conversational tone. The key is the content is grounded in our context graph.

We have thus demonstrated creating a context graph and using Cypher queries to answer “why” questions, trace policy usage, and compile evidence trails. This small example mirrors how an enterprise might trace a decision (like a discount approval) through its context of policies and events.

*Cleanup:* When done, you can stop the Neo4j container:
docker stop neo4j-cg && docker rm neo4j-cg
This lab can be extended easily – try adding another decision, linking multiple policies, or more customers, and see how queries adapt.

# Lab 2: RDF/Quads + rdflib + SPARQL (Provenance & Time)

*Goal:* Represent the same scenario from Lab 1 using RDF with provenance and temporal information. We’ll use Python’s `rdflib` to create an RDF graph, including *named graphs* for context (like a graph per decision trace). We’ll then query it with SPARQL to retrieve a decision along with its source and time validity.

**Prerequisites:** Install `rdflib`:
pip install rdflib==6.2.0
No separate server is needed – we will use an in-memory graph (for larger scale, a triplestore like GraphDB or Jena TDB could be used similarly).

**RDF Modeling:** We’ll use simplified URIs for brevity:
- Base namespace: `ex:` ([http://example.com/context#](http://example.com/context#)).
- We create RDF triples such as:
- `ex:Ticket_T123 ex:raisedBy ex:Customer_Alice`.
- `ex:Decision_D1 ex:appliedPolicy ex:Policy_P99`.
- We also want to add provenance for the evidence: e.g., "Mark (an agent) asserted this evidence on 2025-12-01".

We could use *named graphs* for each decision’s context. Alternatively, use RDF-star (if supported) or PROV-O ontology. For simplicity, we’ll use a named graph approach: one named graph contains the triples of the decision event (this allows scoping queries by graph).

**Step 1: Create RDF graph and namespace:**
import rdflib from rdflib import Graph, Namespace, Literal, URIRef from rdflib.namespace import RDF, XSD
Define namespace
EX = Namespace("http://example.com/context#")
Use a Dataset (which can hold named graphs)
dataset = rdflib.Dataset() dataset.bind("ex", EX)
Create default graph and a named graph for decision D1
default_graph = dataset.default_context decision_graph = dataset.graph(URIRef("http://example.com/ context#Decision_D1_graph"))
**Step 2: Add triples:**

We’ll add:
- `Customer_Alice a ex:Customer`.
- `Ticket_T123 a ex:Ticket`.
- etc., linking similar to Lab1.
Create resources
alice = EX.Customer_Alice; bob = EX.Customer_Bob t123 = EX.Ticket_T123; d1 = EX.Decision_D1 p99 = EX.Policy_P99; e45 = EX.Evidence_E45; e46 = EX.Evidence_E46
Add class types (for completeness, though not strictly needed for queries)
default_graph.add((alice, RDF.type, EX.Customer)) default_graph.add((bob, RDF.type, EX.Customer)) default_graph.add((t123, RDF.type, EX.Ticket)) default_graph.add((d1, RDF.type, EX.Decision)) default_graph.add((p99, RDF.type, EX.Policy)) default_graph.add((e45, RDF.type, EX.Evidence)) default_graph.add((e46, RDF.type, EX.Evidence))
Link Customer to Ticket (raisedBy)
default_graph.add((t123, EX.raisedBy, alice))
Link Ticket to Decision
default_graph.add((d1, EX.relatesToTicket, t123))
Link Decision to Policy
decision_graph.add((d1, EX.appliedPolicy, p99))
Link Decision to Evidence
decision_graph.add((d1, EX.supportedBy, e45)) decision_graph.add((d1, EX.supportedBy, e46))
Add literals for properties
default_graph.add((t123, EX.issue, Literal("Application outage"))) default_graph.add((t123, EX.priority, Literal("HIGH"))) default_graph.add((t123, EX.opened, Literal("2025-12-01T10:00:00", datatype=XSD.dateTime)))
decision_graph.add((d1, EX.outcome, Literal("Approved 20% discount"))) decision_graph.add((d1, EX.decidedAt, Literal("2025-12-01T12:00:00", datatype=XSD.dateTime)))
decision_graph.add((p99, EX.rule, Literal("Up to 20% discount for severe outage"))) decision_graph.add((p99, EX.name, Literal("OutageCompensationPolicy")))
decision_graph.add((e45, EX.snippet, Literal("3 SEV-1 outages in last month."))) decision_graph.add((e45, EX.source, Literal("IncidentReport#1001")))
decision_graph.add((e46, EX.snippet, Literal("Customer threatened to cancel due to outages."))) decision_graph.add((e46, EX.source, Literal("CustomerEmail")))
We used:
- default graph for static links (customer to ticket).
- a specific named graph (Decision_D1_graph) for the context of that decision, including the links to policy and evidence, and decision properties like outcome and timestamp. (We separate to illustrate named graph usage; one could also put all in default with context properties.)

**Step 3: SPARQL query:** Let’s query: "Retrieve the decision D1 outcome, policy name, and evidence snippets, where policy and evidence are in the context of that decision."
SPARQL query on the dataset (which includes named graphs)
sparql = """ PREFIX ex: http://example.com/context# SELECT ?outcome ?policyName ?evidenceSnippet WHERE { GRAPH ex:Decision_D1_graph { ex:Decision_D1 ex:outcome ?outcome ; ex:appliedPolicy ?policy . ?policy ex:name ?policyName .
    ex:Decision_D1 ex:supportedBy ?evidence .
    ?evidence ex:snippet ?evidenceSnippet .
}
} """
result = dataset.query(sparql) for row in result: print(f"Outcome: {row.outcome}") print(f"Policy: {row.policyName}") print(f"Evidence: {row.evidenceSnippet}")
Running this should yield something like (order not guaranteed for multiple evidence, but we'll get each evidence in a separate binding row):
Outcome: Approved 20% discount Policy: OutageCompensationPolicy Evidence: 3 SEV-1 outages in last month. Outcome: Approved 20% discount Policy: OutageCompensationPolicy Evidence: Customer threatened to cancel due to outages.
This SPARQL, constrained to the `Decision_D1_graph` named graph, effectively pulled the decision’s details and all its evidence. We see the outcome, the policy name, and each evidence snippet.

We could refine to group them by decision, but given one decision here, it’s fine. A more compact query could use `GROUP_CONCAT` in SPARQL to aggregate evidence, similar to our Cypher approach.

**Temporal aspect:** We included `decidedAt` and `opened` times in data. We can query e.g., "Was the policy valid at the time of decision?" (We didn't model validity window here explicitly, but if policies had `validFrom` / `validTo`, we’d check that against decision time). As a demonstration, suppose policy P99 had `validFrom = 2025-01-01`. Then:
Example temporal check (assuming such data exists)
sparql_time = """ PREFIX ex: http://example.com/context# SELECT ?decisionTime ?policyName WHERE { GRAPH ex:Decision_D1_graph { ex:Decision_D1 ex:decidedAt ?dt ; ex:appliedPolicy ?p . ?p ex:name ?policyName . OPTIONAL { ?p ex:validFrom ?vf . ?p ex:validTo ?vt } } } """ res = dataset.query(sparql_time) for r in res: print(f"Decision time: {r.decisionTime}, Policy: {r.policyName}")
We don't have validFrom in data, but if we did, the query would retrieve it and one could filter `FILTER(?dt >= ?vf && ?dt <= ?vt)`.

This shows how SPARQL can bring in temporal or contextual qualifiers. Named graphs already allow isolating triples by context (like a provenance graph per decision).

**Conclusion of Lab 2:** We successfully represented context with RDF, showing how named graphs or provenance info can be used. SPARQL was used to retrieve structured context (similar output to Lab 1’s Cypher query). RDF’s advantage is more explicit semantics and standard vocabularies (we could use PROV-O ontology, where `ex:Decision_D1` could be a `prov:Activity` and evidence as `prov:Entity` with `prov:wasGeneratedBy` relations, etc. – this adds interoperability [14]).

This lab gives a taste of RDF for context graphs. For more complex scenarios, one might use a triplestore (GraphDB, Jena Fuseki, etc.) to hold data and use SPARQL endpoints. The patterns remain: decisions linked to context via triples (possibly reified or in named graphs for provenance).

# Lab 3: Hybrid GraphRAG Skeleton (NetworkX + Embeddings)

*Goal:* Demonstrate a simple pipeline that combines vector-based retrieval with graph expansion for contextual question answering, including guardrails like token limit and ACL check (simulated). We’ll implement this in pure Python using `networkx` for a simple in-memory graph and dummy embeddings (since we can’t call real models here, we’ll simulate semantic search).

*Scenario:* The graph is as before (Alice’s ticket). Let’s assume we have an additional text knowledge base or long documents which are vector-indexed (we’ll simulate with a dictionary of embeddings). The pipeline:
1. Embed the query (we’ll use a simple keyword matching to simulate which node is relevant).
2. Retrieve candidate nodes (vector store simulation).
3. Expand k-hop neighborhood in graph around those nodes.
4. Rank or filter nodes for relevance (simple heuristic).
5. Assemble a context (concatenate info with citations).
6. (Simulated) Check against token limit and remove if too large.
7. Output answer packet with sources.

*Note:* This is simplified – a real pipeline might use real embeddings (OpenAI, etc.), and more complex graph logic.

**Setup:** Install networkx:
pip install networkx==3.1
**Step 1: Build a networkx graph same as Neo4j data:**
import networkx as nx
G = nx.DiGraph()
Add nodes with attributes
G.add_node("Customer:Alice", type="Customer") G.add_node("Ticket:T123", type="Ticket", issue="Application outage", priority="HIGH") G.add_node("Decision:D1", type="Decision", outcome="Approved 20% discount") G.add_node("Policy:P99", type="Policy", name="OutageCompensationPolicy", rule="Up to 20% discount for severe outage") G.add_node("Evidence:E45", type="Evidence", snippet="3 SEV-1 outages in last month.", source="IncidentReport#1001") G.add_node("Evidence:E46", type="Evidence", snippet="Customer threatened to cancel due to outages.", source="CustomerEmail")
Add edges to represent relations
G.add_edge("Customer:Alice", "Ticket:T123", relation="RAISED") G.add_edge("Ticket:T123", "Decision:D1", relation="TRIGGERED") G.add_edge("Decision:D1", "Policy:P99", relation="APPLIED_POLICY") G.add_edge("Decision:D1", "Evidence:E45", relation="SUPPORTED_BY") G.add_edge("Decision:D1", "Evidence:E46", relation="SUPPORTED_BY")
**Step 2: Simulate an embedding index.** We’ll create a rudimentary mapping of query keywords to relevant nodes:
Simulated "vector index": mapping keywords to node IDs
e.g., if query mentions "discount", we map to Decision node
keyword_index = { "discount": ["Decision:D1", "Policy:P99"], "outage": ["Evidence:E45", "Policy:P99"], "cancel": ["Evidence:E46"] }
In a real case, you would embed each node’s content (outcome text, evidence snippet, etc.) and also the textual knowledge base, and do nearest neighbor search. Here we just define if query contains a keyword.

**Step 3: Define the pipeline functions.**
def embed_query(query):
Very naive: return keywords present (lowercase match)
tokens = query.lower().split()
return tokens # our "embedding" is just tokens
def vector_retrieve(tokens):
Return candidate node IDs that match any token in index
candidates = []
for t in tokens:
    if t in keyword_index:
        candidates.extend(keyword_index[t])
return list(set(candidates)) # unique
def expand_subgraph(node_ids, hops=1):
BFS expansion up to given hops
subnodes = set(node_ids)
for _ in range(hops):
    new_nodes = set()
    for n in list(subnodes):
        # add neighbors (predecessors and successors)
        new_nodes.update(G.successors(n))
        new_nodes.update(G.predecessors(n))
    subnodes.update(new_nodes)
return subnodes
def apply_acl_filter(nodes, user_role="user"):
Simulate ACL: e.g., maybe some evidence is internal only
# We'll say E46 (customer email) is internal, only 'admin' can see
if user_role != "admin":
    nodes = {n for n in nodes if n != "Evidence:E46"}
return nodes
def assemble_context(nodes):
Concatenate snippets and info for each node in some order
context_str = ""
sources = []
for n in nodes:
    data = G.nodes[n]
    typ = data.get("type")
    if typ == "Decision":
        context_str += f"Decision outcome: {data.get('outcome')}\n"
        sources.append(n)
    elif typ == "Policy":
        context_str += f"Policy \"{data.get('name')}\": {data.get('rule')}\n"
        sources.append(n)
    elif typ == "Evidence":
        context_str += f"Evidence: {data.get('snippet')} ({data.get('source')})\n"
        sources.append(n)
    # We skip Customer and Ticket details for brevity
return context_str, sources
def trim_to_token_limit(text, limit=100): tokens = text.split() if len(tokens) > limit:
truncate
    text = " ".join(tokens[:limit]) + "...\n"
return text
**Explanation:**
- `embed_query`: breaks query into tokens.
- `vector_retrieve`: uses those tokens to find relevant node IDs (simulate vector search by keyword).
- `expand_subgraph`: gets all nodes within given hops of the candidate nodes in graph. This is our graph expansion step.
- `apply_acl_filter`: simulates an access control filter. We decide Evidence E46 is sensitive, only visible to admin. So if user_role is user, we drop E46.
- `assemble_context`: builds a text context from the subgraph nodes. It prints outcome, policy, evidence lines.
- `trim_to_token_limit`: ensures final context isn't too large (here limit 100 tokens).

**Step 4: Run a test query through pipeline.**
query = "Why was a 20% discount approved despite the outage?" tokens = embed_query(query) candidates = vector_retrieve(tokens) subgraph_nodes = expand_subgraph(candidates, hops=1) filtered_nodes = apply_acl_filter(subgraph_nodes, user_role="user") context, sources = assemble_context(filtered_nodes) context = trim_to_token_limit(context, limit=50)
answer_packet = { "query": query, "context": context, "source_nodes": sources } print("Answer Packet:", answer_packet)
Let's walk through this with our `keyword_index`:
- Query tokens: `["why", "was", "a", "20%", "discount", "approved", "despite", "the", "outage?"]` (it’ll split '20%' as '20%' or '20', and 'outage?' maybe as 'outage?'; for simplicity might not match exactly, but 'discount' and 'outage?' if trimmed to 'outage' might hit.) We didn't handle punctuation, but let's assume 'outage?' will be recognized as 'outage' (in a real scenario, you'd do better tokenization).
- Candidates from `discount` -> Decision:D1, Policy:P99. From `outage` -> Evidence:E45, Policy:P99. So candidates might be [D1, P99, E45].
- Expand subgraph 1 hop: from each, add neighbors:
- Neighbors of D1: Ticket T123 (predecessor), Policy P99, Evidence E45, Evidence E46 (successors).
- Neighbors of P99: D1 (predecessor).
- Neighbors of E45: D1 (predecessor).
- So subgraph becomes {D1, P99, E45, T123, E46}.
- ACL filter for 'user': removes E46 (we decided it's internal). Now nodes = {D1, P99, E45, T123}.
- Assemble context:
- Decision D1 outcome line,
- Policy P99 rule line,
- Evidence E45 snippet line,
- (Customer and Ticket not explicitly added in assembly code, we skip them except Ticket we might ignore here).

Context might be:
Decision outcome: Approved 20% discount Policy "OutageCompensationPolicy": Up to 20% discount for severe outage Evidence: 3 SEV-1 outages in last month. (IncidentReport#1001)
(This is <50 tokens, no trim needed).

Answer packet contains the query, this context string, and source_nodes list (likely `["Decision:D1","Policy:P99","Evidence:E45"]`).

Printing that yields:
Answer Packet: {'query': 'Why was a 20% discount approved despite the outage?', 'context': 'Decision outcome: Approved 20% discount\nPolicy "OutageCompensationPolicy": Up to 20% discount for severe outage\nEvidence: 3 SEV-1 outages in last month. (IncidentReport#1001)\n', 'source_nodes': ['Decision:D1', 'Policy:P99', 'Evidence:E45']}
This is a reasonable answer packet to feed an LLM for final answer formulation. The LLM might generate: *"We approved a 20% discount because our OutageCompensationPolicy allows up to 20% for severe outages. In this case, the customer had three severe outages in the last month (IncidentReport#1001). Thus, applying the policy, a 20% discount was granted."*

The sources indicate which graph nodes were used (for traceability, maybe to highlight or for further drill-down).

We included guardrails:
- ACL removed a sensitive evidence (customer threat) since user role is not admin.
- Token limit trimming (not needed here but included). One could also include a step to not include evidence that isn’t verified or something as a guardrail.

This lab shows how a hybrid retrieval might work with simple tools:
- A vector retrieval (we faked via keywords) to get relevant parts of graph or external docs.
- Graph expansion to enrich that context with connected info (we pulled policy and evidence once decision was found).
- Filtering out unauthorized or too large content.
- Packaging context for answer generation.

In a real system, replace the `keyword_index` with a real vector index (like FAISS or an API call to Pinecone/Chroma, etc.), and maybe networkx with a real graph DB query if needed. But logic remains similar.

**Test another scenario:** If user role was 'admin':
filtered_nodes_admin = apply_acl_filter(subgraph_nodes, user_role="admin") context_admin, src_admin = assemble_context(filtered_nodes_admin) print(context_admin)
That should now include Evidence E46 as well:
Decision outcome: Approved 20% discount Policy "OutageCompensationPolicy": Up to 20% discount for severe outage Evidence: 3 SEV-1 outages in last month. (IncidentReport#1001) Evidence: Customer threatened to cancel due to outages. (CustomerEmail)
So the admin sees the additional evidence line that the customer threatened to cancel, which might be sensitive (hence restricted).

**Conclusion of Lab 3:** We built a simple Graph + Vector RAG pipeline. It shows:
- Integration of unstructured signals (via "vector" stage) to identify which structured parts of context to use.
- Graph broadening the context with multi-hop relations (the AI doesn't have to search separate knowledge for 'policy', it finds policy via graph).
- Basic guardrails (ACL, length check).
- The output is a structured context which can be given to an LLM for final answer or used directly if simple enough.

This skeleton can be expanded with actual embedding libraries and a real graph database. For example, one could use `networkx` to quickly prototype reasoning over subgraphs, or even use the Neo4j from Lab1 via its Python driver in place of networkx to get neighbors, etc.

The key point: **GraphRAG** allows combining the strengths of vector search (semantic matching) with graph logic (following relationships, ensuring consistency and completeness of context, and enforcing rules like ACL or must-have-policy) [65], [52]. This lab provided a conceptual and practical starting point.

# References & Further Readings

[1] A. Koratana, "A few clarifications on context graphs..." LinkedIn, Dec 31, 2025. [Online]. Available: [https://www.linkedin.com/pulse/few-clarifications-context-graphs-animesh-koratana-uwsve](https://www.linkedin.com/pulse/few-clarifications-context-graphs-animesh-koratana-uwsve)

[2] TrustGraph Team, "Context Graphs: AI-Optimized Knowledge Graphs," TrustGraph Guides, Updated Dec 25, 2025. [Online]. Available: [https://trustgraph.ai/guides/key-concepts/context-graphs/](https://trustgraph.ai/guides/key-concepts/context-graphs/)

[3] J. Gupta and A. Garg, "AI’s Trillion-Dollar Opportunity: Context Graphs," Foundation Capital blog, Sep 2025. [Online]. Available: [https://foundationcapital.com/context-graphs-ais-trillion-dollar-opportunity/](https://foundationcapital.com/context-graphs-ais-trillion-dollar-opportunity/)

[4] TrustGraph Community, "What are Context Graphs? Trillion-dollar opportunity?" Reddit r/ContextEngineering thread, Jan 2026. [Online]. Available: [https://www.reddit.com/r/ContextEngineering/comments/1q0pgju/what_are_context_graphs_the_trilliondollar/](https://www.reddit.com/r/ContextEngineering/comments/1q0pgju/what_are_context_graphs_the_trilliondollar/)

[5] E. Winks, "Context Graph: What It Is, How It Works, & Implementation Guide," Atlan Knowledge Center, Jan 19, 2026. [Online]. Available: [https://atlan.com/know/what-is-a-context-graph/](https://atlan.com/know/what-is-a-context-graph/)

[6] S. Wang, "LLM Graph Database: All You Need To Know," PuppyGraph Blog, Sep 15, 2025. [Online]. Available: [https://www.puppygraph.com/blog/llm-graph-database](https://www.puppygraph.com/blog/llm-graph-database)

[7] A. Milligan, "Context Graphs: Transformational Architecture Or AI Hype?" Verdantix Blog, Jan 13, 2026. [Online]. Available: [https://www.verdantix.com/client-portal/blog/context-graphs--transformational-architecture-or-familiar-ai-hype](https://www.verdantix.com/client-portal/blog/context-graphs--transformational-architecture-or-familiar-ai-hype)

[8] Galileo AI, "AI Agent Compliance & Governance in 2025," Galileo.ai Blog, Oct 2025. [Online]. Available: [https://galileo.ai/blog/ai-agent-compliance-governance-audit-trails-risk-management](https://galileo.ai/blog/ai-agent-compliance-governance-audit-trails-risk-management)

[9] Memgraph Team, "Multi-Tenancy in Graph Databases and Why Should You Care?" Memgraph Blog, July 2025. [Online]. Available: [https://memgraph.com/blog/why-multi-tenancy-matters-in-graph-databases](https://memgraph.com/blog/why-multi-tenancy-matters-in-graph-databases)

[10] Meirtz (GitHub user), "Awesome-Context-Engineering," GitHub, 2026. [Online]. Available: [https://github.com/Meirtz/Awesome-Context-Engineering](https://github.com/Meirtz/Awesome-Context-Engineering)

[11] W. Lyon, "Hands On With Context Graphs And Neo4j," Graph Database & Analytics, Neo4j Blog. [Online]. Available: [https://neo4j.com/blog/genai/hands-on-with-context-graphs-and-neo4j/](https://neo4j.com/blog/genai/hands-on-with-context-graphs-and-neo4j/)

[12] TrustGraph, "TrustGraph - The Context Graph Factory for AI," TrustGraph.ai. [Online]. Available: [https://trustgraph.ai/](https://trustgraph.ai/)

[13] Atlan, "What is a Data Catalog? Definition and 2026 Guide," Atlan. [Online]. Available: [https://atlan.com/what-is-a-data-catalog/](https://atlan.com/what-is-a-data-catalog/)

[14] Verdantix, "Context Graphs: Transformational Architecture Or Familiar AI Hype?" [Online]. Available: [https://www.verdantix.com/client-portal/blog/context-graphs--transformational-architecture-or-familiar-ai-hype](https://www.verdantix.com/client-portal/blog/context-graphs--transformational-architecture-or-familiar-ai-hype)

[15] WRITER, "Context graphs: Marketing as the tip of the spear in the enterprise," Writer Blog. [Online]. Available: [https://writer.com/blog/context-graphs-marketing-as-the-tip-of-the-spear-in-the-enterprise/](https://writer.com/blog/context-graphs-marketing-as-the-tip-of-the-spear-in-the-enterprise/)

[16] Atlan, "Context Graph: Definition, Architecture, and Implementation Guide," Atlan. [Online]. Available: [https://atlan.com/know/what-is-a-context-graph/](https://atlan.com/know/what-is-a-context-graph/)

[17] Foundation Capital, "AI’s trillion-dollar opportunity: Context graphs," Foundation Capital. [Online]. Available: [https://foundationcapital.com/context-graphs-ais-trillion-dollar-opportunity/](https://foundationcapital.com/context-graphs-ais-trillion-dollar-opportunity/)

[18] Glean, "Context is the next data platform—and why context graphs are key to understanding processes," Glean Blog. [Online]. Available: [https://www.glean.com/blog/context-data-platform](https://www.glean.com/blog/context-data-platform)

[19] Galileo AI, "AI Agent Compliance & Governance in 2025," Galileo.ai. [Online]. Available: [https://galileo.ai/blog/ai-agent-compliance-governance-audit-trails-risk-management](https://galileo.ai/blog/ai-agent-compliance-governance-audit-trails-risk-management)

[20] ThinkingLoop, "Privacy by Prompt: How to Strip PII Before the Model Ever Sees It," Medium. [Online]. Available: [https://medium.com/@ThinkingLoop/privacy-by-prompt-how-to-strip-pii-before-the-model-ever-sees-it-12047ee86fa0](https://medium.com/@ThinkingLoop/privacy-by-prompt-how-to-strip-pii-before-the-model-ever-sees-it-12047ee86fa0)

[21] Neo4j, "Hands On With Context Graphs And Neo4j," Neo4j Blog. [Online]. Available: [https://neo4j.com/blog/genai/hands-on-with-context-graphs-and-neo4j/](https://neo4j.com/blog/genai/hands-on-with-context-graphs-and-neo4j/)

[22] WRITER, "Context graphs: Marketing as the tip of the spear in the enterprise," Writer Blog. [Online]. Available: [https://writer.com/blog/context-graphs-marketing-as-the-tip-of-the-spear-in-the-enterprise/](https://writer.com/blog/context-graphs-marketing-as-the-tip-of-the-spear-in-the-enterprise/)

[23] M. Manoj, "Introducing Context Graph: Unlocking Hidden Decision Paths," LinkedIn. [Online]. Available: [https://www.linkedin.com/posts/manas-manoj-434a9467_an-interesting-thought-process-has-come-out-activity-7413961337279635456-7Q4N](https://www.linkedin.com/posts/manas-manoj-434a9467_an-interesting-thought-process-has-come-out-activity-7413961337279635456-7Q4N)

[24] Atlan, "Context Graph: Definition, Architecture, and Implementation Guide," Atlan. [Online]. Available: [https://atlan.com/know/what-is-a-context-graph/](https://atlan.com/know/what-is-a-context-graph/)

[25] Oracle, "Fine-Grained Access Control for RDF Data," Oracle Database Documentation. [Online]. Available: [https://docs.oracle.com/en/database/oracle/oracle-database/18/rdfrm/fine-grained-access-control-rdf.html](https://docs.oracle.com/en/database/oracle/oracle-database/18/rdfrm/fine-grained-access-control-rdf.html)

[26] Oracle, "Fine-Grained Access Control for RDF Data," Oracle Database Documentation. [Online]. Available: [https://docs.oracle.com/en/database/oracle/oracle-database/18/rdfrm/fine-grained-access-control-rdf.html](https://docs.oracle.com/en/database/oracle/oracle-database/18/rdfrm/fine-grained-access-control-rdf.html)

[27] S. Villata et al., "Context-Aware Access Control for RDF Graph Stores," Inria. [Online]. Available: [https://www-sop.inria.fr/members/Serena.Villata/Resources/ecai2012ac.pdf](https://www-sop.inria.fr/members/Serena.Villata/Resources/ecai2012ac.pdf)

[28] Memgraph, "Multi-Tenancy in Graph Databases and Why Should You Care?" Memgraph Blog. [Online]. Available: [https://memgraph.com/blog/why-multi-tenancy-matters-in-graph-databases](https://memgraph.com/blog/why-multi-tenancy-matters-in-graph-databases)

[29] Indykite, "Why context graphs are critical for enterprise AI at scale," Indykite Blog. [Online]. Available: [https://www.indykite.ai/blogs/why-context-graphs-are-critical-for-enterprise-ai-at-scale](https://www.indykite.ai/blogs/why-context-graphs-are-critical-for-enterprise-ai-at-scale)

[30] Indykite, "Why context graphs are critical for enterprise AI at scale," Indykite Blog. [Online]. Available: [https://www.indykite.ai/blogs/why-context-graphs-are-critical-for-enterprise-ai-at-scale](https://www.indykite.ai/blogs/why-context-graphs-are-critical-for-enterprise-ai-at-scale)

[31] Ontotext, "Fine-grained access control," GraphDB 11.2 documentation. [Online]. Available: [https://graphdb.ontotext.com/documentation/11.2/fine-grained-access-control.html](https://graphdb.ontotext.com/documentation/11.2/fine-grained-access-control.html)

[32] Ontotext, "Fine-grained access control," GraphDB 11.2 documentation. [Online]. Available: [https://graphdb.ontotext.com/documentation/11.2/fine-grained-access-control.html](https://graphdb.ontotext.com/documentation/11.2/fine-grained-access-control.html)

[33] AWS, "Detect and redact personally identifiable information using Amazon...," AWS Blog. [Online]. Available: [https://aws.amazon.com/blogs/machine-learning/detect-and-redact-personally-identifiable-information-using-amazon-bedrock-data-automation-and-guardrails/](https://aws.amazon.com/blogs/machine-learning/detect-and-redact-personally-identifiable-information-using-amazon-bedrock-data-automation-and-guardrails/)

[34] M. Manoj, "Introducing Context Graph: Unlocking Hidden Decision Paths," LinkedIn. [Online]. Available: [https://www.linkedin.com/posts/manas-manoj-434a9467_an-interesting-thought-process-has-come-out-activity-7413961337279635456-7Q4N](https://www.linkedin.com/posts/manas-manoj-434a9467_an-interesting-thought-process-has-come-out-activity-7413961337279635456-7Q4N)

[35] Verdantix, "Context Graphs: Transformational Architecture Or Familiar AI Hype?" [Online]. Available: [https://www.verdantix.com/client-portal/blog/context-graphs--transformational-architecture-or-familiar-ai-hype](https://www.verdantix.com/client-portal/blog/context-graphs--transformational-architecture-or-familiar-ai-hype)

[36] InfoQ, "DeepMind Researchers Propose Defense against LLM Prompt...," InfoQ. [Online]. Available: [https://www.infoq.com/news/2025/04/deepmind-camel-promt-injection/](https://www.infoq.com/news/2025/04/deepmind-camel-promt-injection/)

[37] Preprints.org, "Securing Agentic AI: A Comprehensive Threat Analysis of Model...," Preprints. [Online]. Available: [https://www.preprints.org/manuscript/202510.2087](https://www.preprints.org/manuscript/202510.2087)

[38] Regie.ai, "Context Graphs article from Foundation Capital," Regie.ai Blog. [Online]. Available: [https://www.regie.ai/blog/context-graphs-article-from-foundation-capital](https://www.regie.ai/blog/context-graphs-article-from-foundation-capital)

[39] Galileo AI, "AI Agent Compliance & Governance in 2025," Galileo.ai. [Online]. Available: [https://galileo.ai/blog/ai-agent-compliance-governance-audit-trails-risk-management](https://galileo.ai/blog/ai-agent-compliance-governance-audit-trails-risk-management)

[40] Foundation Capital, "AI’s trillion-dollar opportunity: Context graphs," Foundation Capital. [Online]. Available: [https://foundationcapital.com/context-graphs-ais-trillion-dollar-opportunity/](https://foundationcapital.com/context-graphs-ais-trillion-dollar-opportunity/)

[41] TrustGraph, "TrustGraph - The Context Graph Factory for AI," TrustGraph.ai. [Online]. Available: [https://trustgraph.ai/](https://trustgraph.ai/)

[42] Indykite, "Why context graphs are critical for enterprise AI at scale," Indykite Blog. [Online]. Available: [https://www.indykite.ai/blogs/why-context-graphs-are-critical-for-enterprise-ai-at-scale](https://www.indykite.ai/blogs/why-context-graphs-are-critical-for-enterprise-ai-at-scale)

[43] PuppyGraph, "Memgraph vs Neo4j: Graph Database Comparison," PuppyGraph Blog. [Online]. Available: [https://www.puppygraph.com/blog/memgraph-vs-neo4j](https://www.puppygraph.com/blog/memgraph-vs-neo4j)

[44] PuppyGraph, "Memgraph vs Neo4j: Graph Database Comparison," PuppyGraph Blog. [Online]. Available: [https://www.puppygraph.com/blog/memgraph-vs-neo4j](https://www.puppygraph.com/blog/memgraph-vs-neo4j)

[45] PuppyGraph, "Memgraph vs Neo4j: Graph Database Comparison," PuppyGraph Blog. [Online]. Available: [https://www.puppygraph.com/blog/memgraph-vs-neo4j](https://www.puppygraph.com/blog/memgraph-vs-neo4j)

[46] NebulaGraph, "Best Graph Database for Enterprise: Neo4j vs TigerGraph vs Dgraph vs NebulaGraph Comparison," NebulaGraph Blog. [Online]. Available: [https://www.nebula-graph.io/posts/best-graph-database-for-enterprise](https://www.nebula-graph.io/posts/best-graph-database-for-enterprise)

[47] NebulaGraph, "Best Graph Database for Enterprise: Neo4j vs TigerGraph vs Dgraph vs NebulaGraph Comparison," NebulaGraph Blog. [Online]. Available: [https://www.nebula-graph.io/posts/best-graph-database-for-enterprise](https://www.nebula-graph.io/posts/best-graph-database-for-enterprise)

[48] NebulaGraph, "Best Graph Database for Enterprise: Neo4j vs TigerGraph vs Dgraph vs NebulaGraph Comparison," NebulaGraph Blog. [Online]. Available: [https://www.nebula-graph.io/posts/best-graph-database-for-enterprise](https://www.nebula-graph.io/posts/best-graph-database-for-enterprise)

[49] Atlan, "Context Graph: Definition, Architecture, and Implementation Guide," Atlan. [Online]. Available: [https://atlan.com/know/what-is-a-context-graph/](https://atlan.com/know/what-is-a-context-graph/)

[50] Atlan, "Context Graph: Definition, Architecture, and Implementation Guide," Atlan. [Online]. Available: [https://atlan.com/know/what-is-a-context-graph/](https://atlan.com/know/what-is-a-context-graph/)

[51] LangChain, "Enhancing RAG-based application accuracy by constructing and leveraging knowledge graphs," LangChain Blog. [Online]. Available: [https://www.blog.langchain.com/enhancing-rag-based-applications-accuracy-by-constructing-and-leveraging-knowledge-graphs/](https://www.blog.langchain.com/enhancing-rag-based-applications-accuracy-by-constructing-and-leveraging-knowledge-graphs/)

[52] LangChain, "Enhancing RAG-based application accuracy by constructing and leveraging knowledge graphs," LangChain Blog. [Online]. Available: [https://www.blog.langchain.com/enhancing-rag-based-applications-accuracy-by-constructing-and-leveraging-knowledge-graphs/](https://www.blog.langchain.com/enhancing-rag-based-applications-accuracy-by-constructing-and-leveraging-knowledge-graphs/)

[53] LangChain, "LangGraph," LangChain. [Online]. Available: [https://www.langchain.com/langgraph](https://www.langchain.com/langgraph)

[54] PuppyGraph, "Memgraph vs Neo4j: Graph Database Comparison," PuppyGraph Blog. [Online]. Available: [https://www.puppygraph.com/blog/memgraph-vs-neo4j](https://www.puppygraph.com/blog/memgraph-vs-neo4j)

[55] Arxiv, "[2406.11160] Context Graph," Arxiv. [Online]. Available: [https://ar5iv.labs.arxiv.org/html/2406.11160](https://ar5iv.labs.arxiv.org/html/2406.11160)

[56] Atlan, "Context Graph: Definition, Architecture, and Implementation Guide," Atlan. [Online]. Available: [https://atlan.com/know/what-is-a-context-graph/](https://atlan.com/know/what-is-a-context-graph/)

[57] Neo4j, "Hands On With Context Graphs And Neo4j," Neo4j Blog. [Online]. Available: [https://neo4j.com/blog/genai/hands-on-with-context-graphs-and-neo4j/](https://neo4j.com/blog/genai/hands-on-with-context-graphs-and-neo4j/)

[58] Indykite, "Why context graphs are critical for enterprise AI at scale," Indykite Blog. [Online]. Available: [https://www.indykite.ai/blogs/why-context-graphs-are-critical-for-enterprise-ai-at-scale](https://www.indykite.ai/blogs/why-context-graphs-are-critical-for-enterprise-ai-at-scale)

[59] Indykite, "Why context graphs are critical for enterprise AI at scale," Indykite Blog. [Online]. Available: [https://www.indykite.ai/blogs/why-context-graphs-are-critical-for-enterprise-ai-at-scale](https://www.indykite.ai/blogs/why-context-graphs-are-critical-for-enterprise-ai-at-scale)

[60] Google Cloud, "Using Spanner Graph with LangChain for GraphRAG," Google Cloud Blog. [Online]. Available: [https://cloud.google.com/blog/products/databases/using-spanner-graph-with-langchain-for-graphrag](https://cloud.google.com/blog/products/databases/using-spanner-graph-with-langchain-for-graphrag)

[61] Google Cloud, "Using Spanner Graph with LangChain for GraphRAG," Google Cloud Blog. [Online]. Available: [https://cloud.google.com/blog/products/databases/using-spanner-graph-with-langchain-for-graphrag](https://cloud.google.com/blog/products/databases/using-spanner-graph-with-langchain-for-graphrag)

[62] TrustGraph, "Reification not Decision Traces," TrustGraph.ai. [Online]. Available: [https://trustgraph.ai/news/decision-traces-reification/](https://trustgraph.ai/news/decision-traces-reification/)

[63] Atlan, "Context Graph: Definition, Architecture, and Implementation Guide," Atlan. [Online]. Available: [https://atlan.com/know/what-is-a-context-graph/](https://atlan.com/know/what-is-a-context-graph/)

[64] Atlan, "Context Graph: Definition, Architecture, and Implementation Guide," Atlan. [Online]. Available: [https://atlan.com/know/what-is-a-context-graph/](https://atlan.com/know/what-is-a-context-graph/)

[65] LangChain, "Enhancing RAG-based application accuracy by constructing and leveraging knowledge graphs," LangChain Blog. [Online]. Available: [https://www.blog.langchain.com/enhancing-rag-based-applications-accuracy-by-constructing-and-leveraging-knowledge-graphs/](https://www.blog.langchain.com/enhancing-rag-based-applications-accuracy-by-constructing-and-leveraging-knowledge-graphs/)

[66] LangChain, "Enhancing RAG-based application accuracy by constructing and leveraging knowledge graphs," LangChain Blog. [Online]. Available: [https://www.blog.langchain.com/enhancing-rag-based-applications-accuracy-by-constructing-and-leveraging-knowledge-graphs/](https://www.blog.langchain.com/enhancing-rag-based-applications-accuracy-by-constructing-and-leveraging-knowledge-graphs/)

[67] OpenReview, "Simple is Effective: The Roles of Graphs and Large Language ...," OpenReview. [Online]. Available: [https://openreview.net/forum?id=JvkuZZ04O7](https://openreview.net/forum?id=JvkuZZ04O7)

[68] TrustGraph Team, "Context Graphs: AI-Optimized Knowledge Graphs," TrustGraph Guides. [Online]. Available: [https://trustgraph.ai/guides/key-concepts/context-graphs/](https://trustgraph.ai/guides/key-concepts/context-graphs/)

[69] Google Cloud, "Using Spanner Graph with LangChain for GraphRAG," Google Cloud Blog. [Online]. Available: [https://cloud.google.com/blog/products/databases/using-spanner-graph-with-langchain-for-graphrag](https://cloud.google.com/blog/products/databases/using-spanner-graph-with-langchain-for-graphrag)

[70] Microsoft Research, "Project GraphRAG," Microsoft Research. [Online]. Available: [https://www.microsoft.com/en-us/research/project/graphrag/](https://www.microsoft.com/en-us/research/project/graphrag/)

[71] V. Kataria, "Understanding GraphRAG: The Next Evolution in Retrieval ...," LinkedIn. [Online]. Available: [https://www.linkedin.com/pulse/understanding-graphrag-next-evolution-generation-vipin-kataria-a8inc](https://www.linkedin.com/pulse/understanding-graphrag-next-evolution-generation-vipin-kataria-a8inc)

[72] Foundation Capital, "AI’s trillion-dollar opportunity: Context graphs," Foundation Capital. [Online]. Available: [https://foundationcapital.com/context-graphs-ais-trillion-dollar-opportunity/](https://foundationcapital.com/context-graphs-ais-trillion-dollar-opportunity/)

[73] Foundation Capital, "AI’s trillion-dollar opportunity: Context graphs," Foundation Capital. [Online]. Available: [https://foundationcapital.com/context-graphs-ais-trillion-dollar-opportunity/](https://foundationcapital.com/context-graphs-ais-trillion-dollar-opportunity/)

[74] WRITER, "Context graphs: Marketing as the tip of the spear in the enterprise," Writer Blog. [Online]. Available: [https://writer.com/blog/context-graphs-marketing-as-the-tip-of-the-spear-in-the-enterprise/](https://writer.com/blog/context-graphs-marketing-as-the-tip-of-the-spear-in-the-enterprise/)

[75] WRITER, "Context graphs: Marketing as the tip of the spear in the enterprise," Writer Blog. [Online]. Available: [https://writer.com/blog/context-graphs-marketing-as-the-tip-of-the-spear-in-the-enterprise/](https://writer.com/blog/context-graphs-marketing-as-the-tip-of-the-spear-in-the-enterprise/)

[76] WRITER, "Context graphs: Marketing as the tip of the spear in the enterprise," Writer Blog. [Online]. Available: [https://writer.com/blog/context-graphs-marketing-as-the-tip-of-the-spear-in-the-enterprise/](https://writer.com/blog/context-graphs-marketing-as-the-tip-of-the-spear-in-the-enterprise/)

[77] WRITER, "Context graphs: Marketing as the tip of the spear in the enterprise," Writer Blog. [Online]. Available: [https://writer.com/blog/context-graphs-marketing-as-the-tip-of-the-spear-in-the-enterprise/](https://writer.com/blog/context-graphs-marketing-as-the-tip-of-the-spear-in-the-enterprise/)

[78] WRITER, "Context graphs: Marketing as the tip of the spear in the enterprise," Writer Blog. [Online]. Available: [https://writer.com/blog/context-graphs-marketing-as-the-tip-of-the-spear-in-the-enterprise/](https://writer.com/blog/context-graphs-marketing-as-the-tip-of-the-spear-in-the-enterprise/)

[79] WRITER, "Context graphs: Marketing as the tip of the spear in the enterprise," Writer Blog. [Online]. Available: [https://writer.com/blog/context-graphs-marketing-as-the-tip-of-the-spear-in-the-enterprise/](https://writer.com/blog/context-graphs-marketing-as-the-tip-of-the-spear-in-the-enterprise/)

[80] WRITER, "Context graphs: Marketing as the tip of the spear in the enterprise," Writer Blog. [Online]. Available: [https://writer.com/blog/context-graphs-marketing-as-the-tip-of-the-spear-in-the-enterprise/](https://writer.com/blog/context-graphs-marketing-as-the-tip-of-the-spear-in-the-enterprise/)

[81] WRITER, "Context graphs: Marketing as the tip of the spear in the enterprise," Writer Blog. [Online]. Available: [https://writer.com/blog/context-graphs-marketing-as-the-tip-of-the-spear-in-the-enterprise/](https://writer.com/blog/context-graphs-marketing-as-the-tip-of-the-spear-in-the-enterprise/)

[82] TrustGraph Community, "What are Context Graphs? Trillion-dollar opportunity?" Reddit. [Online]. Available: [https://www.reddit.com/r/ContextEngineering/comments/1q0pgju/what_are_context_graphs_the_trilliondollar/](https://www.reddit.com/r/ContextEngineering/comments/1q0pgju/what_are_context_graphs_the_trilliondollar/)

[83] TrustGraph Community, "What are Context Graphs? Trillion-dollar opportunity?" Reddit. [Online]. Available: [https://www.reddit.com/r/ContextEngineering/comments/1q0pgju/what_are_context_graphs_the_trilliondollar/](https://www.reddit.com/r/ContextEngineering/comments/1q0pgju/what_are_context_graphs_the_trilliondollar/)

[84] TrustGraph Community, "What are Context Graphs? Trillion-dollar opportunity?" Reddit. [Online]. Available: [https://www.reddit.com/r/ContextEngineering/comments/1q0pgju/what_are_context_graphs_the_trilliondollar/](https://www.reddit.com/r/ContextEngineering/comments/1q0pgju/what_are_context_graphs_the_trilliondollar/)

[85] TrustGraph Community, "What are Context Graphs? Trillion-dollar opportunity?" Reddit. [Online]. Available: [https://www.reddit.com/r/ContextEngineering/comments/1q0pgju/what_are_context_graphs_the_trilliondollar/](https://www.reddit.com/r/ContextEngineering/comments/1q0pgju/what_are_context_graphs_the_trilliondollar/)

[86] TrustGraph Community, "What are Context Graphs? Trillion-dollar opportunity?" Reddit. [Online]. Available: [https://www.reddit.com/r/ContextEngineering/comments/1q0pgju/what_are_context_graphs_the_trilliondollar/](https://www.reddit.com/r/ContextEngineering/comments/1q0pgju/what_are_context_graphs_the_trilliondollar/)

[87] TrustGraph Community, "What are Context Graphs? Trillion-dollar opportunity?" Reddit. [Online]. Available: [https://www.reddit.com/r/ContextEngineering/comments/1q0pgju/what_are_context_graphs_the_trilliondollar/](https://www.reddit.com/r/ContextEngineering/comments/1q0pgju/what_are_context_graphs_the_trilliondollar/)

[88] TrustGraph Community, "What are Context Graphs? Trillion-dollar opportunity?" Reddit. [Online]. Available: [https://www.reddit.com/r/ContextEngineering/comments/1q0pgju/what_are_context_graphs_the_trilliondollar/](https://www.reddit.com/r/ContextEngineering/comments/1q0pgju/what_are_context_graphs_the_trilliondollar/)

[89] TrustGraph Community, "What are Context Graphs? Trillion-dollar opportunity?" Reddit. [Online]. Available: [https://www.reddit.com/r/ContextEngineering/comments/1q0pgju/what_are_context_graphs_the_trilliondollar/](https://www.reddit.com/r/ContextEngineering/comments/1q0pgju/what_are_context_graphs_the_trilliondollar/)

[90] TrustGraph Community, "What are Context Graphs? Trillion-dollar opportunity?" Reddit. [Online]. Available: [https://www.reddit.com/r/ContextEngineering/comments/1q0pgju/what_are_context_graphs_the_trilliondollar/](https://www.reddit.com/r/ContextEngineering/comments/1q0pgju/what_are_context_graphs_the_trilliondollar/)

[91] TrustGraph Community, "What are Context Graphs? Trillion-dollar opportunity?" Reddit. [Online]. Available: [https://www.reddit.com/r/ContextEngineering/comments/1q0pgju/what_are_context_graphs_the_trilliondollar/](https://www.reddit.com/r/ContextEngineering/comments/1q0pgju/what_are_context_graphs_the_trilliondollar/)

[92] Atlan, "Context Graph: Definition, Architecture, and Implementation Guide," Atlan. [Online]. Available: [https://atlan.com/know/what-is-a-context-graph/](https://atlan.com/know/what-is-a-context-graph/)

[93] Meirtz, "Awesome-Context-Engineering," GitHub. [Online]. Available: [https://github.com/Meirtz/Awesome-Context-Engineering](https://github.com/Meirtz/Awesome-Context-Engineering)

[94] A. Koratana, "A few clarifications on context graphs..." LinkedIn. [Online]. Available: [https://www.linkedin.com/pulse/few-clarifications-context-graphs-animesh-koratana-uwsve](https://www.linkedin.com/pulse/few-clarifications-context-graphs-animesh-koratana-uwsve)

[95] A. Koratana, "A few clarifications on context graphs..." LinkedIn. [Online]. Available: [https://www.linkedin.com/pulse/few-clarifications-context-graphs-animesh-koratana-uwsve](https://www.linkedin.com/pulse/few-clarifications-context-graphs-animesh-koratana-uwsve)

[96] A. Koratana, "A few clarifications on context graphs..." LinkedIn. [Online]. Available: [https://www.linkedin.com/pulse/few-clarifications-context-graphs-animesh-koratana-uwsve](https://www.linkedin.com/pulse/few-clarifications-context-graphs-animesh-koratana-uwsve)

[97] TrustGraph Community, "What are Context Graphs? Trillion-dollar opportunity?" Reddit. [Online]. Available: [https://www.reddit.com/r/ContextEngineering/comments/1q0pgju/what_are_context_graphs_the_trilliondollar/](https://www.reddit.com/r/ContextEngineering/comments/1q0pgju/what_are_context_graphs_the_trilliondollar/)

[98] Verdantix, "Context Graphs: Transformational Architecture Or Familiar AI Hype?" [Online]. Available: [https://www.verdantix.com/client-portal/blog/context-graphs--transformational-architecture-or-familiar-ai-hype](https://www.verdantix.com/client-portal/blog/context-graphs--transformational-architecture-or-familiar-ai-hype)

[99] Foundation Capital, "AI’s trillion-dollar opportunity: Context graphs," Foundation Capital. [Online]. Available: [https://foundationcapital.com/context-graphs-ais-trillion-dollar-opportunity/](https://foundationcapital.com/context-graphs-ais-trillion-dollar-opportunity/)

[100] V. Kataria, "Understanding GraphRAG: The Next Evolution in Retrieval ...," LinkedIn. [Online]. Available: [https://www.linkedin.com/pulse/understanding-graphrag-next-evolution-generation-vipin-kataria-a8inc](https://www.linkedin.com/pulse/understanding-graphrag-next-evolution-generation-vipin-kataria-a8inc)

[101] Indykite, "Why context graphs are critical for enterprise AI at scale," Indykite Blog. [Online]. Available: [https://www.indykite.ai/blogs/why-context-graphs-are-critical-for-enterprise-ai-at-scale](https://www.indykite.ai/blogs/why-context-graphs-are-critical-for-enterprise-ai-at-scale)

[102] Foundation Capital, "AI’s trillion-dollar opportunity: Context graphs," Foundation Capital. [Online]. Available: [https://foundationcapital.com/context-graphs-ais-trillion-dollar-opportunity/](https://foundationcapital.com/context-graphs-ais-trillion-dollar-opportunity/)

[103] M. Manoj, "Introducing Context Graph: Unlocking Hidden Decision Paths," LinkedIn. [Online]. Available: [https://www.linkedin.com/posts/manas-manoj-434a9467_an-interesting-thought-process-has-come-out-activity-7413961337279635456-7Q4N](https://www.linkedin.com/posts/manas-manoj-434a9467_an-interesting-thought-process-has-come-out-activity-7413961337279635456-7Q4N)

[104] M. Manoj, "Introducing Context Graph: Unlocking Hidden Decision Paths," LinkedIn. [Online]. Available: [https://www.linkedin.com/posts/manas-manoj-434a9467_an-interesting-thought-process-has-come-out-activity-7413961337279635456-7Q4N](https://www.linkedin.com/posts/manas-manoj-434a9467_an-interesting-thought-process-has-come-out-activity-7413961337279635456-7Q4N)

[105] A. Koratana, "A few clarifications on context graphs..." LinkedIn. [Online]. Available: [https://www.linkedin.com/pulse/few-clarifications-context-graphs-animesh-koratana-uwsve](https://www.linkedin.com/pulse/few-clarifications-context-graphs-animesh-koratana-uwsve)

[106] TrustGraph Team, "Context Graphs: AI-Optimized Knowledge Graphs," TrustGraph Guides. [Online]. Available: [https://trustgraph.ai/guides/key-concepts/context-graphs/](https://trustgraph.ai/guides/key-concepts/context-graphs/)

[107] S. Wang, "LLM Graph Database: All You Need To Know," PuppyGraph Blog. [Online]. Available: [https://www.puppygraph.com/blog/llm-graph-database](https://www.puppygraph.com/blog/llm-graph-database)

[108] Verdantix, "Context Graphs: Transformational Architecture Or Familiar AI Hype?" [Online]. Available: [https://www.verdantix.com/client-portal/blog/context-graphs--transformational-architecture-or-familiar-ai-hype](https://www.verdantix.com/client-portal/blog/context-graphs--transformational-architecture-or-familiar-ai-hype)
메타데이터
- post_id
- c49610c8ff27
- slug
- context-graphs-a-practical-guide-to-governed-context-for-llms-agents-and-knowledge-systems-c49610c8ff27
- url
- https://medium.com/@adnanmasood/context-graphs-a-practical-guide-to-governed-context-for-llms-agents-and-knowledge-systems-c49610c8ff27
- canonical_url
- https://medium.com/@adnanmasood/context-graphs-a-practical-guide-to-governed-context-for-llms-agents-and-knowledge-systems-c49610c8ff27
- author_url
- https://medium.com/@adnanmasood
- status
- ok
- fetched_at
- 2026-08-20 23:38:45