Debugging Microservices Without Going Insane: Distributed Tracing with OpenTelemetry
You have three services. A request hits Service A, which calls Service B, which queries Service C, which hits a database. Something is…
Debugging Microservices Without Going Insane: Distributed Tracing with OpenTelemetry
You have three services. A request hits Service A, which calls Service B, which queries Service C, which hits a database. Something is slow. You open four browser tabs, one per service’s logs, and start matching timestamps. Fifteen minutes later you find it: a missing index on a foreign key, triggered by a code path that only runs when a specific feature flag is on.
This is the daily reality of debugging distributed systems without tracing. The problem is not that the bug is hard to find. It is that the tools make it hard to look in the right place.
Distributed tracing solves this by recording the full journey of each request across services as a single, connected data structure. This article walks through how it works, how to set it up in a Node.js microservices stack using OpenTelemetry, and what you actually see when debugging a real slow request.
How distributed tracing works
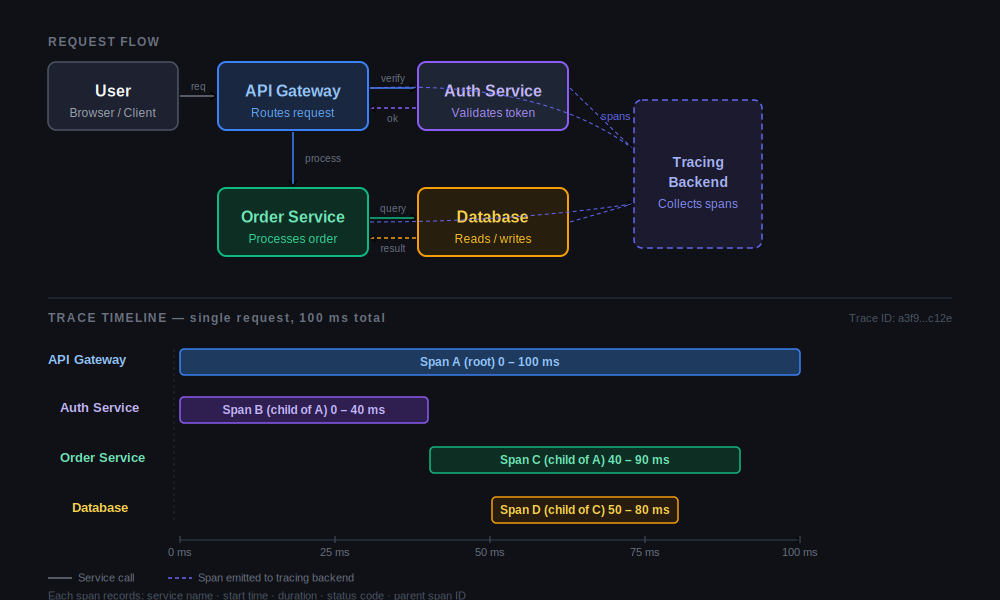
A trace is a tree of spans. When a request enters your system, the first service creates a root span. Every downstream call (HTTP, gRPC, database query, message queue publish) becomes a child span nested inside the parent. Each span records its start time, end time, service name, operation name, and any attributes you attach.
The key mechanism is context propagation. When Service A calls Service B over HTTP, the OTel SDK automatically injects a traceparent header into the outgoing request (using the W3C Trace Context standard). Service B extracts this header, reads the trace ID and parent span ID, and creates its own span as a child. The result is that spans from three different processes, written to the same backend, reconstruct a single tree that shows you exactly what happened and how long each step took.
Without propagation, you have isolated spans per service, useful as individual metrics but useless for debugging cross-service latency.
Setting up OpenTelemetry in a Node.js service
The setup for Node.js is a single instrumentation file that loads before your application code. Everything else is automatic.
Install packages
#bash
npm install \
@opentelemetry/sdk-node \
@opentelemetry/api \
@opentelemetry/auto-instrumentations-node \
@opentelemetry/exporter-trace-otlp-http \
@opentelemetry/resources \
@opentelemetry/semantic-conventions
@opentelemetry/auto-instrumentations-node is a meta-package that bundles instrumentation for Express, HTTP, PostgreSQL (pg), MySQL, MongoDB, Redis, and a large number of other popular libraries. You do not need to configure each one individually.
Create the instrumentation file
#js
// instrumentation.js
// This file must load before any application code.
// Use: node — require ./instrumentation.js server.js
const { NodeSDK } = require(‘@opentelemetry/sdk-node’);
const { getNodeAutoInstrumentations } = require(‘@opentelemetry/auto-instrumentations-node’);
const { OTLPTraceExporter } = require(‘@opentelemetry/exporter-trace-otlp-http’);
const { resourceFromAttributes } = require(‘@opentelemetry/resources’);
const { ATTR_SERVICE_NAME } = require(‘@opentelemetry/semantic-conventions’);
const sdk = new NodeSDK({
resource: resourceFromAttributes({
[ATTR_SERVICE_NAME]: process.env.OTEL_SERVICE_NAME || ‘order-service’,
}),
traceExporter: new OTLPTraceExporter({
url: ${process.env.OTEL_EXPORTER_OTLP_ENDPOINT}/v1/traces,
}),
instrumentations: [
getNodeAutoInstrumentations({
// Reduce noise from health check polling
‘@opentelemetry/instrumentation-http’: {
ignoreIncomingRequestHook: (req) =>
req.url === ‘/health’ || req.url === ‘/ready’,
},
}),
],
});
sdk.start();
process.on(‘SIGTERM’, () => {
sdk.shutdown().catch(console.error);
});
Start your service with instrumentation loaded
#bash
export OTEL_SERVICE_NAME=order-service
export OTEL_EXPORTER_OTLP_ENDPOINT=http://<your-apm-backend>:4318
node — require ./instrumentation.js server.js
Or in Docker/Kubernetes:
#dockerfile
ENV NODE_OPTIONS=” — require ./instrumentation.js”
ENV OTEL_SERVICE_NAME=”order-service”
ENV OTEL_EXPORTER_OTLP_ENDPOINT=”http://cubeapm:4318"
That is the entire setup for auto-instrumentation. Every incoming HTTP request becomes a root span. Every outgoing HTTP call, PostgreSQL query, Redis command, or MongoDB operation becomes a child span, automatically, with no changes to your application code.
Context propagation across services
For context to flow between services, each service needs to be instrumented the same way. OpenTelemetry handles the traceparent header injection and extraction automatically via the @opentelemetry/instrumentation-http package. As long as all your services are instrumented and sending to the same backend, spans from different processes will be linked into a single trace.
Service A (Express) Service B (Express) PostgreSQL
───────────────────── ────────────────────── ──────────
GET /checkout [root span]
└── HTTP POST /inventory ──→ POST /inventory [child span]
└── SELECT items […] ──→ [db span]
All three spans share the same traceId. In your APM backend, they render as a single flame graph.
Adding custom spans and attributes
Auto-instrumentation covers library calls but not your own business logic. For operations that matter for debugging, like a pricing calculation or a discount evaluation, add a manual span:
#js
const { trace, SpanStatusCode } = require(‘@opentelemetry/api’);
const tracer = trace.getTracer(‘order-service’);
async function applyDiscount(order) {
return tracer.startActiveSpan(‘discount.evaluate’, async (span) => {
try {
span.setAttribute(‘order.id’, order.id);
span.setAttribute(‘order.item_count’, order.items.length);
const result = await evaluateRules(order);
span.setAttribute(‘discount.applied’, result.discountApplied);
span.setAttribute(‘discount.percent’, result.percent);
return result;
} catch (err) {
span.recordException(err);
span.setStatus({ code: SpanStatusCode.ERROR });
throw err;
} finally {
span.end();
}
});
}
startActiveSpan automatically makes this span a child of whatever span is currently active in the async context, so no manual parent linking is needed. This is important: OTel uses Node.js AsyncLocalStorage to track the active span through async/await boundaries, so context flows correctly across await calls without any extra work.
What you actually see when debugging
Here is a concrete example. You have an order service and an inventory service. A POST to /checkout is taking 1.2 seconds. Users are complaining.
Before tracing: You tail logs from both services and try to match the timestamp on the checkout request to inventory log lines. You cannot tell whether the slowness is in the checkout handler, the HTTP call to inventory, or something inventory does internally.
After tracing: You open the trace for that request. The flame graph shows:
POST /checkout 1,200ms
├── http.post /inventory/reserve 980ms ← almost everything here
│ ├── SELECT FROM inventory 12ms*
│ ├── SELECT FROM inventory 11ms*
│ ├── SELECT FROM inventory 14ms*
│ └── … × 47 more queries
└── http.post /payments/charge 180ms
You are looking at an N+1 query. The inventory service is fetching each item in the order individually instead of batching. The fix is one line: replace the loop with WHERE id = ANY($1). Deploy. The checkout endpoint goes from 1.2 seconds to 220ms.
You found and fixed a performance bug in the time it would have taken you to correlate log files across two services manually.
A note on sampling
Full trace capture at high traffic means a lot of data. The default OTel SDK samples 100% of traces, which is fine for development but expensive at scale.
For production, use head-based sampling with parentbased_traceidratio:
#bash
export OTEL_TRACES_SAMPLER=parentbased_traceidratio
export OTEL_TRACES_SAMPLER_ARG=0.1 # sample 10% of traces
parentbased_traceidratio respects the sampling decision of the parent span, so a trace is either sampled in full or dropped entirely, so you never get incomplete traces. At 10% sampling you capture enough to debug latency patterns and errors without storing everything.
For error traces specifically, you can configure tail-based sampling on the OTel Collector side to always capture traces that contain errors, regardless of the sampling ratio. This keeps storage manageable while ensuring you never miss a failing request.
What CubeAPM adds as the backend

The OTel SDK handles collection. You still need somewhere to send the data that lets you query and visualize it efficiently.
CubeAPM is an APM platform built natively on OTLP. You point your exporters directly at it with no translation layer. It runs on your own infrastructure, so no telemetry leaves your cloud. The features most relevant to the debugging workflow described here:
- Flame graphs for every trace showing span duration and nesting
- Service map automatically generated from the spans, showing which services call which
- DB query filtering across all services by duration, useful for finding slow queries proactively rather than only during an incident
- Log correlation via trace_id, letting you jump from a span directly to the related log lines for that request
- Alerting on trace-level conditions (P99 latency, error rate) via Slack, PagerDuty, Email, or webhook
Instrumentation guides for Python, Node.js, Go, Java, Ruby on Rails, PHP, and .NET Core are at docs.cubeapm.com.
Summary
The core ideas:
- A trace is a tree of spans linked by a shared traceId and propagated traceparent headers
- OTel’s @opentelemetry/auto-instrumentations-node instruments Express, HTTP, PostgreSQL, Redis, MongoDB, and more automatically. One file, no application code changes.
- Context flows through async/await correctly via AsyncLocalStorage, with no manual propagation needed for standard Node.js patterns.
- Manual spans with startActiveSpan cover business logic that auto-instrumentation does not
- Use parentbased_traceidratio for head-based sampling in production; pair with tail-based error sampling on the Collector
If you are running more than two services and still debugging by correlating logs across terminals, add tracing. The setup is one file and a few environment variables. The debugging time savings start immediately.
메타데이터
- post_id
- c49b22cce6f4
- slug
- debugging-microservices-without-going-insane-distributed-tracing-with-opentelemetry-c49b22cce6f4
- url
- https://medium.com/@cubeapm/debugging-microservices-without-going-insane-distributed-tracing-with-opentelemetry-c49b22cce6f4
- canonical_url
- https://medium.com/@cubeapm/debugging-microservices-without-going-insane-distributed-tracing-with-opentelemetry-c49b22cce6f4
- author_url
- https://medium.com/@cubeapm
- status
- ok
- fetched_at
- 2026-06-13 07:35:29