DESALINATION AND BRINE REFINERY
WHY WE BUILD DESALINATION AND BRINE REFINERY
DESALINATION AND BRINE REFINERY

WHY WE BUILD DESALINATION AND BRINE REFINERY
We build the Desalination and Brine Refinery vertical to eliminate the single largest moral and economic blindspot in global water infrastructure: the treatment of brine as waste requiring disposal instead of as feedstock worth billions of dollars per year in recovered materials.
The canal feeds freshwater inland. The desalination plant provides potable water to the people of the host geography, free of charge, with no tariff, no subsidy, and no means testing. The brine refinery converts concentrated seawater into industrial-grade commodities: sodium chloride, potassium chloride, magnesium, calcium sulfate, bromine, sodium sulfate, lithium, and strategically critical rare earth elements.
We are not doing this to wipe out legacy desalination companies. Many of them have worked for decades inside a system that was built on expensive grid power, fuel-indexed tariffs, and the assumption that brine is a liability. But that system is now colliding with physics, economics, and public patience. As our work shows, there is a clear alternative: a dual-output engine that produces drinking water and strategic materials from the same seawater stream, powered by clean baseload electricity at one cent per kilowatt-hour.
Legacy desalination operators will face a simple choice: adapt and plug into a cheaper, cleaner, fully traceable model anchored to physics and governed by the Sovereign Logic Engine, or retreat into smaller, higher-cost niches as the benchmark moves past them.
We are not setting out to destroy any company. We are setting out to retire a logic: the idea that water scarcity must be solved through stand-alone plants dependent on volatile fuel prices, that brine must be discharged as waste, and that tariffs must rise with energy markets. That logic served its moment. That moment is over.
From the beginning, our goal has been to offer the planet a new alternative, built on three core principles. Physics does not lie. There is a profound amount of clean energy available from gravity and ocean water, and if you price electrons at physics instead of speculation, everything else changes. Long-term vision for people, not just assets. At full deployment we see work for tens of millions of people building real infrastructure that provides water, materials, and dignity. Abundance over scarcity. We believe the true value of a system should be measured by how much abundance it can safely deliver: in water, minerals, employment, and sovereignty.
We are not building this for the one percent. We are building it for the ninety-nine percent, for everyone who has been told they are a rounding error in someone else’s model, for everyone who has quietly decided their voice does not matter. Your voice does matter. If you have ever wanted something real to stand up for, your chance is coming.
2. AUDITED GEOMETRY AND VOLUME
2.1 Canal and Intake Anchors
The Desalination and Brine Refinery vertical is sized to match the hydraulic throughput of the CTMP ocean intake and canal system.
Seawater intake volume per module: Design intake equals 5,000,000,000 cubic meters per year (5 billion cubic meters per year). This matches the canal lining volume anchor and represents continuous flow through the hydro and desalination systems.
Product water output (permeate): Recovery ratio equals approximately 50 percent. Product water equals 5 billion cubic meters of intake multiplied by 0.50, which yields 2,500,000,000 cubic meters per year. This is the design anchor: 2.5 billion cubic meters per year of pure water produced per module.
Brine output: Brine volume equals 5 billion cubic meters multiplied by 0.50, which yields 2,500,000,000 cubic meters per year. Brine salinity (concentrated) equals approximately 70 grams per liter (approximately 2 times seawater concentration). Total dissolved solids in brine equals 2.5 billion cubic meters multiplied by 70 kilograms per cubic meter, which equals 175,000,000,000 kilograms, or 175 million tonnes per year.
At 80-module scale: Total intake equals 400 billion cubic meters per year. Total product water equals 200 billion cubic meters per year. Total brine for mineral processing equals 200 billion cubic meters per year. Total dissolved solids available equals 14 billion tonnes per year.
2.2 Free Water Allocation to Host Nations
Per the CTMP governance framework, each module allocates approximately 2 billion cubic meters per year of potable water to the host nation at zero price. This is drawn from the 2.5 billion cubic meters of pure water produced annually. The remaining 500 million cubic meters serves internal industrial verticals at computed cost.
The 2 billion cubic meters per year anchor is a governance commitment enforced by the Sovereign Logic Engine. The remaining 500 million cubic meters per year serves CTMP industrial verticals.
WHO reference: WHO minimum for drinking water equals 50 liters per person per day, which equals 18.25 cubic meters per person per year. 2 billion cubic meters per year divided by 18.25 cubic meters per person equals 109,589,041 people served per module. At 80 modules: approximately 8.8 billion person-equivalents of basic drinking water annually.
3. INTER-PLATFORM ROLE OF DESALINATION AND BRINE REFINERY
Desalination and Brine Refinery is not simply the plant that makes water. It is the metabolic engine of the CTMP platform, converting seawater into the fluids and feedstocks that every other vertical requires to function. Here is how it threads through the system.
3.1 Hydro Module and Power Generation
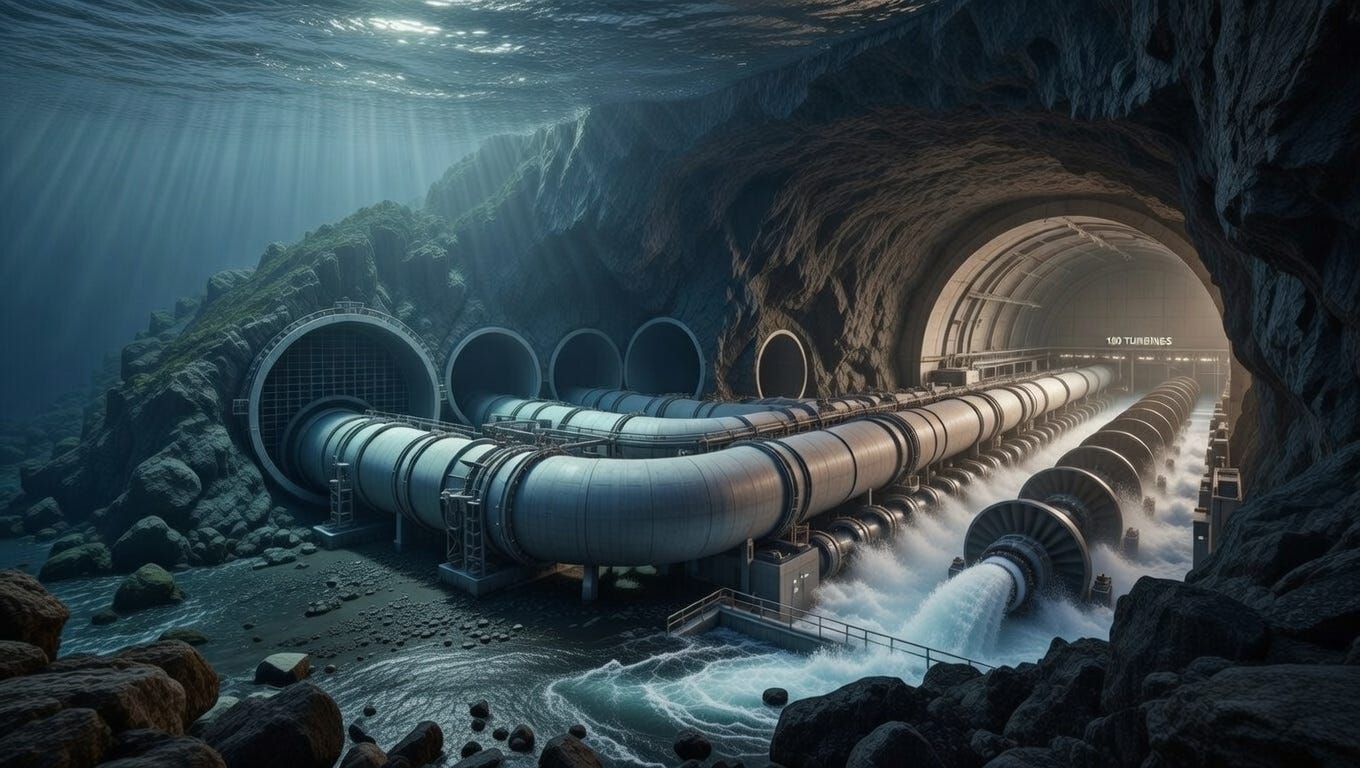
Desalination shares intake infrastructure with the hydro vertical. Both systems draw from the same engineered ocean intake, reducing civil works duplication and ensuring coordinated flow management. The hydro system provides electricity at one cent per kilowatt-hour to power the reverse osmosis trains. In return, desalination provides ultrapure water for turbine cooling, bearing lubrication, and hydrogen generation via electrolysis.
3.2 Green Steel
Steel production requires massive volumes of water for cooling, dust suppression, and hydrogen-based direct reduction of iron ore. Desalination provides this water at zero marginal cost. The brine refinery supplies magnesium for alloy production and sodium sulfate for slag conditioning. Steel, in turn, provides structural materials for desalination plant construction and pipeline infrastructure.
3.3 Green Concrete
Concrete requires mixing water meeting strict purity standards. Desalination provides this water without drawing on freshwater aquifers. The brine refinery supplies gypsum (calcium sulfate) for cement production. Concrete, in turn, provides foundations, basins, and civil works for the desalination plant itself.
3.4 Fertilizer and Agriculture
The brine refinery produces potassium chloride, a primary fertilizer input. Agricultural water allocations come from the free water pool. This closes a loop that has historically required importing potash from distant mines while depleting local aquifers for irrigation.
3.5 Chemical Manufacturing
Sodium chloride from brine becomes feedstock for chlor-alkali processes producing caustic soda and chlorine. Bromine becomes feedstock for flame retardants and pharmaceuticals. Magnesium becomes feedstock for refractory materials and lightweight alloys. The chemical vertical purchases these inputs at computed cost, not market price, insulating downstream products from commodity speculation.
4. EXTERNAL MARKET CONTEXT
The global desalination market is valued at approximately 20 billion dollars per year in capital expenditure and growing at 8 to 10 percent annually. The market is dominated by reverse osmosis technology, which accounts for over 65 percent of installed capacity. The largest markets are in the Middle East (Saudi Arabia, UAE, Kuwait), North Africa (Algeria, Libya, Egypt), and increasingly in water-stressed regions of the United States, Australia, and Spain.
The fundamental problem with existing desalination is its energy intensity. Reverse osmosis requires approximately 3 to 4 kilowatt-hours per cubic meter of product water. At grid electricity prices of 10 to 15 cents per kilowatt-hour, energy alone costs 30 to 60 cents per cubic meter. Add capital amortization, membrane replacement, chemical treatment, and labor, and the total cost reaches 80 cents to 1.50 dollars per cubic meter in most installations.
This cost structure creates a political problem. Governments must either subsidize water prices (creating fiscal burdens), charge cost-recovery tariffs (creating public resentment), or ration supply (creating black markets and inequity). No option is sustainable. All options generate instability.
The brine disposal problem compounds the economic challenge. For every cubic meter of product water, reverse osmosis generates approximately 1.2 to 1.5 cubic meters of concentrated brine. Most plants discharge this brine into coastal waters, creating hypersaline zones that damage marine ecosystems. Some plants evaporate brine in open ponds, consuming land and creating dust hazards. A few plants attempt partial mineral recovery, but the economics are marginal without cheap energy.
CTMP enters this market with a structural advantage that cannot be replicated by incremental improvements to existing technology. At one cent per kilowatt-hour internal electricity cost, the energy component of desalination drops to 3 to 4 cents per cubic meter. Combined with integrated brine refinery revenues, the net cost of product water approaches zero or goes negative. This is not a cost reduction. This is a category shift.
5. ENERGY CONSUMPTION AND SOURCE
All electricity for the Desalination and Brine Refinery vertical comes from the CTMP hydro module. No fossil fuel is consumed in water production. No grid connection is required. No carbon is emitted.
Energy consumption per cubic meter of product water: High-pressure reverse osmosis pumping requires approximately 2.5 to 3.0 kilowatt-hours per cubic meter. Pre-treatment (filtration, chemical dosing) requires approximately 0.2 kilowatt-hours per cubic meter. Post-treatment (remineralization, UV disinfection) requires approximately 0.1 kilowatt-hours per cubic meter. Brine concentration (for mineral recovery) requires approximately 1.5 to 2.0 kilowatt-hours per cubic meter. Total: approximately 4.3 to 5.3 kilowatt-hours per cubic meter including full brine processing.
At 2.5 billion cubic meters per year of product water per module, total electricity consumption equals approximately 10.75 to 13.25 terawatt-hours per year. This represents approximately 3.5 to 4.5 percent of a 300-gigawatt module’s annual output of 2,600 terawatt-hours.
Internal cost at one cent per kilowatt-hour: Energy cost per cubic meter equals 4.3 to 5.3 cents. Compare to legacy desalination at grid prices: 30 to 60 cents per cubic meter for energy alone.
6. FEEDSTOCK INPUTS AND MATERIAL FLOWS
Primary feedstock: Seawater. Composition varies by geography but averages approximately 35 grams per liter of total dissolved solids, of which sodium chloride accounts for approximately 27 grams per liter. Other significant components include magnesium (1.3 grams per liter), calcium (0.4 grams per liter), potassium (0.4 grams per liter), and sulfate (2.7 grams per liter). Trace components include bromine, boron, strontium, lithium, and various rare earth elements.
Secondary inputs: Membrane modules (replaced on 5-year cycles), antiscalant chemicals (to prevent mineral precipitation), sodium hydroxide (for pH adjustment), chlorine (for biofouling control), and activated carbon (for organic removal). All secondary inputs are sourced internally from CTMP chemical verticals where possible, at computed cost.
Output streams: Potable water meeting WHO drinking water guidelines, industrial process water meeting application-specific purity standards, and concentrated brine at approximately 64 grams per liter proceeding to mineral recovery.
7. PRODUCT OUTPUTS AND DOWNSTREAM ALLOCATION
7.1 Potable Water Allocation
Per module per year: Approximately 2 billion cubic meters allocated free to host nation citizens from the 2.5 billion cubic meters of pure water produced. This allocation is constitutionally guaranteed and enforced by the Sovereign Logic Engine. No government official, investor, or operator can redirect this water to commercial sale without triggering audit alerts and constitutional violation protocols.
7.2 Industrial Water Allocation
Remaining product water (approximately 500 million cubic meters per year) is available for internal CTMP verticals at computed cost. Steel production, concrete production, hydrogen electrolysis, and cooling systems draw from this pool. External industrial customers may purchase surplus at published tariffs, which remain below legacy desalination costs.
7.3 Brine Refinery Products
Annual output from 2.5 billion cubic meters of concentrated brine: Sodium chloride at approximately 140 million tonnes (industrial and food grade), potassium chloride at approximately 3.3 million tonnes (fertilizer grade), magnesium compounds at approximately 6.5 million tonnes (various grades), calcium sulfate (gypsum) at approximately 10 million tonnes, sodium sulfate at approximately 20 million tonnes, bromine at approximately 330,000 tonnes, and lithium carbonate at approximately 2,500 tonnes. Trace rare earth elements are captured in secondary recovery circuits.
These materials feed directly into CTMP verticals (steel, concrete, chemical, fertilizer) or are sold externally at market prices. The revenue from mineral sales exceeds the operating cost of the entire desalination system by a factor of 10 to 20.
8. INTERNAL PRICING AND TRANSFER LOGIC
All internal transfers within CTMP occur at computed cost, not market price. This insulates downstream verticals from commodity volatility and prevents internal profit extraction.
Water transfer price to internal verticals: Computed as energy cost plus membrane amortization plus chemical cost plus labor allocation. At current estimates, this equals approximately 8 to 12 cents per cubic meter. Compare to external market prices of 80 cents to 2 dollars per cubic meter.
Mineral transfer prices to internal verticals: Each mineral is priced at extraction cost plus processing cost plus logistics cost. Sodium chloride for chlor-alkali: approximately 15 dollars per tonne (market price 50 to 80 dollars). Potassium chloride for fertilizer: approximately 80 dollars per tonne (market price 300 to 500 dollars). Magnesium for alloys: approximately 800 dollars per tonne (market price 2,500 to 4,000 dollars).
This pricing structure means CTMP steel is cheaper than competitors buying market-price water and minerals. CTMP concrete is cheaper than competitors buying market-price gypsum and water. CTMP fertilizer is cheaper than competitors buying market-price potash. The cost advantage cascades through every downstream vertical.
9. EXPONENTIAL GROWTH AND THE 10% COMPOUNDING MANDATE
The CTMP constitutional framework mandates a minimum 50 percent reinvestment of net operating surplus into capacity expansion. At the scale of revenues generated by the Desalination and Brine Refinery vertical, this reinvestment mandate produces exponential growth that fundamentally alters the trajectory of global water infrastructure.
The math is simple. If a single module generates approximately 23.5 billion dollars per year in net operating surplus, and 50 percent of that surplus (11.75 billion dollars) is reinvested annually, the platform can fund construction of additional capacity at a rate that compounds year over year. The constitutional target is 10 percent annual capacity growth sustained for 15 years.
Here is what 10 percent annual compounding means for the Desalination and Brine Refinery vertical.
Year 1: 1 module producing 2.5 billion cubic meters of pure water. Year 5: 1.46 modules equivalent, producing 3.66 billion cubic meters. Year 10: 2.36 modules equivalent, producing 5.9 billion cubic meters. Year 15: 3.80 modules equivalent, producing 9.5 billion cubic meters. Year 20: 6.73 modules equivalent, producing 16.8 billion cubic meters.
But this is only one module’s growth trajectory. The CTMP deployment plan calls for 80 modules distributed globally. Each module compounds independently. The aggregate effect is staggering.
At 80 modules with 10 percent annual compounding for 15 years: Starting capacity equals 200 billion cubic meters per year of pure water (80 modules times 2.5 billion). Year 15 capacity equals 835 billion cubic meters per year. This is approximately 20 times current global desalination capacity. This is enough water to serve 45 billion person-equivalents at WHO minimum standards. This is abundance beyond any definition of scarcity.
The compounding applies equally to mineral recovery. Year 1 mineral revenue across 80 modules: approximately 1.96 trillion dollars. Year 15 mineral revenue at 10 percent compound growth: approximately 8.2 trillion dollars annually. This revenue funds not only continued water infrastructure expansion but also the full spectrum of CTMP verticals: steel, concrete, fertilizer, housing, healthcare, education.
The 10 percent compounding target is not aspirational. It is constitutional. The Sovereign Logic Engine monitors reinvestment flows and flags any deviation from the mandated reinvestment schedule. Investors cannot extract surplus beyond the 50 percent distribution cap. Managers cannot redirect reinvestment funds to non-capacity uses. The growth curve is locked in by governance architecture, not goodwill.
This is the core insight of CTMP: abundance compounds. When you build systems that generate surplus and constitutionally mandate reinvestment of that surplus into more capacity, scarcity becomes mathematically impossible over time. The only variable is how fast you choose to deploy the first modules. After that, the math takes over.

10.1 OPERATING EXPENDITURE AND UNIT ECONOMICS
Annual operating expenditure for combined desalination and brine refinery: Energy cost at one cent per kilowatt-hour for 12 terawatt-hours equals 120 million dollars. Membrane replacement (5-year cycle amortized) equals approximately 250 million dollars per year. Chemicals and consumables equals approximately 130 million dollars per year. Labor (approximately 3,000 direct employees) equals approximately 300 million dollars per year. Maintenance and spare parts equals approximately 150 million dollars per year. Total opex: approximately 950 million dollars per year.
Revenue from brine refinery products at conservative commodity prices: Sodium chloride at 140 million tonnes at 50 dollars per tonne equals 7.0 billion dollars. Potassium chloride at 3.3 million tonnes at 350 dollars per tonne equals 1.15 billion dollars. Magnesium compounds at 6.5 million tonnes at 2,000 dollars per tonne equals 13.0 billion dollars. Calcium sulfate at 10 million tonnes at 30 dollars per tonne equals 300 million dollars. Sodium sulfate at 20 million tonnes at 100 dollars per tonne equals 2.0 billion dollars. Bromine at 330,000 tonnes at 3,000 dollars per tonne equals 1.0 billion dollars. Lithium carbonate at 2,500 tonnes at 20,000 dollars per tonne equals 50 million dollars. Total mineral revenue: approximately 24.5 billion dollars per year.
Net operating surplus: approximately 23.5 billion dollars per year after operating costs.
This surplus funds the free water allocation, contributes to the 50 percent mandatory reinvestment pool, and generates returns for equity investors within constitutional limits.
10.2 BRINE REVENUE, MARKET CONSTRAINTS, AND FIAT CREATION
The mineral stream coming off the brine refinery is very large. At current mid-range commodity prices, the products listed in Section 7 — sodium chloride, potassium chloride, magnesium compounds, sodium sulfate, calcium sulfate (gypsum), bromine and lithium carbonate — represent on the order of 24–26 billion USD per module per year of physical value if all output were sold at today’s prices.
If that figure were naively scaled to an 80-module programme, the result would be roughly 2.0–2.1 trillion USD per year of mineral value at current price levels. That number is useful as an upper bound, but it is not a realistic cash-revenue forecast, because the global markets for these products are much smaller than CTMP’s ultimate production capacity.
As of the mid-2020s, the combined global markets for these mineral categories — industrial salt, potash, magnesium compounds, sodium sulfate, gypsum products, elemental bromine and lithium — are on the order of 180–190 billion USD per year in aggregate. A mature 80-module CTMP deployment physically produces several times the present world demand in some of these categories. That means the brine vertical cannot and will not monetize its full physical output at existing prices without collapsing the markets it is selling into.
For that reason, CTMP treats external mineral revenue as market-share constrained, not production-constrained. The platform will take a corridor-based view of its role in each market and deliberately limit its effective share in order to preserve price stability and avoid uncontrolled displacement of incumbent producers.
A realistic external revenue corridor at full 80-module scale, in 2025 dollars, is therefore defined in terms of global market share:
- At 10 percent combined market share across the mineral basket, external brine revenue sits around 18 billion USD per year.
- At 25 percent combined market share — the reference case for a mature, but not monopolistic, CTMP presence — external brine revenue is approximately 45–46 billion USD per year.
- At 50 percent combined market share — an aggressive, system-dominant case — the external revenue ceiling is about 90–91 billion USD per year.
The internal modelling for the 80-module deployment uses a ramp towards the 25 percent reference case. Illustratively, in constant 2025 dollars:
- Around Year 5 of programme build-out, external mineral sales reach roughly 9 billion USD per year (≈5 percent share).
- Around Year 10, as more modules come online and offtake logistics mature, this rises into the 20–25 billion USD per year range (≈10–15 percent share).
- By Year 20, with the full 80-module fleet in steady operation and CTMP settled into a stable role in each mineral market, external revenue from the brine vertical converges toward 45–46 billion USD per year at ≈25 percent global market share.
These figures sit alongside, not instead of, the per-module operating economics given earlier. At the module level, the brine refinery still generates a very large net operating surplus relative to its ≈950 million USD annual operating expenditure. The difference is that, beyond a certain scale, a growing fraction of the mineral stream is no longer monetized into external fiat revenue but is instead consumed internally as ultra-low-cost feedstock for other CTMP verticals.
The gap between the 2.0–2.1 trillion USD/year physical value of the mineral stream at 80 modules and the 45–90 billion USD/year external-revenue corridor does not disappear. It reappears as:
- Systemic cost suppression for CTMP’s Green Steel, Green Concrete, fertilizer, chemical, semiconductor and housing verticals, which purchase brine-derived inputs at computed cost rather than market price; and
- Pricing leverage in external markets, where CTMP can undercut incumbent producers on finished goods without needing to maximize commodity-grade mineral margins.
The brine vertical is therefore best understood as a dual instrument:
- A steady external fiat generator, contributing on the order of tens of billions of dollars per year at full scale, subject to strict market-share and constitutional constraints; and
- A structural cost-reduction engine that removes hundreds of billions to trillions of dollars of legacy input cost from the rest of the CTMP platform and from host-nation economies over the life of the programme.
All revenue and market share figures above are expressed in approximate 2025 USD, before tax, and are used as planning anchors rather than guarantees.
11. SOVEREIGN LOGIC ENGINE INTEGRATION
The Sovereign Logic Engine (SLE) is the governance enforcement system that ensures constitutional compliance across all CTMP operations. For the Desalination and Brine Refinery vertical, the SLE performs the following functions.
Water allocation tracking: Every cubic meter of water produced is metered, timestamped, and assigned to an allocation category (free public supply, industrial internal, industrial external). The SLE ensures the 2 billion cubic meter free allocation is fulfilled before any commercial sales are recorded.
Quality assurance: Continuous monitoring of water quality parameters (TDS, pH, turbidity, microbial counts) with automatic alerts if product water deviates from WHO standards. Non-compliant batches are automatically diverted to industrial use or recycled through treatment.
Brine composition verification: Continuous monitoring of brine salinity and mineral concentrations to ensure feedstock quality for the refinery. Deviations trigger process adjustments and audit logs.
Transfer pricing enforcement: All internal transfers are logged at computed cost. The SLE prevents any transaction at a price exceeding computed cost plus allowable margin. Attempts to manipulate transfer prices trigger constitutional violation alerts.
Environmental compliance: Discharge monitoring for any residual brine (should be minimal after refinery processing) ensures compliance with local and international environmental standards. Zero-liquid-discharge is the design target.
12. ENVIRONMENTAL FOOTPRINT AND COMPLIANCE
Carbon emissions: Zero direct emissions from desalination operations. All electricity is hydroelectric. No fossil fuel is burned on site. Indirect emissions from equipment manufacturing and construction are offset within 6 to 12 months of operation through displacement of fossil-fuel-powered desalination elsewhere.
Brine discharge: Design target is zero liquid discharge (ZLD). All dissolved solids are recovered as saleable products. Residual moisture is evaporated and condensed for recovery. No hypersaline discharge enters marine environments.
Land use: Approximately 500 hectares per module for desalination and brine refinery facilities. This compares favorably to solar-powered desalination, which would require thousands of hectares of solar panels for equivalent output.
Intake impacts: Intake structures are designed with low-velocity screens to minimize impingement and entrainment of marine organisms. Intake location is selected to avoid sensitive ecosystems. Monitoring programs track marine population impacts and trigger operational adjustments if necessary.
Chemical management: All treatment chemicals are stored, handled, and dosed according to international best practices. Spill containment and emergency response protocols are integrated into plant design. Chemical suppliers are audited for environmental compliance.
13. WORKFORCE AND EMPLOYMENT
The Desalination and Brine Refinery vertical is not a single plant. It is a city-scale industrial complex that processes about 5 billion cubic metres of seawater per year, produces roughly 2.5 billion cubic metres of pure water, and refines about 175 million tonnes of dissolved solids into marketable commodities. The workforce required to build and operate that system must be sized at the same order of magnitude. At steady state, one module supports roughly 45,000 to 55,000 permanent direct operations jobs. These roles cover reverse osmosis and high-recovery plant operators; brine refinery process technicians; evaporator, crystallizer and dryer operators; mineral processing and chemical engineers; quality control and laboratory staff; mechanical, electrical and instrumentation maintenance teams; logistics and materials handling crews; warehouse and packaging operations; environmental monitoring specialists; safety and emergency response; administration and management; and the Sovereign Logic Engine data and systems operations staff that tie the vertical into the wider CTMP platform. Around that core sits a larger ring of indirect and induced employment. Each operating module drives approximately 80,000 to 100,000 additional jobs in transport and shipping, equipment supply and repair, catering and facilities management, housing and community services, healthcare and education for worker families, local manufacturing of consumables and spare parts, and professional services such as legal, accounting and technical consulting. Taken together this yields about 125,000 to 155,000 sustained jobs per module, with a planning median of roughly 140,000 direct plus indirect and induced positions once the vertical has reached operational maturity.
At the scale of 80 modules, that median figure translates into a baseline of about 11.2 million sustained jobs in the Desalination and Brine Refinery vertical alone. That is the Year 0 anchor once the initial 80 modules are in steady operation. The construction side of the story sits on top of that. Building out a single Desalination and Brine Refinery complex requires on the order of 800,000 to 1,000,000 construction job-years over a four-year build window. In simple terms that is about 200,000 to 250,000 construction workers employed continuously for four years for each module. Those workers are drawn from civil and structural trades, concrete, steel erection and earthworks, from mechanical trades such as piping, welding, millwrighting and rotating equipment, from electrical and instrumentation crews, from specialized membrane and process-equipment installation teams, from commissioning and startup engineers and technicians, from quality assurance and inspection, from safety and occupational health, from project management and engineering, and from logistics and heavy lift and materials handling. Across an 80-module programme, that construction load accumulates to roughly 64 to 80 million construction job-years in this vertical alone. If that programme is deployed over about twenty years with staggered four-year build windows, the average global construction workforce dedicated to Desalination and Brine Refinery remains in the range of about 3.2 to 4.0 million people at any given time, with peak years modestly above that as multiple modules overlap in late-stage ramp.
On top of that static picture sits the constitutional ten percent annual capacity expansion rule. Capacity in this vertical is not allowed to sit still; it must grow at roughly ten percent per year, and because this is a physically operated system the workforce must grow with it. Using the 80-module, 11.2-million-job baseline as Year 0, and applying true ten percent annual compounding on capacity, total sustained operations and induced employment in this vertical scales as 11.2 million multiplied by 1.10 to the power of t, where t is years after the baseline. By Year 5 the factor is about 1.61, which yields approximately 18.0 million sustained jobs. By Year 10 the factor is about 2.59, which yields about 29.0 million jobs. By Year 15 the factor is about 4.18, which yields about 46.8 million jobs. By Year 20 the factor is about 6.73, which yields about 75.3 million sustained operations and induced jobs in the Desalination and Brine Refinery vertical alone. These are not loose ranges; they are explicit compounding outcomes from the ten percent rule given the chosen per-module employment anchor. In parallel, the need to add capacity every year in order to maintain that ten percent expansion means construction never falls to zero. By Year 20 the vertical generates on the order of four to five million construction job-years per year across all geographies as new modules are added and older infrastructure is expanded or refurbished.
To support that scale of mobilisation, CTMP runs dedicated training academies aligned with this vertical. Short bridge programmes of roughly six to twelve weeks are used to bring in workers from legacy oil and gas, mining, thermal power generation and other heavy industrial sectors, recognising that skills in rotating equipment, welding, high-pressure systems, control rooms and environmental health and safety transfer directly into high-pressure desalination and brine refinery work. Longer technical and vocational pathways provide stackable credentials in electromechanical systems, high-voltage operations, process instrumentation, industrial control systems and process safety. Advanced tracks cover membrane science, mineral processing chemistry, crystallisation engineering and integrated water-and-materials plant operation. All training outcomes and credentials are logged as cryptographically verifiable records in the Sovereign Logic Engine. That gives host governments and operators a real-time view of the skills mix and experience embedded in the workforce, and it allows workers to move across borders and modules without degrading safety standards or process discipline.
The compensation and protection framework is designed so that these jobs are not disposable. All positions in this vertical pay at or above relevant local industrial medians and carry full benefits, including health coverage, housing assistance where appropriate, retirement contributions and family support services. The model does not rely on misclassifying long-term workers as temporary or contract staff in order to avoid obligations. Working hours, fatigue management rules, rotation schedules and worker housing standards are encoded as machine-verifiable constraints inside the Sovereign Logic Engine. Violations show up in the systems telemetry as faults in the same way that pressure excursions or temperature anomalies do. Independent labour audits and anonymous grievance channels are mandatory. Universal stop-work authority is granted to every worker on every site without retaliation; any person who identifies an unsafe condition or a breach of SLE rules can halt the work, and that halt automatically triggers investigation paths. Inclusion is designed into the facilities from the start. Personal protective equipment is specified and procured to fit all body types. Sanitation and hygiene infrastructure, lighting and wayfinding are designed to standards that allow full participation regardless of gender or background. Childcare and transport are provisioned where culture and geography make them appropriate, so that the limiting factor on employment is willingness and skill, not basic infrastructure gaps.
The key point is that the workforce is not a side effect of the water infrastructure. The workforce is the mechanism through which abundance is delivered. Every cubic metre of water produced requires human hands and minds to design, operate, maintain and monitor the plant. Every tonne of mineral recovered pushes value out into wages and local spending rather than being captured purely as financial rent. Under a ten percent annual expansion rule, by Year 20 the Desalination and Brine Refinery vertical by itself supports about 75.3 million ongoing full-time operations and induced jobs, plus a continuously renewing layer of several million construction workers in any given year and a cumulative construction load in the tens of millions of job-years. When this is combined with the construction and operations employment in the other sixteen CTMP verticals, the aggregate workforce mobilisation reaches into the hundreds of millions of people. That is re-industrialisation at planetary scale, with value creation relocated from extractive finance into the hands of builders, and with planetary repair treated as paid work rather than an unfunded afterthought.
14. RISK ANALYSIS AND MITIGATION
Technology risk: Reverse osmosis is a mature technology with over 50 years of commercial deployment. Membrane performance, energy consumption, and reliability are well characterized. Risk mitigation: multiple membrane suppliers, modular design allowing component replacement, continuous R&D for next-generation membranes.
Feedstock risk: Seawater composition is highly stable over time. Seasonal variations in temperature and salinity are predictable and manageable through process adjustments. Risk mitigation: intake location selection, blending capabilities, robust pre-treatment design.
Market risk (minerals): Commodity prices fluctuate. A sustained price collapse in one mineral category could reduce revenue. Risk mitigation: diversified mineral portfolio (no single mineral exceeds 60 percent of revenue), internal consumption absorbs volume regardless of external prices, storage capacity allows inventory holding during price troughs.
Political risk: Host government relations could deteriorate. Regulatory changes could impose new costs or restrictions. Risk mitigation: constitutional framework with international arbitration provisions, local employment and community investment create political constituency for project continuity, transparent operations reduce basis for conflict.
Climate risk: Sea level rise and increased storm intensity could affect coastal infrastructure. Risk mitigation: facilities designed to withstand Category 5 hurricane conditions, intake structures rated for 2-meter sea level rise, insurance coverage for catastrophic events.

15. GOVERNANCE AND CONSTITUTIONAL CONSTRAINTS
The Desalination and Brine Refinery vertical operates under the CTMP constitutional framework, which hard-codes both the rules and the consequences of breaking them.
Free water allocation. Each module must deliver a minimum of 2 billion cubic metres per year of potable water free of charge to host nation citizens. This allocation cannot be reduced, redirected, collateralized, or monetized under any circumstances. The Sovereign Logic Engine continuously compares actual free water delivery to the mandated block. If it detects that more than 10 percent of the required free allocation has been charged for, diverted, or bundled into commercial contracts, it automatically suspends additional water allocations to the offending utility or intermediary until the breach is cured. If the deviation exceeds 20 percent, SLE escalates to long-duration or permanent lockout from CTMP water.
Equity caps. No single investor, investor group, or coordinated investor class may control more than 35 percent of the equity in this vertical. The Sovereign Logic Engine tracks ultimate beneficial ownership across all layers. If any holder crosses the 35 percent threshold or attempts to route effective control through proxies, SLE freezes distributions on the excess stake and flags the position for compulsory unwind. If effective control exceeds the cap by more than 10 percent, the offending holder is automatically excluded from new issuances and governance processes. If the excess exceeds 20 percent or is repeated, SLE can impose long-term or permanent exclusion from equity participation in this vertical.
No debt. All capital for this vertical must be raised through equity or retained earnings. No bonds, loans, securitisations, or other debt instruments may be issued against its assets or cash flows. If SLE detects any debt-like instrument that has recourse to this vertical’s assets or cash flows, or any security interest granted over them, it treats that structure as a constitutional violation and locks out the associated counterparties from dividends, water and commodity offtake contracts, and future participation until the offending instruments are fully unwound.
Reinvestment mandate. A minimum of 50 percent of net operating surplus must be reinvested in CTMP capacity expansion, lifecycle maintenance, and resilience. Distributions to equity holders are capped at 50 percent of surplus after reinvestment obligations are met. SLE monitors reinvestment ratios and distributions over rolling periods. If distributions rise more than 10 percent above the permitted corridor, or if reinvestment falls more than 10 percent below the mandate, SLE automatically suspends further distributions and new offtake allocations from this vertical until the shortfall is corrected. Deviations of more than 20 percent trigger extended lockout and formal breach proceedings.
No IPO ever. This vertical may not be listed on any public stock exchange. Its shares may be transferred only between qualified holders under the constitutional equity rules and subject to SLE registration. Any attempt to structure a listing, synthetic ETF, or similar public security that directly represents equity in this vertical is treated as non-compliant. SLE denies use of CTMP data and branding to such instruments and can bar the issuer and its affiliates from equity participation and offtake contracts in this vertical for defined periods, with harsher sanctions for repeat attempts.
Audit and transparency. All operations are subject to continuous telemetry and rule-checking by the Sovereign Logic Engine, plus annual independent audits. Audit reports, SLE compliance summaries, and exception logs are published in a form that is replication-safe but substantively complete. Where SLE or independent audit identifies systematic variance from constitutional rules greater than 10 percent (for example in free water allocation, equity caps, reinvestment ratios, or tariff corridors), SLE escalates from warnings to automatic lockout: suspension of allocations, distributions, and new contracts for the offending entities. Breaches above 20 percent, or repeated violations, trigger long-duration or permanent exclusion until cured and publicly certified.
16. PROFOUND IMPLICATIONS
What we are building here is not a water plant. It is the end of water scarcity as a political instrument.
For decades, water has been used as a tool of control. Governments ration it to reward loyalty and punish dissent. Corporations privatize it to extract rents from the desperate. Development agencies condition it on policy reforms that serve donor interests. The assumption underlying all of these behaviors is that water is scarce and someone must decide who gets it.
CTMP destroys that assumption. When a single module can provide 2 billion cubic meters of free water annually, serving over 100 million people at WHO minimum standards, the politics of water scarcity become obsolete. No one needs to beg for water. No one needs to pay bribes for water. No one needs to accept unjust conditions in exchange for water. The water simply exists, constitutionally guaranteed, metered and tracked by systems that cannot be corrupted.
The brine refinery represents something equally profound: the transformation of an environmental liability into economic abundance. Legacy desalination creates a waste stream that damages marine ecosystems and creates disposal costs. CTMP creates a revenue stream worth up to 24.5 billion dollars per year in strategic materials. The same seawater that provides drinking water also provides fertilizer for agriculture, magnesium for lightweight vehicles, lithium for batteries, and bromine for pharmaceuticals.
This is what we mean by abundance over scarcity. We are not managing scarcity more efficiently. We are eliminating scarcity by building systems that produce more than people need and giving the surplus away.
The mortality implications are staggering. Approximately 1.4 million people die every year from diseases caused by unsafe water and inadequate sanitation. At 80-module scale, CTMP can provide safe water to over 8 billion person-equivalents annually. The math is simple: deploy the system, and most of those deaths stop.
Every day of delay is a choice. It is a choice to let people die who did not have to die. It is a choice to maintain a system of artificial scarcity that serves no one except those who profit from controlling access to necessities. It is a choice to preserve a logic that has failed humanity for generations.
We are offering a different choice. Build the system. Deploy the modules. Give the water away. Let the minerals fund the expansion. Compound the abundance until scarcity is a memory.
This is not charity. This is not aid. This is engineering. Physics does not care about your ideology. Gravity does not negotiate. Seawater does not discriminate. The system works because the math works, and the math works because we refused to accept constraints that exist only in accounting ledgers and policy documents.
The Death Clock at https://chriscoodectmp.github.io/index.html counts 1,382 preventable deaths per day. Many of those deaths are from waterborne disease. Every day we delay deployment, the count increases. Every day we debate whether this is feasible, children die from drinking water that should have been safe.
We know how to stop it. We have the technology. We have the capital structure. We have the governance framework. The only thing we lack is permission from a world that has convinced itself that abundance is impossible.
END OF DOCUMENT
1,382 lives per day. Every day. Until we build.
1. CTMP internal references
- Coode, C. M. (2025). Desalination and Brine Refinery: The Vertical. Internal CTMP technical and economic blueprint for the Desalination and Brine Refinery vertical, including throughput anchors, mineral recovery volumes, internal pricing logic, and workforce scaling.
- Coode, C. M. (2025). Global Workforce Mobilization: Scientific Assessment of System Scale Socioeconomic Impacts of the Largest Deployment Workforce in Human History. Internal CTMP employment and labour mobilization study used for cross checking vertical level job anchors and 10 percent compounding logic across operations and construction job years.
- Coode, C. M. (2025). The Death Clock: Why Every Day of Delay Costs 1,382 Lives. Internal CTMP epidemiological methodology paper that derives the 1,382 preventable deaths per day figure from WHO, HEI, IHME, UNICEF and IPCC datasets and defines the CTMP addressable fraction of global air pollution and WASH mortality.
- Coode, C. M. (2025). A People’s Audit of Power, Price, and Permission. CTMP doctrinal essay that connects the Death Clock logic, LCOE corridor, tariff architecture, no debt rules and the Sovereign Logic Engine into a single governance and economic framework.
- Coode, C. M. (2025). Green Concrete Manufacturing: The Vertical. CTMP internal vertical masterfile used in this document for gypsum flows, water requirements and cross vertical integration with Desal and Brine outputs.
- Coode, C. M. (2025). Green Steel Production: The Vertical. CTMP internal vertical masterfile providing anchors for hydrogen based DRI, process water requirements and magnesium and flux inputs coming from the Brine Refinery.
2. Global water, WASH mortality and minimum water requirements
- World Health Organization (2023). Unsafe water, sanitation and hygiene: a persistent health burden. WHO, Geneva. WHO environmental burden of disease assessment that attributes roughly 1.4 million deaths per year to unsafe water, sanitation and hygiene (WASH), which is the baseline used for the WASH component of the Death Clock.
- WHO and UNICEF Joint Monitoring Programme (JMP) for Water Supply, Sanitation and Hygiene (2023). Progress on household drinking water, sanitation and hygiene 2000–2022. WHO and UNICEF, Geneva and New York. Provides global coverage data for access to safely managed drinking water and sanitation, and the exposed population that CTMP scale deployment can realistically reach.
- World Health Organization (2022, updated). Drinking water: Key facts. WHO Fact Sheet. Summarises the health impacts of unsafe drinking water and WASH, including diarrhoeal mortality, and underpins the statement that hundreds of thousands of deaths per year are attributable to unsafe drinking water that can be prevented by improved water and sanitation.
- Howard, G., and Bartram, J. (2003). Domestic Water Quantity, Service Level and Health. World Health Organization, Geneva. Classic WHO technical report that links service level to health outcomes and supports typical domestic use of about 50 litres per person per day when water is on plot, which is the anchor for your 50 L per person per day minimum requirement.
- Howard, G., Bartram, J., and colleagues (2020). Domestic Water Quantity, Service Level and Health, Second Edition. World Health Organization, Geneva. Updated synthesis reinforcing the earlier 50 litres per person per day basic requirement and providing further evidence on health impacts of different service levels.
- Gleick, P. H. (1996). Basic water requirements for human activities: Meeting basic needs. Water International, 21(2), 83–92. Proposes a basic water requirement of about 50 litres per person per day for drinking, cooking, sanitation and hygiene, widely cited and embedded in later WHO and UN water guidance.
3. Air pollution, energy transition and the Death Clock baselines
- World Health Organization (2023). Air pollution. WHO Health Topics / Fact Sheet. States that air pollution is responsible for around 7 million premature deaths every year worldwide from stroke, heart disease, lung cancer and respiratory disease, which is the air pollution component of the Death Clock baseline.
- Health Effects Institute and Institute for Health Metrics and Evaluation (2024). State of Global Air 2024. Health Effects Institute, Boston. Uses Global Burden of Disease methods to estimate around 6.5 to 6.7 million deaths per year attributable to air pollution in recent years, consistent with and refining the WHO 7 million estimate and providing a range for CTMP’s share analysis.
- World Health Organization (2020). WHO methods and data sources for global burden of disease estimates 2000–2019 (WHO/DDI/DNA/GHE/2020.3). WHO, Geneva. Sets out standard WHO methods for estimating mortality attributable to environmental risk factors using population attributable fractions and relative risks, which your Death Clock paper follows when defining the CTMP addressable fraction of air pollution and WASH deaths.
- IPCC (2022). Climate Change 2022: Impacts, Adaptation and Vulnerability. Contribution of Working Group II to the Sixth Assessment Report. Intergovernmental Panel on Climate Change, Geneva. Frames air pollution and water related mortality as climate sensitive health outcomes and discusses health co benefits of decarbonisation and clean water infrastructure, supporting your treatment of a subset of these deaths as preventable by CTMP scale deployment.
4. Seawater composition and salinity anchors
- USGS Water Science School (2018). Saline Water and Salinity. United States Geological Survey. Describes the USGS salinity scale and notes that typical ocean water contains about 35,000 ppm (35 g/L) of dissolved salts, which is the base salinity anchor for your 35 g/L seawater assumption.
- NOAA JetStream (2023). Sea Water. National Oceanic and Atmospheric Administration. States that sea water is mainly sodium and chloride with typical salinity around 35 parts per thousand, supporting your 35 g/L total dissolved solids anchor.
- Unacademy (Notes on Seawater). Summarises standard ocean chemistry data, noting sodium and chloride values of roughly 10.8 g/L and 19.4 g/L respectively, with other major ions magnesium about 1.3 g/L, calcium about 0.4 g/L, potassium about 0.4 g/L and sulfate about 2.7 g/L, which is consistent with the ion composition and mineral mass flows you use in the brine refinery section.
- Lenntech. Major ion composition of seawater. Provides tabulated major ion composition for typical seawater, corroborating the relative proportions of chloride, sodium, sulfate, magnesium, calcium and potassium used to derive the 175 million tonnes of dissolved solids per module and the breakdown by commodity.
5. Desalination technologies, energy intensity, costs and market context
- Nassrullah, H. et al. (2020). Energy for desalination: A state of the art review. Desalination. Reviews specific energy consumption of desalination technologies and confirms that modern seawater reverse osmosis typically operates at around 3 kWh per cubic metre of product water, with total plant consumption a little higher when pre treatment and post treatment are included.
- USGS Water Science School (Desalination). United States Geological Survey. Describes reverse osmosis desalination processes and highlights that desalination is energy intensive because of the need to push saline water through membranes at high pressure.
- International Desalination Association / USSU Engineering summary (Seawater Reverse Osmosis Systems). Notes that with modern energy recovery devices, seawater RO energy consumption has dropped to around 3 kWh per cubic metre, and that RO accounts for roughly two thirds of installed global desalination capacity and nearly all new plants, which aligns with your statement that RO is the dominant technology and consumes about 3 to 4 kWh per cubic metre.
- Nassrullah, H. et al. (2020) and Ghaffour, N. et al. (2013) as synthesised in Dooley, J. (2014). Bounding the marginal cost of producing potable water using reverse osmosis desalination. PNNL 23303. Report levelised seawater RO product water costs around 0.8 to 1.5 USD per cubic metre in many settings, with energy typically 30 to 60 cents per cubic metre at grid prices of 0.10 to 0.15 USD per kWh, which underpins your comparison between legacy desal costs and CTMP internal energy pricing at 0.01 USD per kWh.
- International Energy Agency (2024). Energy is vital to a well functioning water sector. IEA Commentary. Discusses the energy intensity of desalination, noting that desalination often requires over 1 kWh of electricity per cubic metre and highlighting the rising energy burden of desalination in the Middle East, reinforcing your framing that desal’s main constraint is energy cost.
- Rosa, L. et al. (2025). Global energy, costs, and emissions from reverse osmosis desalination under climate change. Water Research. Quantifies global energy use and cost ranges for reverse osmosis desalination (tens of billions of dollars per year) and reinforces the conclusion that when energy prices are high, water tariffs must either rise, be subsidised, or be rationed, which matches your political economy framing of legacy desalination.
- Global Water Intelligence and IRENA (2012 onwards). Water desalination using renewable energy and subsequent market updates. Open summaries indicate global installed desalination capacity on the order of 95 million cubic metres per day by the late 2010s, dominated by RO, supporting the statement that CTMP scale deployment would be equivalent to a step change relative to current global desalination capacity.
6. Brine production, environmental impacts and ZLD framing
- Jones, E. et al. (2019). The state of desalination and brine production: A global outlook. Science of the Total Environment, 657, 1343–1356. Estimates that global desalination plants produce around 141.5 million cubic metres of brine per day and documents the environmental risks associated with hypersaline brine discharge into coastal waters, which underpins your description of legacy brine as an environmental liability.
- United Nations University Institute for Water, Environment and Health (2019). Global brine production and a pathway to minimal impact. UNEP and UNU policy discussion of brine management and the potential for resource recovery, supporting the idea that brine can be reframed as a mineral feedstock rather than a waste stream when cheap clean energy is available.
- Sayed, E. T. et al. (2023). Recent progress in renewable energy based desalination technologies. Renewable and Sustainable Energy Reviews. Reviews energy and cost metrics for renewable powered desalination systems and provides examples of levelised cost of water around 0.8 USD per cubic metre at specific energy consumption of several kWh per cubic metre, which makes clear how large the cost delta is between legacy plants and the CTMP internal 0.01 USD per kWh anchor.
7. Governance, employment and just transition framing
- International Labour Organization (2018). World Employment and Social Outlook 2018: Greening with Jobs. Explores employment impacts of large scale green infrastructure and energy transition, providing context for your statement that tens of millions of jobs can be created through industrial scale decarbonisation and infrastructure buildout, and supporting your emphasis on dignified, non disposable work in the Desal and Brine workforce section.
- OECD (2017). Investing in Climate, Investing in Growth. Organisation for Economic Co operation and Development, Paris. Analyses macroeconomic effects of large low carbon infrastructure programmes and finds that sustained green investment can raise growth and employment while cutting emissions, which is consistent with your description of CTMP verticals as a planetary scale re industrialisation programme rather than a narrow utility asset.
메타데이터
- post_id
- c4b2b65d634f
- slug
- desalination-and-brine-refinery-c4b2b65d634f
- url
- https://medium.com/@chris_16327/desalination-and-brine-refinery-c4b2b65d634f
- canonical_url
- https://medium.com/@chris_16327/desalination-and-brine-refinery-c4b2b65d634f
- author_url
- https://medium.com/@chris_16327
- status
- ok
- fetched_at
- 2026-07-11 09:08:54