From Theory to Reality: How Rising Volume at Coinmetro Is Driving Accelerating XCM Buybacks
Why real trading activity is now shrinking XCM supply faster than ever and what that means for long-term price
From Theory to Reality: How Rising Volume at Coinmetro Is Driving Accelerating XCM Buybacks
Why real trading activity is now shrinking XCM supply faster than ever and what that means for long-term price
When I previously wrote about XCM tokenomics (link), the focus was on design; how volume linked buybacks create a powerful, counter cyclical and deflationary mechanism.
Today, we can move beyond theory.
We now have evidence that XCM buybacks are accelerating, and that this acceleration aligns exactly with what the model predicts:
Higher trading volume → larger buyback budgets → faster removal of XCM from circulation.
This article explains:
- Why increasing volume mechanically drives larger XCM buybacks
- How historical data already confirms this acceleration
- And how, if current trends persist, the remaining ~300 million XCM supply can be bought back in a relatively short time horizon
The Core Mechanism: Volume Drives Buybacks
XCM buybacks are funded from platform activity.
In simple terms:
XCM bought back = (Trading Volume × Fee Rate × Buyback Allocation) / XCM Price
This creates two powerful properties:
- Higher volume increases the buyback budget
- Lower XCM price increases the number of tokens removed per euro spent
Both work in favor of long-term holders.
Unlike discretionary corporate buybacks, this mechanism is deterministic and mechanical. There is no management timing and no subjective decision-making.
What the Math Implies in Practice
Below is a simplified scenario table showing how many XCM tokens can be bought back under different combinations of volume and XCM price.
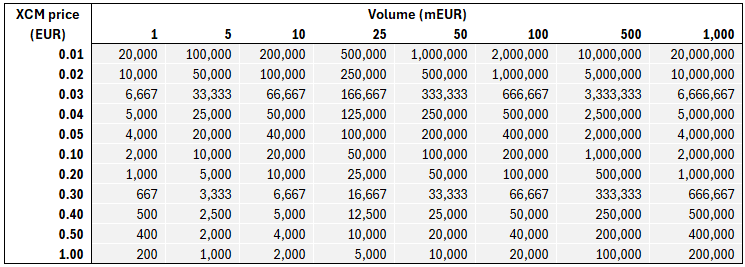
Disclaimer: The XCM amounts shown in this table are based on historical averages reflecting the mix of trading products and applicable platform discounts. While these assumptions have been consistent within small deviations, future variations may differ and are not guaranteed to remain within the same range.
Two conclusions stand out:
- Doubling volume doubles buybacks
- Halving price doubles buybacks
This creates a self-strengthening deflation engine.
How Long to Buy Back the Remaining 300 Million XCM?
Using the same assumptions, we can estimate how many weeks it would take to buy back the remaining ~300,000,000 XCM supply at different volume and XCM prices.
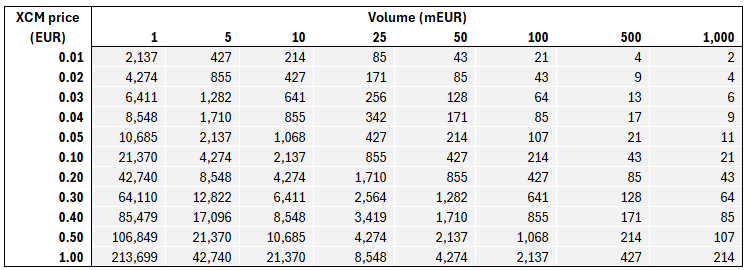
Even at moderate prices, higher volume environments compress timelines dramatically.
Buybacks in Reality: Accumulation Is Already Accelerating
Below chart shows the cumulative number of XCM tokens bought back over time.
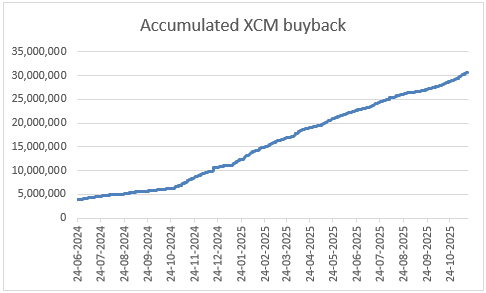
Two things stand out clearly:
- Early periods show slow, shallow accumulation
- The most recent year shows a much steeper slope
In other words, the majority of all historical XCM buybacks have occurred in the most recent year.
This is exactly what a volume-linked model predicts.
Why Acceleration Matters More Than Absolute Numbers
Many people focus on today’s buyback amount. What matters more is the rate of change.
If buybacks are accelerating:
- Supply shrinks faster each year
- Each remaining token represents a growing share of the network
- Long-term scarcity compounds
This is how powerful supply side dynamics quietly build.
The Long-Term Feedback Loop
If current trends continue:
- Volume grows
- Buybacks grow
- Circulating supply shrinks
- Scarcity increases
- Price pressure increases
- Higher price attracts more attention and volume
- Loop repeats
Even if price stays flat, tokens continue to be removed and ownership concentration increases.
Price appreciation becomes a consequence, not a requirement.
Why This Model Is Structurally Strong
- No inflation
- No emissions-based dilution
- No discretionary monetary policy
- Buybacks funded by real economic activity
That combination is rare in crypto.
Final Thought
Most crypto projects talk about deflation.
Very few can demonstrate:
- A mechanical formula
- Historical acceleration
- And a clear path to removing a large share of supply
XCM can.
And that difference matters.
Previous article: XCM tokenomics: The crypto equivalent of a “Gift from Heaven”
메타데이터
- post_id
- c5259bb1871c
- slug
- from-theory-to-reality-how-rising-volume-at-coinmetro-is-driving-accelerating-xcm-buybacks-c5259bb1871c
- url
- https://medium.com/@cryptoneurox/from-theory-to-reality-how-rising-volume-at-coinmetro-is-driving-accelerating-xcm-buybacks-c5259bb1871c
- canonical_url
- https://medium.com/@cryptoneurox/from-theory-to-reality-how-rising-volume-at-coinmetro-is-driving-accelerating-xcm-buybacks-c5259bb1871c
- author_url
- https://medium.com/@cryptoneurox
- status
- ok
- fetched_at
- 2026-06-14 11:28:49



