Cortex vs VictoriaMetrics: Why Scalable Prometheus Is Not Always the Best Prometheus
A few years ago, observability was relatively simple. Most teams had a Prometheus instance scraping metrics from a handful of services…
Cortex vs VictoriaMetrics: Why Scalable Prometheus Is Not Always the Best Prometheus
A few years ago, observability was relatively simple. Most teams had a Prometheus instance scraping metrics from a handful of services, maybe a small Kubernetes cluster, and that was enough. Queries were fast, retention was manageable, and operational complexity stayed low. But cloud-native systems changed the scale of everything. Suddenly companies were running dozens of clusters, thousands of pods, and millions of active time series. Prometheus was still excellent, but people slowly started discovering something uncomfortable: Prometheus itself was never designed to become a globally distributed observability platform.
That realization is what led many organizations toward systems like Cortex and VictoriaMetrics. At first glance, both appear to solve the exact same problem. They both ingest Prometheus metrics, both integrate with Grafana, both support PromQL-compatible queries, and both promise horizontal scalability. But once you start operating them at scale, you realize they are fundamentally different philosophies disguised as similar products.
The easiest way to understand Cortex is to stop thinking of it as “a database for Prometheus metrics.” Cortex is closer to a distributed platform built around Prometheus semantics. Its goal is not merely storing metrics efficiently. Its goal is turning Prometheus into something that behaves like a cloud-native multi-tenant service.
Traditional Prometheus stores data locally inside its own TSDB. That design is one of the reasons Prometheus became so successful in the first place. It is simple, fast, and operationally elegant. But simplicity eventually becomes a limitation. A single Prometheus server owns its storage, memory, and retention. If your environment grows enough, you begin hitting unavoidable constraints. Retention becomes expensive because SSD usage explodes. Queries become slower as cardinality increases. Federation starts multiplying complexity. And multi-cluster visibility becomes fragmented across many isolated Prometheus instances.
Cortex was built specifically to break those limitations apart.
Instead of having one monolithic Prometheus server responsible for everything, Cortex decomposes the problem into many distributed services. Metrics are received by distributors, temporarily held by ingesters, written into object storage, compacted into larger blocks, indexed for querying, and later retrieved through distributed query components. The first time you look at a production Cortex deployment, it almost resembles a miniature cloud platform more than a monitoring stack.
That architecture changes the economics of observability dramatically. Historical metrics no longer need to remain on expensive SSD volumes attached to Prometheus servers. Instead, blocks can live inside S3, GCS, or Azure Blob Storage for months or years at relatively low cost. In theory, this is extremely attractive. Object storage is cheap, highly durable, and infinitely scalable. Cortex essentially leverages that model to transform Prometheus into something capable of operating across huge environments.
The tradeoff, however, appears almost immediately.
The moment you move observability into a distributed architecture, you inherit all the problems distributed systems bring with them. Query execution becomes more complicated because queries may involve multiple services, remote object storage access, index lookups, caching layers, and network latency. Suddenly observability itself starts requiring observability. You now need to think about cache hit ratios, object storage latency, query splitting, compaction cycles, ring consistency, tenant isolation, and ingestion backpressure.
This is the point where many teams realize Cortex is incredibly powerful, but also incredibly operationally expensive.
And this is exactly where VictoriaMetrics enters the conversation with a radically different philosophy.
VictoriaMetrics looks at the same observability problem and arrives at almost the opposite conclusion. Instead of building a deeply modular distributed metrics platform, VictoriaMetrics focuses obsessively on efficiency and simplicity. You can feel this difference immediately. A minimal VictoriaMetrics deployment can start from a single binary. You can launch it with Docker in seconds, point Prometheus remote_write toward it, and immediately begin storing metrics at surprisingly large scale.
That simplicity is not accidental. VictoriaMetrics deliberately minimizes the number of moving pieces involved in operating a metrics backend. Even its clustered architecture remains relatively compact compared to Cortex. Instead of a large constellation of specialized services, the VictoriaMetrics ecosystem revolves around a much smaller set of components responsible for ingestion, storage, and querying.
Operationally, this changes everything.
One of the biggest hidden costs in observability is not infrastructure spending itself. It is engineering attention. Every additional distributed component becomes another source of incidents, tuning, debugging, scaling, and maintenance. Cortex can absolutely scale to enormous workloads, but the complexity tax is real. Many teams underestimate how much operational maturity is required before a system like Cortex becomes pleasant to run.
VictoriaMetrics often wins simply because it allows teams to spend less time operating their observability platform and more time using it.
This is also why benchmark comparisons between the two can sometimes be misleading. People often compare raw ingestion throughput or query speed without considering operational context. VictoriaMetrics has a reputation for being extremely resource efficient. Many teams report significantly lower RAM usage and lower storage overhead compared to more distributed Prometheus-compatible systems. Queries are often fast not because VictoriaMetrics has magical algorithms, but because its architecture introduces fewer distributed hops and less indirection.
A large Cortex query may traverse multiple layers before returning results. The request may pass through a query frontend, split into shards, routed through queriers, resolved against ingesters, partially fetched from object storage, merged with historical blocks, and reconstructed from compressed chunks. Each step is logical and justified, but every step also adds latency and operational surface area.
VictoriaMetrics tends to avoid much of that complexity. The system is simply narrower in architectural scope.
That does not mean Cortex is a mistake. In fact, Cortex solves problems VictoriaMetrics is not always optimized for. Multi-tenancy is a good example. Cortex was designed from the beginning around the idea that multiple independent tenants would coexist inside the same observability backend. Requests can carry tenant identifiers, allowing strong logical isolation between customers, environments, or organizations. This becomes extremely important if you are building an internal observability platform for many teams or running a SaaS product where different customers share infrastructure.
At that point, Cortex starts making far more sense. You are no longer solving “how do I store metrics efficiently?” You are solving “how do I operate observability as a large-scale platform service?”
That distinction matters enormously.
One of the reasons many engineers become disappointed with Cortex is because they adopt it before they truly need the problems it solves. They hear words like “infinite scalability” and assume that means “better.” But scalability always comes with tradeoffs. Distributed systems are never free. The complexity is merely moved somewhere else.
In practice, most organizations are not operating hundreds of Kubernetes clusters with strict tenant isolation requirements and year-long retention mandates. Most organizations simply need reliable metrics storage, reasonable query performance, and operational simplicity. For those environments, VictoriaMetrics often feels far more practical.
There is another subtle point here that people rarely discuss openly: object storage itself changes query behavior dramatically.
One of Cortex’s biggest strengths is also one of its biggest weaknesses. Using object storage for historical metrics retention is economically brilliant, but object storage is fundamentally slower than local TSDB access. Once queries begin touching historical blocks, performance becomes heavily dependent on caching efficiency, compaction strategies, and storage layout. Without aggressive optimization, queries across large historical windows can become noticeably slower.
This is one reason systems like Cortex rely so heavily on caching infrastructure and query optimization layers. Those systems are not optional luxuries. They are necessary to compensate for the realities of remote object storage.
VictoriaMetrics largely avoids this problem by approaching storage differently. That difference
Cortex vs VictoriaMetrics: Why “Infinite Scalability” Comes With a Price
A few years ago, Prometheus felt almost magical.
You installed it, pointed it at a few Kubernetes services, opened Grafana, and suddenly your infrastructure became visible. CPU usage, pod restarts, latency, request rates — everything appeared in clean PromQL graphs. For small and medium environments, Prometheus was elegant. One binary, one TSDB, one operational model.
Then Kubernetes exploded.
Suddenly companies were running:
- dozens of clusters,
- thousands of nodes,
- millions of active time series,
- and observability pipelines generating more data than some production applications.
That was the moment many teams discovered the hidden truth about Prometheus:
Prometheus is an amazing monitoring system, but it was never designed to become a globally distributed observability platform.
That realization is what created systems like Cortex and later alternatives like VictoriaMetrics.
At first glance, both seem very similar. They both ingest Prometheus metrics, both support PromQL-compatible querying, both integrate with Grafana, and both promise massive scalability.
But once you operate them in real environments, you realize something important:
They are solving completely different problems.
The Day Prometheus Stops Being Simple
Prometheus works beautifully while the world remains small.
A typical setup looks something like this:
Kubernetes Cluster
        |
   Prometheus
        |
   Local TSDB
        |
     Grafana
And honestly, for many teams, this is still enough.
The problems begin slowly.
At first, retention becomes painful. Your Prometheus disks start growing faster than expected. Then teams want longer historical windows. Someone asks for six months of retention. Another team wants cross-cluster dashboards. Suddenly developers are querying hundreds of millions of series with badly designed labels.
Then cardinality hits.
And cardinality always hits eventually.
A metric like this seems harmless:
http_requests_totalUntil someone adds:
path=/product/123456789Now Prometheus is not storing “one metric.” It is storing millions of unique label combinations.
This is where Prometheus starts fighting back.
Queries slow down. Memory usage grows. WAL pressure increases. Storage explodes. Federation becomes messy. Teams deploy more Prometheus servers, then more federation layers, then more hacks.
At some point, observability itself starts becoming infrastructure.
That is the exact problem Cortex was designed to solve.
What Cortex Actually Is
Most people describe Cortex incorrectly.
They call it:
“a scalable Prometheus.”
That description is far too simplistic.
Cortex is closer to a distributed metrics platform built around the Prometheus data model. It keeps Prometheus compatibility while completely changing the architecture underneath.
Instead of a single TSDB, Cortex decomposes the entire system into distributed services.
The architecture looks roughly like this:
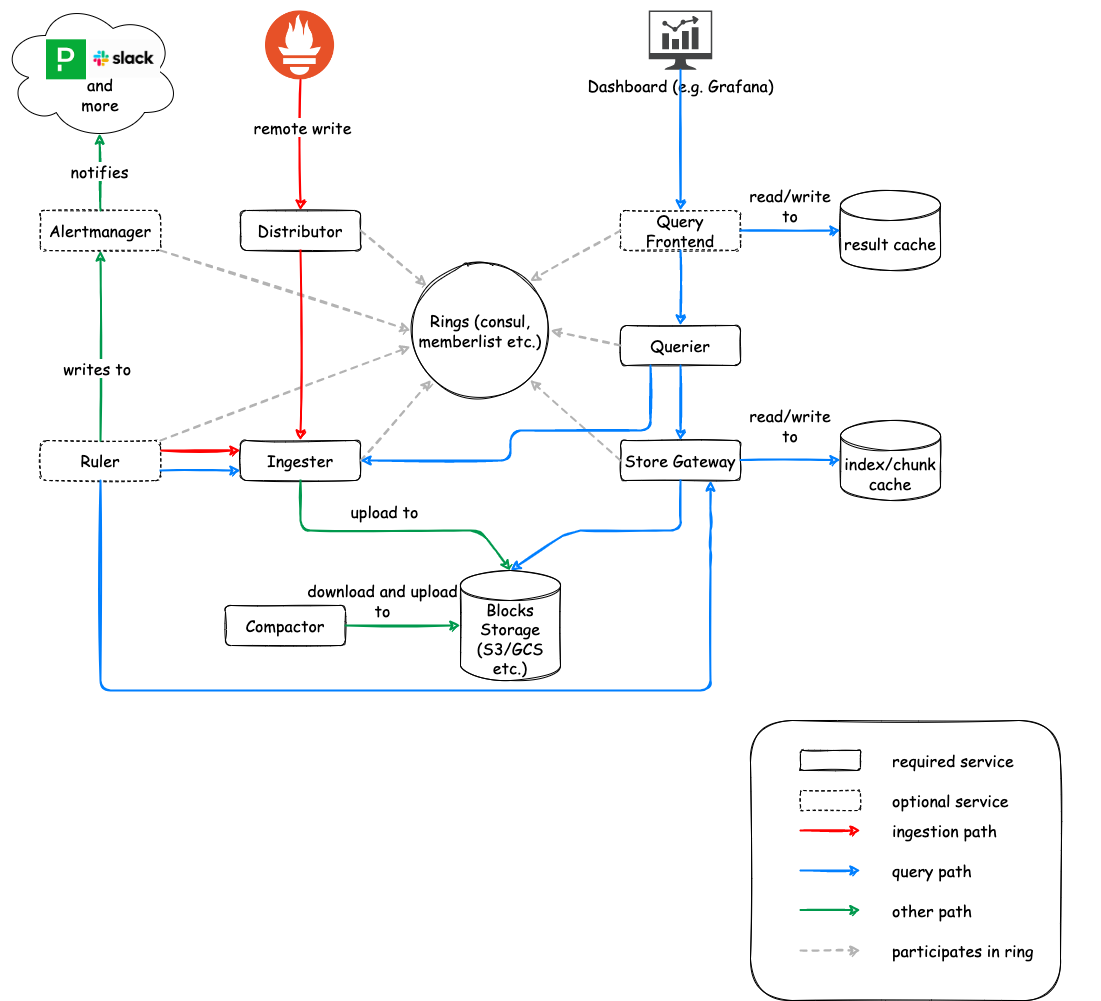
The official Cortex architecture documentation shows how Prometheus instances push metrics into a distributed ingestion layer, which later writes blocks into object storage like S3 or GCS.
The first time you see this architecture, it almost looks excessive.
Instead of “Prometheus + disk,” you suddenly have:
- distributors,
- ingesters,
- queriers,
- query frontends,
- compactors,
- store gateways,
- object storage,
- cache layers,
- rings,
- and tenant isolation.
And yet, all this complexity exists for a reason.
Because Cortex is solving problems Prometheus fundamentally struggles with.
The Most Important Cortex Idea: Object Storage
The biggest conceptual shift in Cortex is that metrics stop living primarily on local disks.
Instead, Cortex stores historical metrics in object storage systems like:
- Amazon S3,
- Google Cloud Storage,
- Azure Blob Storage.
The official Cortex documentation describes its “blocks storage” engine as a Prometheus TSDB-compatible storage layer that writes metrics into per-tenant TSDB blocks stored in object storage.
This changes observability economics dramatically.
Traditional Prometheus retention is expensive because SSD-backed TSDB storage becomes huge over time. Cortex offloads historical data into much cheaper object storage systems.
Conceptually, the flow looks like this:
Prometheus
    |
remote_write
    |
Distributor
    |
Ingester
    |
2h TSDB Blocks
    |
S3 / GCS / Azure
Each tenant generates TSDB blocks, typically every 2 hours. Those blocks contain compressed chunks and indexes.
This sounds brilliant.
And honestly, it is.
Until you start querying massive historical windows.
The Hidden Cost of “Infinite Scale”
One of the biggest misconceptions in infrastructure is the idea that scalability comes for free.
It never does.
Distributed systems simply move complexity somewhere else.
In Cortex, the price of scalability is operational complexity.
The moment your metrics leave local disks and move into object storage, query execution becomes dramatically more complicated.
A historical Cortex query may involve:
- reading indexes,
- fetching remote blocks,
- decompressing chunks,
- merging replicated series,
- querying ingesters for recent data,
- consulting caches,
- and coordinating distributed query execution.
The Cortex distributed query proposal itself shows how queries may be fragmented and executed across multiple queriers in parallel.
That architecture is extremely powerful.
But it also means your monitoring stack is now a distributed platform.
And distributed platforms require:
- tuning,
- caching,
- scaling policies,
- debugging,
- network optimization,
- and operational maturity.
At this point many teams discover something uncomfortable:
Cortex is not merely “harder Prometheus.”
Cortex is an entirely different operational category.
Why Cortex Exists Anyway
After hearing all this complexity, you might wonder:
Why would anyone willingly run Cortex?
Because at very large scale, the alternative becomes worse.
Imagine operating:
- 100 Kubernetes clusters,
- thousands of developers,
- dozens of independent teams,
- and hundreds of millions of active time series.
Now imagine trying to solve:
- tenant isolation,
- global querying,
- long retention,
- and HA ingestion
using standalone Prometheus servers.
Eventually the architecture collapses under operational fragmentation.
This is where Cortex becomes genuinely impressive.
The system was designed around multi-tenancy from the beginning. Every request can contain an X-Scope-OrgID header that identifies the tenant.
That means:
- different organizations,
- teams,
- environments,
- or customers
can coexist inside the same backend while remaining isolated.
For internal observability platforms, this becomes incredibly valuable.
A Real Cortex Example
Imagine a company operating multiple Kubernetes clusters:
prod-us-east
prod-europe
staging
payments
machine-learning
Each cluster runs Prometheus locally.
But instead of keeping all retention locally, Prometheus forwards metrics into Cortex:
remote_write:
  - url: https://cortex.example.com/api/v1/push
    headers:
      X-Scope-OrgID: production
Now every cluster contributes metrics into one centralized backend.
A query like this suddenly becomes global:
sum by (cluster, namespace) (
  rate(container_cpu_usage_seconds_total[5m])
)
And Grafana no longer cares which cluster originally produced the data.
This is one of Cortex’s superpowers.
But Then VictoriaMetrics Appeared
While Cortex was evolving toward a highly distributed architecture, another project approached the same problem from almost the opposite direction.
VictoriaMetrics looked at observability and asked a different question.
Instead of:
“How do we build a distributed Prometheus platform?”
VictoriaMetrics asked:
“How do we store metrics as efficiently and simply as possible?”
That philosophical difference changes everything.
The first thing you notice with VictoriaMetrics is how absurdly simple it feels.
You can literally start it with:
docker run -p 8428:8428 victoriametrics/victoria-metricsThen point Prometheus at it:
remote_write:
  - url: http://victoriametrics:8428/api/v1/write
And you are done.
No rings. No distributors. No query frontends. No store gateways.
Just metrics storage.
That simplicity is not accidental.
VictoriaMetrics deliberately optimizes for:
- operational simplicity,
- storage efficiency,
- compression,
- and performance.
The Architecture Difference Feels Massive
This is roughly how Cortex feels:
Prometheus
   |
Distributor
   |
Ingester
   |
Object Storage
   |
Store Gateway
   |
Querier
   |
Query Frontend
   |
Grafana
Meanwhile VictoriaMetrics often feels closer to:
Prometheus
    |
VictoriaMetrics
    |
Grafana
Even the clustered VictoriaMetrics architecture remains comparatively compact.
That difference matters more than benchmark charts suggest.
Because operational complexity is one of the biggest hidden costs in infrastructure.
Every additional distributed service becomes:
- another scaling problem,
- another networking dependency,
- another source of outages,
- another cache to tune,
- another component engineers must understand.
And this is exactly why many teams end up loving VictoriaMetrics.
Not because it is infinitely more scalable.
But because it is operationally calmer.
The Object Storage Tradeoff Nobody Talks About
One of the most interesting things about Cortex is that its greatest strength is also one of its greatest weaknesses.
Object storage is cheap.
That is true.
But object storage is also slower than local TSDB access.
Much slower.
Once your queries begin traversing historical data, Cortex becomes heavily dependent on:
- caching,
- compaction,
- query splitting,
- and efficient block organization.
This is why Cortex deployments often include aggressive cache layers.
Without them, historical queries can become painful.
The Cortex team itself discusses how blocks storage introduced both scalability advantages and operational tradeoffs around querying and block management.
VictoriaMetrics largely avoids some of this complexity because its architecture is fundamentally narrower.
Again: different systems, different priorities.
So Which One Is Better?
This is actually the wrong question.
The better question is:
“What problem are you truly solving?”
If your goal is building:
- a multi-tenant observability platform,
- a centralized Prometheus-as-a-Service system,
- or a massive distributed metrics backend,
then Cortex starts making enormous sense.
But if your goal is:
- fast queries,
- operational simplicity,
- low infrastructure overhead,
- and efficient metrics storage,
VictoriaMetrics is often the more pragmatic choice.
And honestly, for many organizations, pragmatism wins.
The Most Important Lesson
One of the biggest mistakes engineers make is assuming that “more scalable” automatically means “better.”
In reality:
- scalability adds complexity,
- complexity adds operational cost,
- and operational cost eventually becomes engineering cost.
Cortex is one of the most impressive observability systems ever built. It transforms Prometheus into something capable of operating at astonishing scale.
But it achieves that by embracing distributed systems complexity head-on.
VictoriaMetrics succeeds by aggressively avoiding much of that complexity in the first place.
And that is why both systems continue to exist.
Because they are not truly solving the same problem.
메타데이터
- post_id
- c5a154d2fd39
- slug
- cortex-vs-victoriametrics-why-scalable-prometheus-is-not-always-the-best-prometheus-c5a154d2fd39
- url
- https://medium.com/@msalinas92/cortex-vs-victoriametrics-why-scalable-prometheus-is-not-always-the-best-prometheus-c5a154d2fd39
- canonical_url
- https://medium.com/@msalinas92/cortex-vs-victoriametrics-why-scalable-prometheus-is-not-always-the-best-prometheus-c5a154d2fd39
- author_url
- https://medium.com/@msalinas92
- status
- ok
- fetched_at
- 2026-06-09 14:34:10