AMD Moving Average Strategy: How Traders Identify the Trend
Advanced Micro Devices is one of the most actively traded semiconductor stocks in the US market. Its exposure to artificial intelligence…
AMD Moving Average Strategy: How Traders Identify the Trend
Advanced Micro Devices is one of the most actively traded semiconductor stocks in the US market. Its exposure to artificial intelligence, data centers, high-performance computing, gaming, and personal computers regularly attracts institutional investors, swing traders, and short-term market participants.
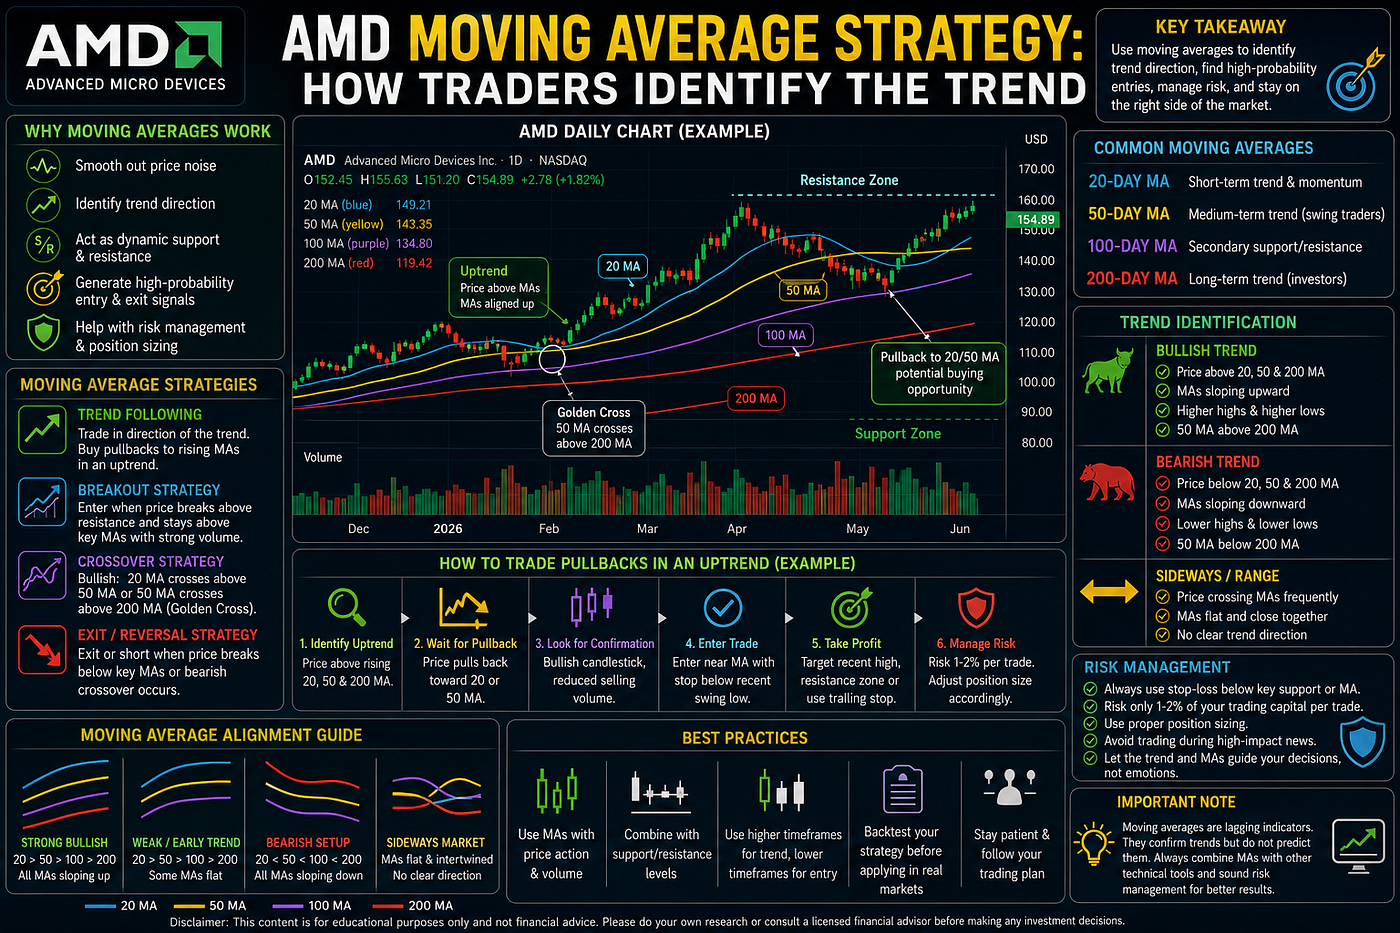
AMD Moving Average Strategy
That attention also creates volatility.
AMD shares can rise or fall sharply after earnings, product launches, major customer announcements, analyst revisions, export-control news, or broad changes in the Nasdaq and semiconductor sector. Traders therefore need a disciplined way to distinguish a genuine trend from temporary market noise.
A moving average strategy can help.
Moving averages smooth AMD’s price data over a selected period. They allow traders to see whether the broader direction is bullish, bearish, or sideways. They can also help identify dynamic support and resistance, potential pullback entries, crossover signals, and areas where a trend may be weakening.
However, a moving average is not a prediction tool. It reacts to price after the move has already begun. Traders should therefore combine moving averages with price structure, support and resistance, momentum, volume confirmation, and risk management.
This guide explains how traders can use the 20-day, 50-day, 100-day, and 200-day moving averages to analyze AMD stock and create a more structured trading plan.
What Is a Moving Average?
A moving average calculates the average closing price of a stock over a specific number of periods.
For example, a 20-day moving average represents AMD’s average closing price over the previous 20 trading sessions. As a new trading day is added, the oldest day is removed, which causes the average to move over time.
The moving average creates a smoother line than the stock’s daily price.
This helps traders identify the underlying direction without reacting to every intraday fluctuation.
When AMD trades above a rising moving average, the trend is generally considered constructive. When it trades below a falling moving average, the trend is generally considered weak.
When price repeatedly crosses above and below a flat moving average, AMD may be trading within a range rather than following a clear trend.
Simple Moving Average vs Exponential Moving Average
The two most commonly used moving averages are the simple moving average and exponential moving average.
Simple Moving Average
A simple moving average, or SMA, gives equal importance to every closing price in the selected period.
A 20-day SMA adds the closing prices from the previous 20 sessions and divides the total by 20.
The SMA is relatively smooth and can be useful for identifying the broader trend.
Exponential Moving Average
An exponential moving average, or EMA, gives greater importance to recent prices.
Because it reacts more quickly to new price action, an EMA may identify short-term trend changes earlier than an SMA.
However, its greater sensitivity can also create more false signals during volatile or sideways markets.
Short-term AMD traders may prefer exponential averages such as the 9-day or 20-day EMA. Swing traders and investors often watch the 50-day and 200-day simple moving averages.
Neither method is automatically better. The best choice depends on the trader’s timeframe and strategy.
Why Moving Averages Work Well for AMD
AMD often develops strong trends because of major changes in investor expectations.
A positive earnings surprise, stronger AI demand, new customer partnerships, or an improving semiconductor cycle can create sustained buying. Likewise, disappointing guidance or broad technology-sector weakness can produce extended declines.
Moving averages can help traders stay aligned with these trends.
They are especially useful for AMD because they can:
- Reduce short-term chart noise
- Show whether momentum is improving or weakening
- Identify potential pullback zones
- Confirm breakouts
- Highlight trend reversals
- Support stop-loss placement
- Prevent emotional entries
However, AMD’s volatility means that price can temporarily move above or below a moving average without creating a genuine trend change.
Traders should seek confirmation before acting.
The 20-Day Moving Average for Short-Term Momentum
The 20-day moving average represents approximately one month of trading activity.
It is useful for identifying AMD’s short-term trend.
When AMD trades above a rising 20-day moving average, buyers generally control short-term momentum. During a strong rally, the stock may repeatedly pull back toward the 20-day average before continuing higher.
A bullish setup may develop when:
- AMD is making higher highs and higher lows.
- The 20-day moving average is rising.
- Price pulls back toward the average.
- Selling volume declines during the pullback.
- A bullish reversal candle appears.
- Volume increases as price moves higher.
The 20-day moving average may then act as dynamic support.
However, traders should not buy automatically whenever AMD touches the line. They should study nearby support levels, market conditions, and volume.
A break below the 20-day average may only indicate a short-term pause. It becomes more important when the stock also breaks a recent swing low or loses the 50-day moving average.
The 50-Day Moving Average for Swing Traders
The 50-day moving average is one of the most closely watched technical indicators in the stock market.
It represents roughly ten weeks of trading and often reflects AMD’s intermediate-term trend.
Institutional investors may monitor the 50-day average because it can reveal whether a stock remains in a healthy uptrend.
When AMD trades above a rising 50-day moving average, the medium-term outlook is generally constructive.
A pullback toward the 50-day average can create a possible swing-trading opportunity when:
- The larger trend remains bullish.
- The stock holds an established support zone.
- The 50-day moving average is still rising.
- Price shows rejection of lower levels.
- The semiconductor sector remains stable.
- Buying volume returns.
A close below the 50-day average does not automatically create a sell signal.
AMD may briefly fall below it during a volatile correction before recovering. Traders should determine whether price is merely testing the level or breaking the broader market structure.
Repeated closes below a declining 50-day average would be more bearish than a one-day intraday violation.
The 100-Day Moving Average as Secondary Support
The 100-day moving average is less widely followed than the 50-day and 200-day averages, but it can be useful during deeper corrections.
When AMD experiences a strong advance, the stock may become extended above the 20-day and 50-day averages. If a more meaningful correction develops, the 100-day average may become the next area where longer-term buyers appear.
This moving average may be useful when:
- AMD has lost the 50-day average.
- The long-term trend remains positive.
- Price approaches a previous breakout area.
- The 100-day average aligns with horizontal support.
- Momentum indicators show improving conditions.
Confluence strengthens a technical level.
For example, the 100-day moving average becomes more important when it overlaps with a previous resistance zone that may now act as support.
Traders should avoid relying on the line by itself. The best opportunities often occur when multiple forms of evidence point toward the same price region.
The 200-Day Moving Average for the Long-Term Trend
The 200-day moving average is one of the most important long-term trend indicators.
It represents approximately 40 weeks of price data.
When AMD trades above a rising 200-day moving average, the broad trend is usually considered bullish. When the stock remains below a falling 200-day average, the long-term structure is generally bearish.
The 200-day average may also act as major support during broad market corrections.
Long-term investors often watch whether AMD can defend this level before adding exposure.
A breakdown below the 200-day moving average becomes more serious when:
- The average is flattening or turning lower.
- AMD breaks major horizontal support.
- Selling volume rises.
- The semiconductor sector is weakening.
- Price fails to recover quickly.
- Earnings expectations are declining.
A brief drop below the 200-day average followed by a strong recovery may become a false breakdown.
This is why traders should wait for confirmation rather than acting on one closing price.
How Traders Identify an AMD Uptrend
A moving average can help confirm an uptrend, but traders should begin with price structure.
An AMD uptrend generally includes:
- Higher highs
- Higher lows
- Rising moving averages
- Price above the 50-day average
- Price above the 200-day average
- Stronger volume during advances
- Lower volume during pullbacks
The strongest bullish structure often appears when the shorter moving averages are positioned above the longer averages.
For example:
- Price above the 20-day average
- 20-day average above the 50-day average
- 50-day average above the 200-day average
- All major averages rising
This arrangement shows that short-, medium-, and long-term momentum are aligned.
Traders sometimes call this bullish moving-average alignment.
Even within a strong uptrend, AMD may experience sharp corrections. The goal is not to avoid every decline. The goal is to determine whether the broader structure remains intact.
How Traders Identify an AMD Downtrend
An AMD downtrend generally contains lower highs and lower lows.
Additional bearish evidence may include:
- Price below the 20-day average
- Price below the 50-day average
- Price below the 200-day average
- Declining moving averages
- Weak rallies that fail near resistance
- Heavy volume during declines
- Lower volume during rebounds
The most bearish alignment occurs when the shorter moving averages remain below the longer moving averages and all are falling.
During a downtrend, the 20-day or 50-day moving average may act as resistance instead of support.
Traders may see AMD rally toward one of these averages, fail to break above it, and then resume its decline.
A trader should not assume that a stock is inexpensive simply because it is below a moving average. Price can remain below a declining average for a long period.
Technical confirmation is necessary before expecting a reversal.
Sideways Markets and Moving Average Whipsaws
Moving averages perform best during trending markets.
They become less reliable when AMD trades sideways.
During a range, price may repeatedly move above and below the same moving average. This creates false signals known as whipsaws.
Warning signs of a sideways market include:
- Flat moving averages
- Frequent price crossovers
- Repeated failures at the same resistance
- Repeated rebounds from the same support
- Declining volume
- Narrowing price ranges
In this environment, traders may focus more on range support and resistance than moving-average crossovers.
Buying near support and reducing exposure near resistance may be more effective than chasing every crossover.
The trader should wait for a confirmed breakout before assuming that a new trend has begun.
The AMD Moving Average Pullback Strategy
A pullback strategy attempts to enter an established trend after a temporary decline.
For a bullish AMD trade, the process may be:
- Confirm that AMD is in an uptrend.
- Identify a rising 20-day or 50-day moving average.
- Wait for price to pull back toward the average.
- Look for nearby horizontal support.
- Confirm that selling volume is declining.
- Wait for a bullish reversal signal.
- Enter only after price confirms renewed strength.
- Place a stop below the technical invalidation level.
A trader should not buy while AMD is still falling aggressively.
Waiting for a reversal candle, recovery above a short-term level, or volume-supported bounce can improve the quality of the setup.
The strategy works because traders enter after a controlled correction rather than chasing an extended rally.
The AMD Breakout and Moving Average Strategy
Moving averages can also help confirm breakouts.
Suppose AMD consolidates below resistance while remaining above a rising 20-day and 50-day moving average.
The moving averages may gradually catch up with price, reducing the distance between the stock and its trend support.
A bullish breakout becomes more credible when:
- AMD closes above resistance.
- Volume expands.
- The 20-day average is rising.
- The 50-day average is rising.
- The stock remains above both averages.
- The semiconductor sector confirms the move.
After the breakout, traders may wait for a retest of the former resistance level.
If that level holds as support and the moving averages remain constructive, the risk-reward may improve.
A breakout far above the moving averages can be more dangerous because price may be overextended.
Moving Average Crossover Strategies
A crossover occurs when one moving average moves above or below another.
Bullish Crossover
A bullish crossover happens when a shorter moving average rises above a longer moving average.
For example, the 20-day average crossing above the 50-day average may indicate improving momentum.
The signal becomes stronger when:
- AMD is breaking resistance.
- Volume is rising.
- The averages are beginning to slope upward.
- Price structure is forming higher highs and higher lows.
Bearish Crossover
A bearish crossover occurs when the shorter moving average falls below the longer average.
For example, the 20-day average crossing below the 50-day average may indicate weakening momentum.
The signal becomes more meaningful when AMD also breaks support and selling volume increases.
Crossovers are delayed signals because they are based on past prices. By the time a crossover occurs, part of the move may already be complete.
Traders should use crossovers as confirmation rather than relying on them as the sole entry signal.
Golden Cross and Death Cross
The golden cross occurs when the 50-day moving average rises above the 200-day moving average.
It is considered a long-term bullish signal.
The death cross occurs when the 50-day moving average falls below the 200-day moving average.
It is considered a long-term bearish signal.
These signals receive substantial financial-media attention. However, they can occur after a large part of the trend has already developed.
A golden cross is more useful when AMD is also breaking major resistance, reporting improving fundamentals, and showing strong volume.
A death cross becomes more serious when the company’s earnings outlook is weakening and the broader semiconductor sector is declining.
Neither crossover guarantees future performance.
Using Volume With AMD Moving Averages
Volume helps determine whether buyers or sellers support a price move.
A moving-average bounce is more convincing when volume increases during the recovery.
A breakdown below the 50-day moving average becomes more serious when accompanied by heavy selling volume.
Useful volume patterns include:
- Strong volume during bullish breakouts
- Rising volume during recoveries from support
- Lower volume during controlled pullbacks
- Heavy volume during technical breakdowns
- Weak volume during failed rallies
Volume should validate the signal.
A crossover without volume support may have limited reliability. A breakout supported by strong volume suggests that larger market participants may be involved.
Combining RSI With Moving Averages
The Relative Strength Index measures momentum on a scale from zero to 100.
Traders often view readings above 70 as overbought and readings below 30 as oversold.
However, AMD can remain overbought during a powerful uptrend.
A useful bullish setup may occur when:
- AMD remains above a rising 50-day average.
- RSI cools from an overbought reading.
- Price holds support.
- RSI begins turning higher.
- Volume confirms the rebound.
A bearish warning may appear when AMD makes a higher price high while RSI forms a lower high.
This negative divergence can suggest weakening momentum, especially near resistance.
RSI should support the moving-average analysis rather than replace it.
Combining MACD With Moving Averages
MACD helps traders evaluate momentum and trend changes.
A bullish MACD crossover near a rising 50-day moving average may support a pullback entry.
A bearish crossover after AMD breaks below the 20-day or 50-day average may confirm weakening momentum.
MACD can also generate false signals in sideways markets.
Traders should check whether price is breaking an important technical level before acting.
Stop-Loss Placement in a Moving Average Strategy
A stop-loss should be placed where the trade setup becomes invalid.
Traders should avoid placing the stop directly on a moving average because AMD may briefly move through the line before reversing.
A better stop may be positioned:
- Below the recent swing low
- Below horizontal support
- Below the moving average with a volatility buffer
- Beyond an Average True Range threshold
- Below the breakout level
Suppose AMD pulls back toward the 50-day average and forms a swing low at $150. A trader enters at $156 after a bullish reversal.
The stop might be placed below the swing low at $148.50 rather than exactly at the moving average.
The risk per share would be $7.50.
Position size should then be calculated using the maximum amount the trader is willing to lose.
Position Sizing for AMD Trades
AMD’s volatility makes position sizing essential.
The basic formula is:
Position Size = Maximum Dollar Risk ÷ Risk Per Share
Suppose:
- Account size: $40,000
- Maximum risk: 1%
- Dollar risk: $400
- AMD entry: $156
- Stop-loss: $148
- Risk per share: $8
The position size would be:
$400 ÷ $8 = 50 shares
The trader could buy 50 shares while keeping the planned risk near $400.
If the stop must be wider because AMD is highly volatile, the position size should be reduced.
A wider stop does not need to create a larger dollar loss.
Moving Averages Around AMD Earnings
Earnings can make moving-average signals less reliable.
AMD may gap well above or below a moving average after releasing results or guidance.
A stop-loss may also execute at a worse price than expected if the stock gaps through the stop.
Traders holding AMD through earnings should consider:
- Reducing position size
- Taking partial profit
- Avoiding excessive leverage
- Reviewing options-market expectations
- Accepting the possibility of slippage
- Waiting until after earnings for a new setup
A moving average can help analyze the trend before earnings, but it cannot protect a position from overnight gap risk.
Broader Market Confirmation
AMD does not trade in isolation.
Its trend can be influenced by:
- Nasdaq direction
- Semiconductor index performance
- Nvidia and other chip stocks
- Interest rates
- Artificial intelligence spending
- Federal Reserve expectations
- Export restrictions
- Broad risk sentiment
A bullish AMD moving-average signal is stronger when the Nasdaq and semiconductor sector are also trending higher.
If AMD appears strong while the entire sector is weakening, the trade may face greater risk.
Relative strength is important.
Traders should compare AMD’s performance with the semiconductor index and major competitors. A stock outperforming its sector may attract greater institutional interest.
Financial Astrology as a Timing Layer
Traders who study financial astrology may use planetary cycles to identify periods when AMD volatility could increase.
Mercury and Uranus may be associated with technology, information, innovation, and sudden changes. Mars may correspond with aggressive momentum, while Jupiter and Saturn may reflect expansion and expectations resets.
These timing windows should never replace the moving-average signal.
For example, a planetary volatility window may become more relevant when AMD is testing the 50-day average, compressing below resistance, or approaching a major breakout.
The trader should still wait for price and volume confirmation.
The Financial Astrology Terminal combines technical charts, market data, watchlists, global stocks, indices, commodities, and planetary timing insights.
The practical hierarchy remains:
Financial astrology prepares, technical analysis confirms, volume validates, and risk management protects.
Common AMD Moving Average Mistakes
Buying Every Touch of the Moving Average
A moving average does not guarantee support. Traders should wait for confirmation.
Ignoring the Slope
A rising average is more constructive than a flat or falling one.
Using Crossovers in Sideways Markets
Flat markets can produce repeated false signals.
Ignoring Volume
A breakdown with heavy volume is more important than a low-volume move below the average.
Using the Same Moving Average for Every Timeframe
A day trader and long-term investor should not depend on identical settings.
Placing Stops Too Close
AMD’s normal volatility can trigger tight stops.
Increasing Position Size Because of Confidence
Position size should depend on account risk and stop distance.
Ignoring the Semiconductor Sector
Broad sector weakness can overwhelm an individual AMD setup.
An AMD Moving Average Trading Checklist
Before entering a trade, ask:
- Is AMD trending or moving sideways?
- Is price above or below the 50-day average?
- Is the 50-day average rising or falling?
- Is AMD above the 200-day average?
- Are price highs and lows confirming the trend?
- Is there nearby support or resistance?
- Is volume confirming the move?
- What are RSI and MACD showing?
- Is the Nasdaq trend supportive?
- Is the semiconductor sector confirming?
- Are earnings approaching?
- Where is the stop-loss?
- What is the risk per share?
- How many shares can be traded?
- Is the risk-reward ratio acceptable?
A moving-average strategy becomes more reliable when these questions produce a consistent answer.
Conclusion
Moving averages provide a practical framework for analyzing AMD’s trend.
The 20-day moving average helps traders monitor short-term momentum. The 50-day average is useful for swing trading and intermediate trend analysis. The 100-day average may provide secondary support during deeper corrections, while the 200-day moving average helps define the long-term structure.
AMD is generally in a constructive trend when price remains above rising moving averages and continues forming higher highs and higher lows.
A bearish structure becomes more likely when price remains below declining averages, rallies fail near resistance, and selling volume increases.
Traders can use moving averages to identify pullbacks, breakouts, crossovers, dynamic support, and possible trend reversals. However, the lines should never be used alone.
Support and resistance show where market participants may act. Volume confirms whether buyers or sellers are committed. RSI and MACD provide momentum context. Stop-loss placement and position sizing determine whether a failed setup remains manageable.
AMD’s high volatility makes discipline especially important.
A trader should never buy solely because price touches a moving average. The better approach is to wait for a technically meaningful level, observe price reaction, confirm the move with volume, and calculate risk before entering.
Planetary cycles may provide an additional timing perspective for those who follow financial astrology, but the chart must confirm every trade.
Financial astrology prepares, technical analysis confirms, volume validates, and risk management protects.
For a broader analysis of AMD’s AI growth story, share-price momentum, technical structure, and financial astrology outlook, read AMD Share Price: Why the Stock Is Back in Focus Through a Financial Astrology Terminal Lens.
메타데이터
- post_id
- c5b68f31cab1
- slug
- amd-moving-average-strategy-how-traders-identify-the-trend-c5b68f31cab1
- url
- https://medium.com/@astroaitech_56855/amd-moving-average-strategy-how-traders-identify-the-trend-c5b68f31cab1
- canonical_url
- https://medium.com/@astroaitech_56855/amd-moving-average-strategy-how-traders-identify-the-trend-c5b68f31cab1
- author_url
- https://medium.com/@astroaitech_56855
- status
- ok
- fetched_at
- 2026-06-23 03:48:11