When One Bridge Closes, The City Does Too.
Using graph centrality algorithms to map transit vulnerabilities in a Cincinnati school district — and find the bridges nobody is watching.
When One Bridge Closes, The City Does Too.
Using graph centrality algorithms to map transit vulnerabilities in a Cincinnati school district — and find the bridges nobody is watching.
Why I thought of This Problem
[embed]The possible paths from my home to Sycamore Junior High — with only one not reliant on the Cooper Road 1–71 Bridge
It started out like any other morning. I was driving to school, taking my normal pathway.
However, there was a key difference that morning. A few minutes short of arriving at Sycamore Junior High, we discovered that the Cooper Road bridge over Interstate 71 was closed.
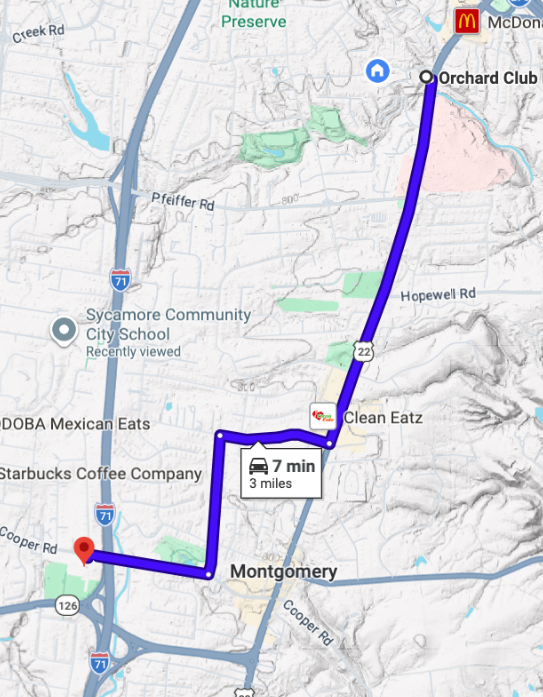
Immediately, we thought to go to our second preferred route. However, that too we quickly realized was routed through the same bridge, and therefore was also inaccessible.

This left us with only one more option; we had to take the long way through the busy Pfeiffer Road, then navigate a long path along the narrow one lane Kenwood Road, and ultimately take a left on the Cooper Road North in order to reach school.

This continued for the majority of the year, almost doubling the commute time of me and many others living in the City of Montgomery and Symmes Township region every day while people living on the Blue Ash or Kenwood side were hardly impacted. Furthermore, the impacted families faced immediate route disruptions with no prior analysis of alternates and no published detour cost estimates. Parents discovered empirically, through daily experience, that the Pfeiffer Road to Kenwood Road detour increased commute time by 29 to 49 percent, depending on their prior route.
This experience raised a question that neither the district nor the City of Montgomery could readily answer: which pieces of infrastructure, if they failed, would strand which neighborhoods, and by how much?
That question is precisely what graph theory is designed to answer.
The Approach
The framing was clear from the start: model the transit network as a graph, then apply centrality algorithms to identify critical intersections or vulnerable points of failures.
Node types
I separated the network into the following four node types to account for structural differences:
- Neighborhoods (the origin points where students board).
- Intersections (decision points where routes converge or diverge).
- Bridges (structurally constrained crossings that can be closed independently of the roads around them).
- School (the universal destination).
Roads themselves became edges — relationships between nodes, labeled with the route they carry.
Why Neo4j
I chose Neo4j as the graph database because it speaks Cypher natively — a query language designed for traversing connected data in the form of a graph. Questions like “find all neighborhoods that can only reach SJH through this one bridge” become single queries.
Three algorithms, three lenses
No single metric tells the whole story, so I ran three:
Betweenness Centrality (BC) identifies nodes on the most shortest paths between all pairs. High BC indicates a routing chokepoint. Remove it and many routes must detour — or have no path at all.
PageRank (PR) measures how much flow a node receives from other important nodes. High PR indicates convergence point. Nodes with a high page rank reveal where is the traffic flow the most congested, and suggests where more lanes can be added to reduce backlog.
Eigenvector Centrality (EV) measures how well-connected a node is to other well-connected nodes. High EV indicates structural embeddedness. It reveals where the cascading effect is present — in what locations there is the greatest effect when one of its neighbors fails.
How the Data was Collected
Data collection happened in three phases, each uncovering gaps in the previous one.
Phase 1 — The source spreadsheet
The starting point was a manually constructed 630-row spreadsheet containing step-by-step routing by driving around the 55 known SJH bus routes. This gave me 114 neighborhoods, 54 intersections, 12 bridges, and 1 school as the initial node inventory.
Phase 2 — Using District Map Data to Refine the Manual Data
The Sycamore CSD transportation page links to an ArcGIS attendance zone map — a JavaScript app rendering color-coded school zones.
I took 13 enhanced tile crops at 4× zoom, covering every part of the district interior, and extracted 39 road labels absent from the original spreadsheet. Each was cross-referenced against the Hamilton County Auditor’s official street listing.
Phase 3 — Bridge verification
Bridge data came from ODOT inspection notices, Hamilton County Engineer records, and WKRC news reports.
The Graph Data Model
The schema is simple and intentional:
// Node labels
(:Neighborhood) // 134 — origin points
(:Intersection) // 74 — decision points
(:Bridge) // 12 — structural crossings
(:School) // 1 — SJH (universal sink)

// All edges are directed toward SJH
(:Neighborhood)-[:ROAD_SEGMENT]->(:Bridge)
(:Intersection) -[:ROAD_SEGMENT]->(:Bridge)
(:Bridge) -[:ROAD_SEGMENT]->(:Intersection)
(:Intersection) -[:ROAD_SEGMENT]->(:School)

// Sample ROAD_SEGMENT Edge properties
{road: 'Kenwood Road', routeId: 'RD_KENWOOD',
seq: 2, zip: '45242', altRoute: false}
Every ROAD_SEGMENT edge carries five properties: the road name, the route ID, the sequence position within that route, the ZIP code of the segment, and an altRoute boolean that marks the 38 bypass edges.
MATCH ()-[r:ROAD_SEGMENT]->() WHERE r.altRoute = true
RETURN count(DISTINCT r.routeId) AS primary_routes;
A simulation was run to determine what is the true impact of closing the Cooper Road bridge. Around 25 routes were determined to have been impacted and the alternate route was through Montgomery -> Pfeiffer -> Kenwood route.
Betweenness Centrality — Finding the Chokepoints
Betweenness Centrality (normalized to max = 1.0) identifies nodes that appear on the most shortest paths between any pair of nodes in the graph. A high-BC node is one that routing must pass through — remove it and routes either take longer paths or lose connectivity entirely.

The dominance of the Montgomery Road corridor is striking. Four of the top five BC nodes are either on Montgomery Road or feed directly into it. This reflects the geographic reality that Montgomery Road is the primary connector of the entire NE quadrant of the district to the Cooper Road spine.
BRG_MONTGOMERY_CREEK with a perfect BC score of 1.000 is the single most critical node in the network. Thirty routes pass through it with zero bypass coverage. It sits on Montgomery Road where it crosses Muddy Creek — and there is no verified alternate crossing in the district data.
Key Finding — BC
The Fields Ertel Creek Crossing (BC = 0.699) is the third-highest-scoring bridge and has no confirmed alternate. The corridor north of I-275 — Hosbrook Road, Governors Hill Drive, Gregory Lane, Harbortown Drive, Carrington — has zero bypass coverage for any of its 10 routes.
PageRank — Mapping the Flow Pressure
PageRank measures which nodes receive the most flow from other important nodes. A high-PR node doesn’t just sit on many paths — it sits downstream of other high-PR nodes, absorbing compounded load pressure from the entire upstream network. All edges are directed toward SJH, so PR scores reflect the cumulative weight of traffic converging on each node.

INT_COOPER_DELRAY scoring PR = 1.000 confirms it as the universal sink — every unit of flow in the network ultimately passes through the SJH main entrance intersection. The more operationally significant finding is the PR ranking of the bridges. BRG_COOPER_I71 at PR = 0.491 has the highest PageRank of any bridge — higher even than BRG_MONTGOMERY_CREEK (PR = 0.468).
This reveals something BC alone misses: the Cooper Road bridge is not just on many paths, it receives concentrated flow from important upstream nodes. It is the final checkpoint on the highest-traffic corridor in the network, immediately upstream of the universal sink. The compression of the three major bridges between PR = 0.46 and 0.49 tells us the network’s flow is well-balanced across corridors under normal conditions — but any one of them lost sends the other two into overload.
Eigenvector Centrality — The Hidden Hubs
Eigenvector Centrality measures structural embeddedness: how well-connected a node is to other well-connected nodes. A node with high EV might carry few routes directly — but it sits at the center of a dense cluster, and its failure propagates through the cluster in ways that neither BC nor PR fully captures.

Eigenvector Centrality — Top 15 Nodes
Evidently, Cooper Delray and SJH will have high EV because they are connected to a large number of significantly important neighboring intersections — otherwise how would people get to school?
After that, the EV results are dominated by a single structural phenomenon: the Kenwood Road star topology. Along Kenwood Road’s north-south run through Blue Ash, 13+ residential streets branch off as independent bus route entry points. Every one funnels through one or two Kenwood Road intersections before reaching BRG_KENWOOD_CREEK heading south toward Cooper Road.
The operational implication of high EV differs from high BC. A high-EV closure doesn’t just cut paths — it isolates an entire neighborhood cluster that was routing through a shared hub.
The next significant cluster runs around the Cooper Road spine, from the Cooper-Reed Hartman intersection, through the I-71 bridge, to the Cooper-Montgomery intersection.
The Bridge Vulnerability Matrix
With all three metrics computed, the clearest synthesis is a per-bridge view — each of the 12 bridges scored, tiered, and assessed for bypass coverage. The composite score weights BC at 40%, PR at 35%, and EV at 25%.

Same network, Different points of view.

Combined Recommendations
The three metrics agree more than they disagree — which is itself informative. It means the network has genuine structural concentrations, not algorithm artifacts. The following five recommendations are ranked by composite score.
1. Harden the Cooper Rd & Delray Dr terminus
Composite 0.624 · PR 1.000 · BC 0.647 · EV 1.0
With all bus routes arriving at a single intersection, any incident at this node disrupts every arrival simultaneously. Dedicated bus-only approach lane, staggered arrival windows by route cluster, and a secondary drop-off loop to absorb overflow.
2. Inspect and plan a bypass for BRG_MONTGOMERY_CREEK
Composite 0.572 · BC 1.000 · PR 0.469 · EV 0.033
This is the clearest finding in the dataset. It ranks first on BC, fourth on PR, and affects 30 routes with zero bypass coverage. Every route from the NE quadrant — Mason-Montgomery, Deerfield, Seven Gables, Indianwoods, Mitchell Farm, and the new audit routes Gregory Lane, Harbortown Drive, Carrington, Calumet, Legacy — must cross this bridge. The Patch 1 bypass does not address Montgomery Creek; it only reroutes traffic around Cooper/I-71. A direct alternate creek crossing needs physical survey.
3. “The Bridge” BRG_COOPER_I71
Composite 0.494· BC 0.615 · PR 0.491· EV 0.307
The anecdotal importance of the bridge which prompted this investigation has been substantiated by the statistical analysis.
This bridge is still a vulnerable point and requires regular inspection.
4. Publish the ODOT Kenwood detour as a standing district protocol
Composite 0.468 · BC 0.569· PR 0.461· EV 0.314
The most structurally embedded node in the network along the narrow Kenwood Road through a densely populated neighborhood getting traffic from Reed Hartman Road and any bypass through the Pfeiffer. This road needs efficient traffic management.
5. Commission a bypass study for BRG_FIELDS_ERTEL_CREEK
Composite 0.354 · BC 0.699 · PR 0.215 · EV 0.0
Top three BC bridge, no confirmed alternate. The northern corridor — Hosbrook Road, Governors Hill Drive, Gregory Lane, Harbortown Drive, Carrington — is a terminal branch with no fallback structure. EV = 0.000 confirms it is not embedded in a resilient cluster: if it closes, those routes have no natural detour through neighboring nodes.
Where This Goes From Here
This project answered its founding question — which nodes cause the most damage when removed? — but in doing so surfaced several questions requiring operational action or further analysis.
Data gaps to close
There are several smaller roads still missing: new roads or neighborhoods like Orchard Trail are not accounted for. We need to also account for several other neighborhoods.
Algorithmic extensions
The current analysis uses unweighted edges. Adding travel time weights from Google Maps Distance Matrix API, and bridge weight limits from ODOT’s inspection database, would produce operationally precise results. A temporal simulation over school-year peak windows (7:45–8:15 AM) would reveal congestion bottlenecks that static centrality metrics miss entirely.
A living network model
Bus routes shift with enrollment, construction, and development. The Neo4j schema is designed to accommodate this: a new neighborhood is one MERGE statement, a new route is a handful of ROAD_SEGMENT edges. A living model allows the district to run centrality recalculation whenever a major road project is announced — before the closure happens, not after.
Commuting to school is treated as a logistics problem. Logistics thinking optimizes for normal operations. Network resilience thinking asks what happens when normal operations are disrupted. For a district where 30 neighborhoods have no bypass plan for their primary bridge, the difference between those two frames isn’t academic. It’s whether people can reach the school on a Tuesday morning in October when the road crew puts up barriers.
메타데이터
- post_id
- c5fa24c09894
- slug
- when-one-bridge-closes-the-city-does-too-c5fa24c09894
- url
- https://medium.datadriveninvestor.com/when-one-bridge-closes-the-city-does-too-c5fa24c09894
- canonical_url
- https://medium.datadriveninvestor.com/when-one-bridge-closes-the-city-does-too-c5fa24c09894
- author_url
- https://medium.com/@palshanaya09
- status
- ok
- fetched_at
- 2026-06-26 06:47:43