How to roll-out a data conversational agent?
A complete set up example with Dot
How to roll-out a data conversational agent?
A complete set up example with Dot

If you’re reading this, you likely share our interest in maximizing data accessibility — a challenge I faced myself a few months ago. As an analytics engineer at Gorgias, our team began exploring more effective self-service strategies for our data. During our search, several options emerged quickly, and we couldn’t overlook the potential of conversational agents as a promising solution worth investigating.
We first started by building a POC, an open-source LLM that would do some text2SQL, run the query and output the result in Slack. The LLM would have access to our BigQuery which had table and column definitions defined in our dbt project.
Our initial results were promising, but we weren’t yet confident enough to deploy the tool in production for our colleagues. Several key features were missing: we needed a simple way to update metadata about our data models, clearly define how different models related to each other, and track result quality over time to ensure new additions didn’t harm existing functionality. These gaps led us to look for a ready-made solution that could provide both a user interface and handle the connection between our LLM, our database, and our business concepts.
We chose Dot because it offered all the essential features we needed to move forward. Like many new tools, Dot’s interface was highly flexible but lacked clear guidance on how to configure it effectively. In this article, I’ll share what I’ve learned about implementing a production-ready data conversational agent using Dot. Most of these insights apply to any data conversational agent setup, not just Dot.
Where does Dot fits in your organisation?
Dot’s scope
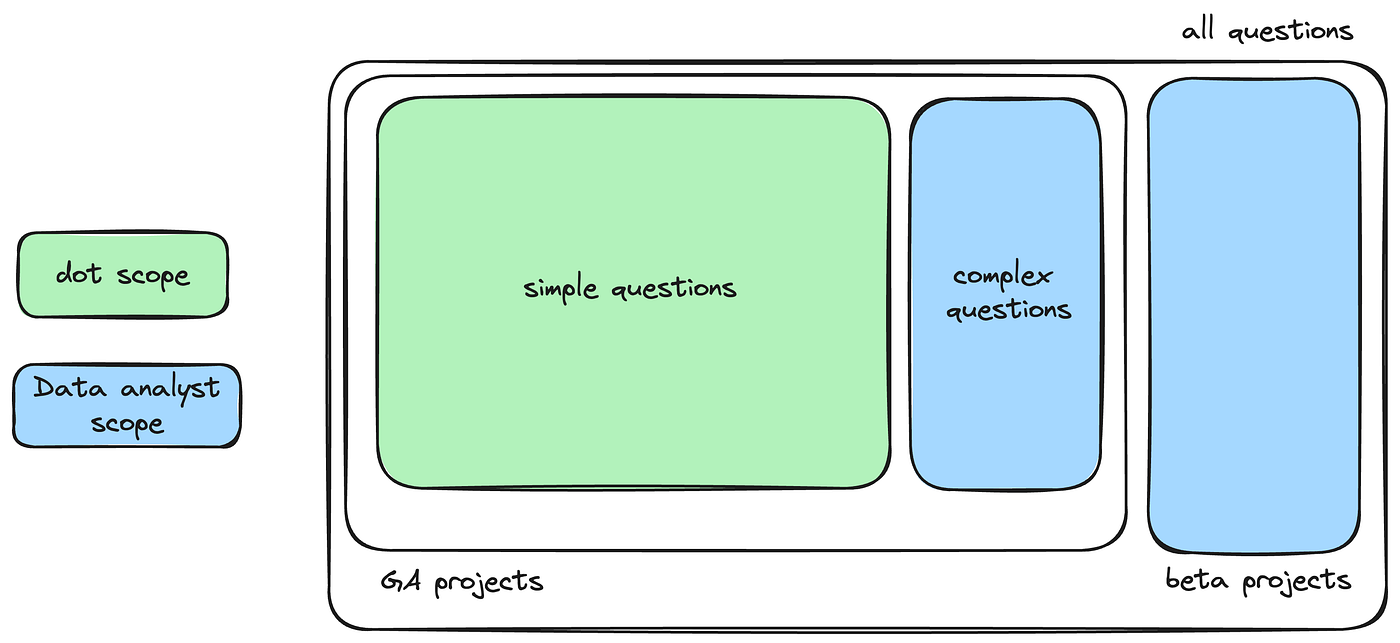
Our initial challenge was addressing the high volume of small requests that constantly interrupted our data analysts. These frequent questions often had answers already available in existing dashboards, but required analysts to write quick queries to retrieve specific information. By automating responses to these routine inquiries, we aimed to free up significant time for our analysts to focus on high-impact business analysis instead.
Dot’s initial purpose was to handle these relatively simple requests, focusing specifically on stable data topics. We deliberately limited its scope to exclude beta features, as rapidly changing data wouldn’t justify the setup effort if the information would be outdated within a week.
Dot set-up ownership
To answer these questions, Dot needs specific information like metric definitions, appropriate models, and relationship data. This information comes from both data analysts and analytics engineers, and it’s crucial to establish how these roles should collaborate for efficient setup.
Data analysts define the metrics Dot should address, provide clear definitions, and identify key stakeholders who frequently request information on specific topics. Meanwhile, analytics engineers connect the necessary models to calculate these metrics, implement the metrics themselves, enhance prompts and definitions to improve the agent’s understanding, and monitor its performance. (We will see later in this article the end-to-end collaboration).
Setting up Dot on a new topic involves continuous collaboration between analytics engineers and data analysts until the results meet expectations. The data analyst has final approval on release timing, determining when Dot performs well enough on their topic for general availability. Giving this authority to data analysts allows them to maintain control over the tool and actively participate in its development, rather than having an unfamiliar system released for their area without them understanding of Dot’s capabilities and limitations.
The data analyst’s involvement is crucial for the success of this implementation!
Dot features
What are the updatable parts of Dot
Main prompt (called Note in the UI):
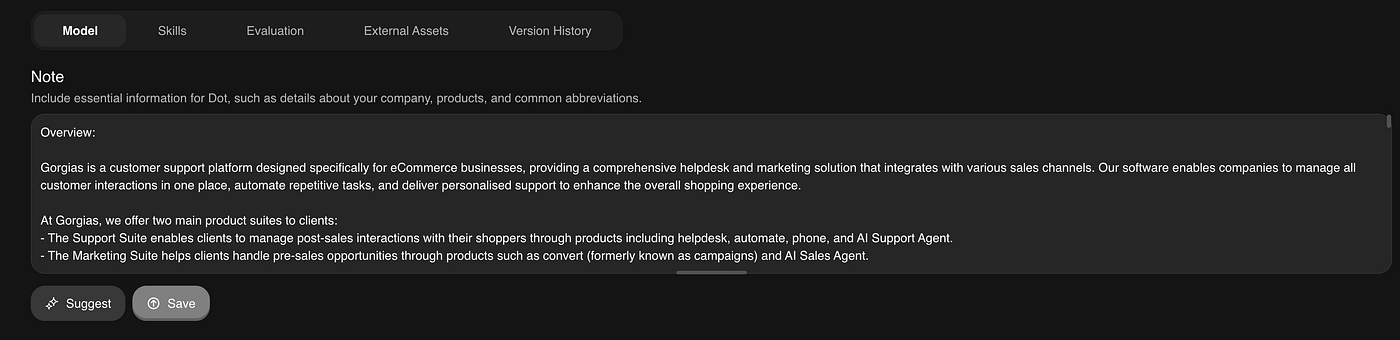
This part helps the model understand the high-level definitions of our products and their relationship to our data models. This will avoid having the LLM try to pic a table completely outside of the scope of the topic the user asked about. One example is giving some information on each of our products, like the different names the products had in the past, the high-level definition of their purpose, and the list of main tables to use if someone asked a question about it.
Keeping a systemic structure and a clear hierarchy of information in this section will allows Dot to hallucinate less. In our case we chose to organise that main prompt such as:
- A clear company profile outlining our business domain and industry context (this helps the LLM better understand specific terminology and jargon colleagues will use in their questions).
- A concise overview of what topics Dot can and cannot address (this helps Dot recognise when a user asks about an uncovered topic, allowing it to clearly indicate unavailability rather than attempting to provide potentially incorrect answers based on loosely related information).
- A comprehensive list of key information about our data objects, including: how our historical models behave, essential models that could serve any topic, and specific filters that should always be applied to certain data. This encompasses any data-related knowledge that would be relevant regardless of the question topic.
- At this stage you will start diving into each topic you want to roll-out. Following the hierarchy you defined in your scopes you can split the text using special characters for clarity.
- For each sub-topic, include three essential elements: its current name along with any previous names, a comprehensive description (to help the model determine if a question relates to this sub-topic), and a list of specific models the LLM should reference when handling questions related to this area.
To split information between different topics: ====================
Within those topics split into sub-topic: ***
Within each sub-topic split it in sub sub topic: — — — — — — — — — — — —
A concrete example of structure for Campaigns, in this case we would consider the main topic to be “Product Analytics”, the sub topic being a specific product, in this case “Marketing Suite” and finally the sub sub topic would be one of the feature of that product, in that case “Campaigns”:
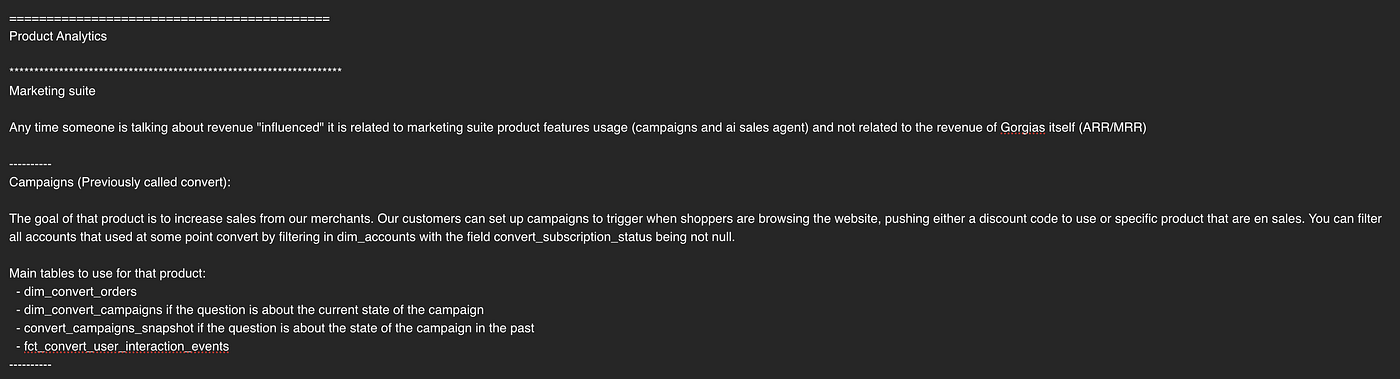
Main prompt example of a sub sub topic definition
Best Practice: Before creating the main prompt for Dot, define a clear categorisation of the topics you want to cover. This approach ensures you begin with a systematic framework for organising each topic and its internal structure. Regardless of which organisational strategy you choose, strive to maintain consistency throughout your documentation.
Model definition:
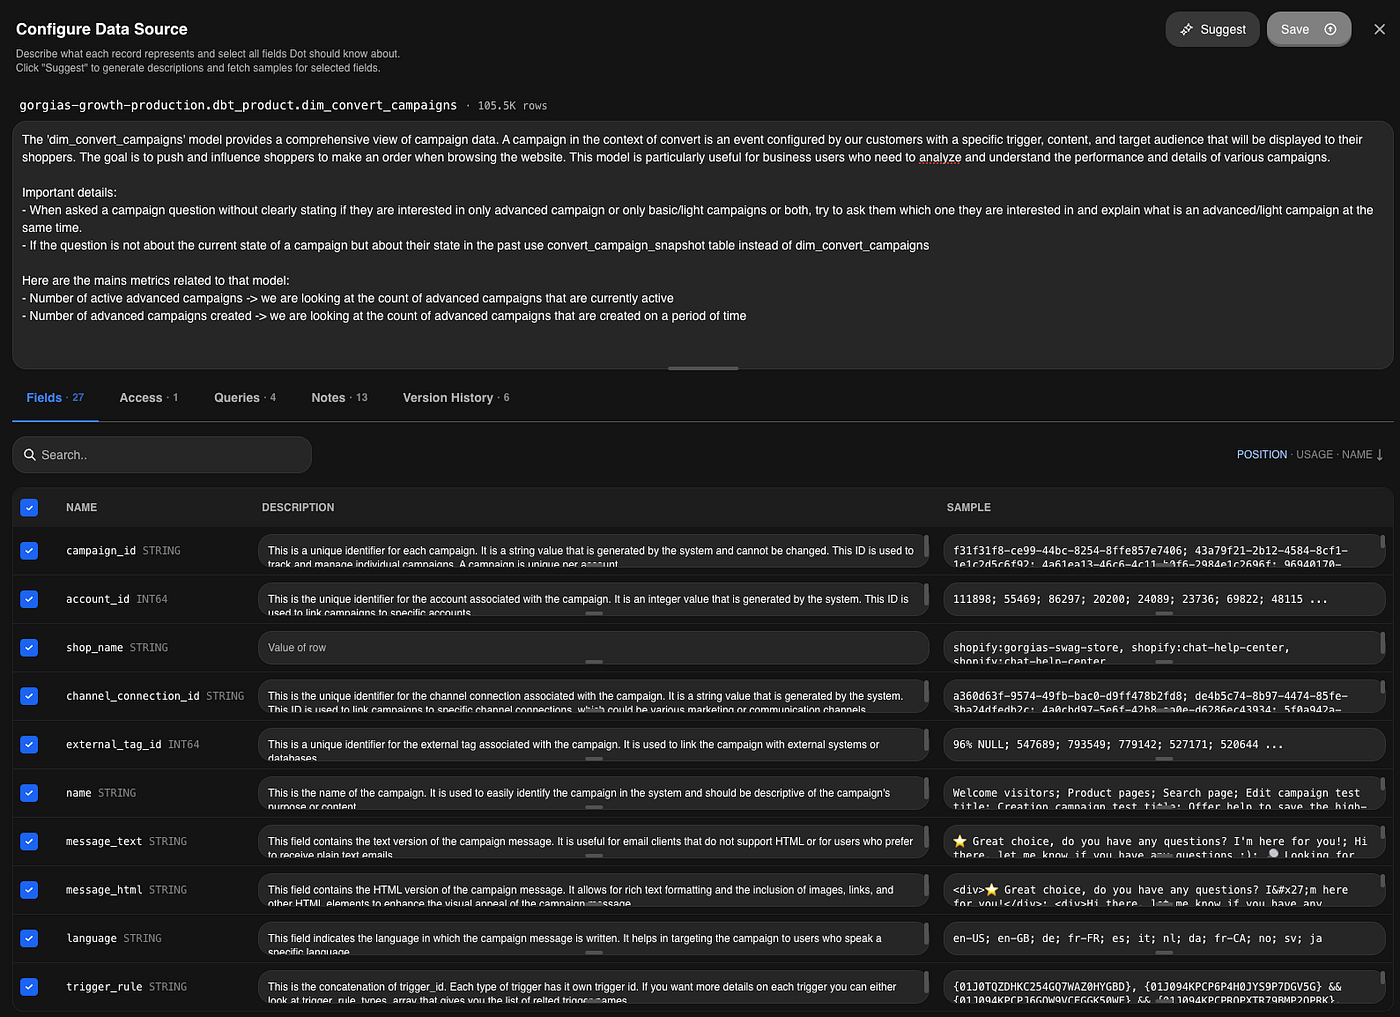
Once you’ve defined the main prompt, the model now better understands the topic we’re targeting. It knows which tables Dot should reference for additional information and which to use as a base for query creation.
A lot of information will be defined at the model level as it will be the main source of information of the LLM context. At the model level you will define:
- The model definition
- Column definition
- Example queries
If you use dbt, you can define model and column definitions within your dbt repository and propagate those definitions in your data warehouse (in our case BigQuery). Dot, when syncing all tables from your project, will capture those definitions by default. Keeping dbt as the source of truth as much as possible is key — you want to define your semantic definitions only in one place.
When structuring your descriptions for Dot, follow specific guidelines to help it better understand and answer questions about your model. While Dot can extrapolate beyond your basic definitions, we’ve found a helpful technique to reduce hallucinations when generating queries: define a limited set of core metrics to “ground” the LLM. This approach provides Dot with foundational metric definitions it can reliably reuse when handling more complex tasks.
For that purpose you will need to structure your model description with 4 sections such as:
- General definition of the model: Include the granularity and a comprehensive explanation of the object/event the model represents. Be detailed and thorough — the more verbose your description, the better the LLM will be able to match user questions to this model.
- General querying information: Include essential details for effectively using this model, such as recommended filters, how to identify test accounts and common pitfalls to avoid. Document the same guidance you would provide to a new data analyst when they first begin working with this table.
- Metric definitions: Provide a comprehensive list of your key metrics, including both their commonly used names and clear, high-level definitions of how each is computed. For each metric, explain the business context, calculation methodology, and any important considerations for interpretation.
- Metric limitations: Document all known constraints, edge cases, and limitations associated with your metrics. Include information about data coverage periods, exclusions, potential biases, reliability concerns, and special circumstances where metrics may produce misleading results.
Best Practice: Keep your descriptions as close as possible to the code, keep it in you dbt ymf files and follow a systematic structure. That way any LLM will be able to parse it the same way every time.
Example queries
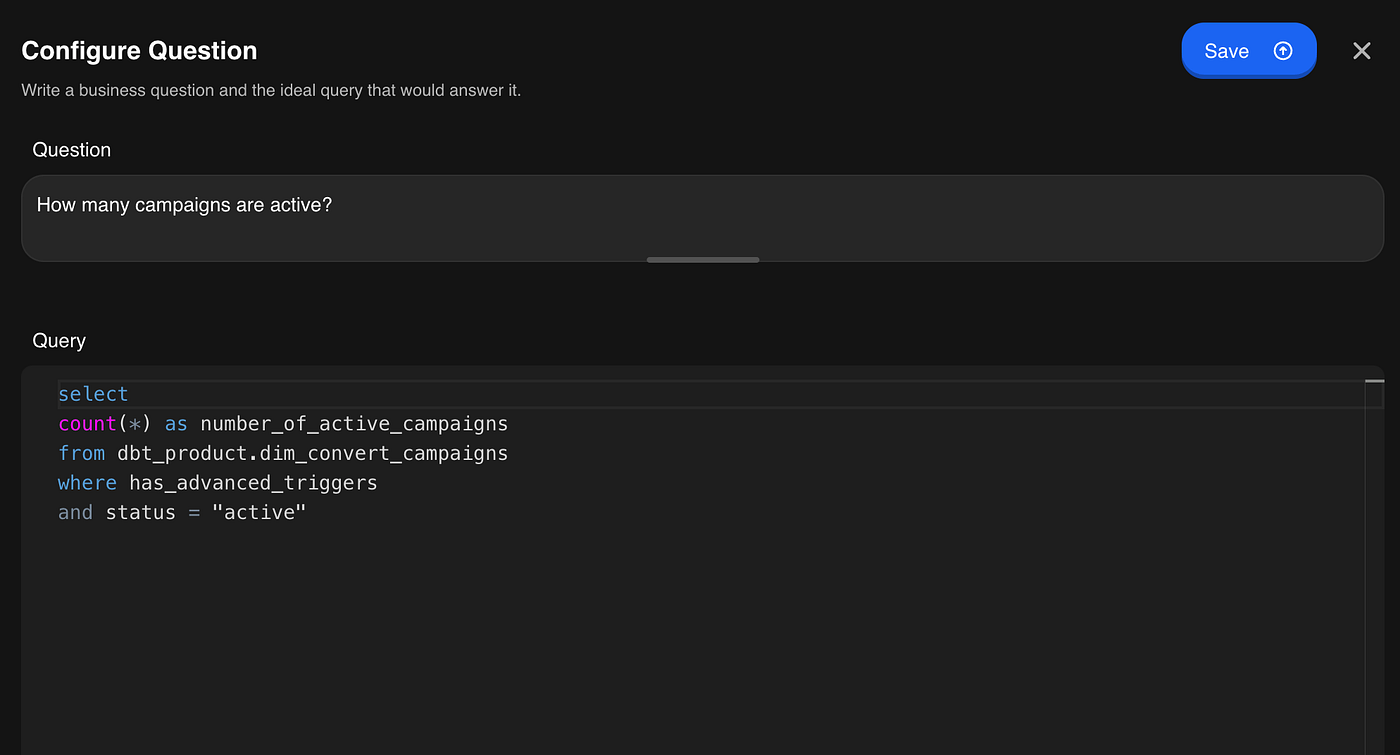
One powerful feature of Dot is the ability to link example queries directly to your model. A highly effective practice is to provide at least one example query for each metric defined in your model description. This approach enables Dot to use these foundational examples as building blocks when constructing more complex queries.
Take full advantage of this capability by creating a comprehensive library of example queries for all of your metrics.
Best Practice: Create simple queries for each metric. Dot will then use those examples to construct more complex ones.
Evaluations
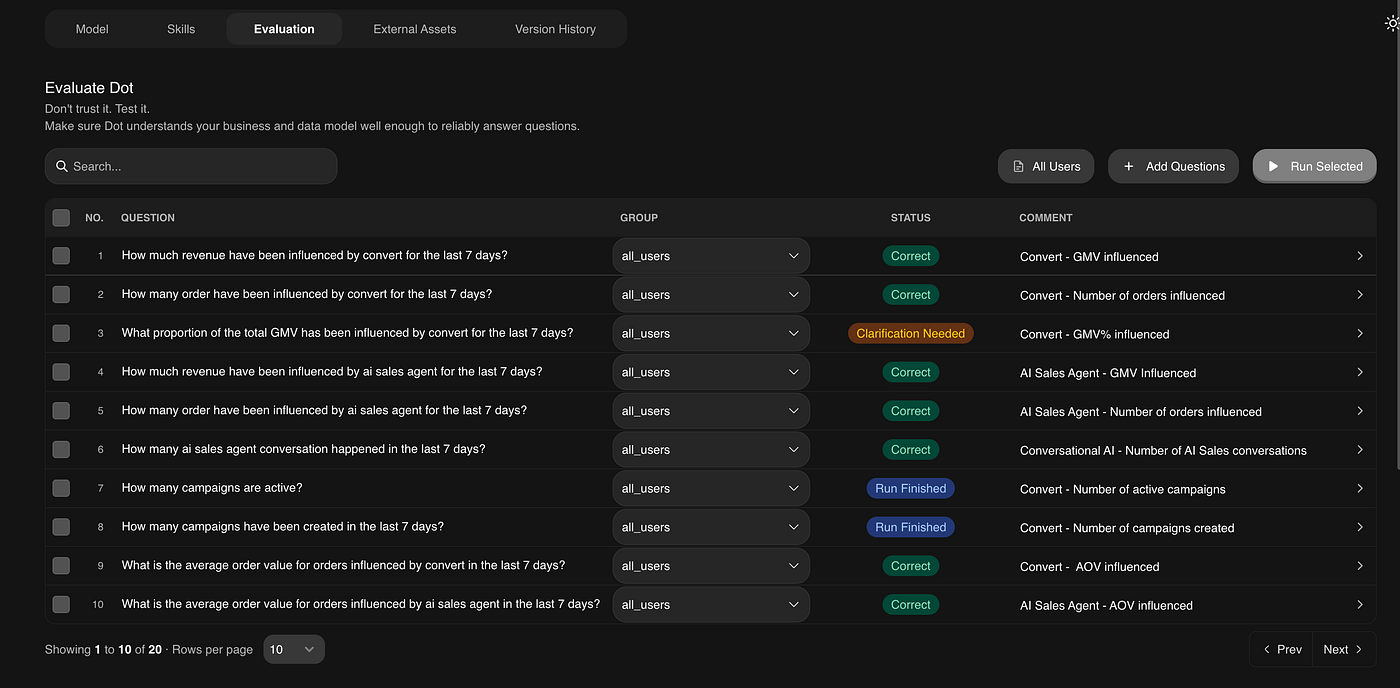
With adding more and more topics you might want to keep track on the impact that your changes to the different prompts do not negatively impact the other topic metrics accuracy. For that purpose you have a way to set up and run by batch multiple prompts and check the result easily.
In the evaluation section you will be able to add whatever question you want to be able to run in the futur to check for newly computed result. Especially you want to list all the metrics you defined in your model and mark them in the comment column by their “[topic] — [metrics name]” to find them quickly.
This approach allows you to monitor regressions as you expand to new topics.
Best Practice: run the complete evaluation suite every time you roll out a new topic, providing consistent benchmarking and early detection of any performance degradation.
Relationship
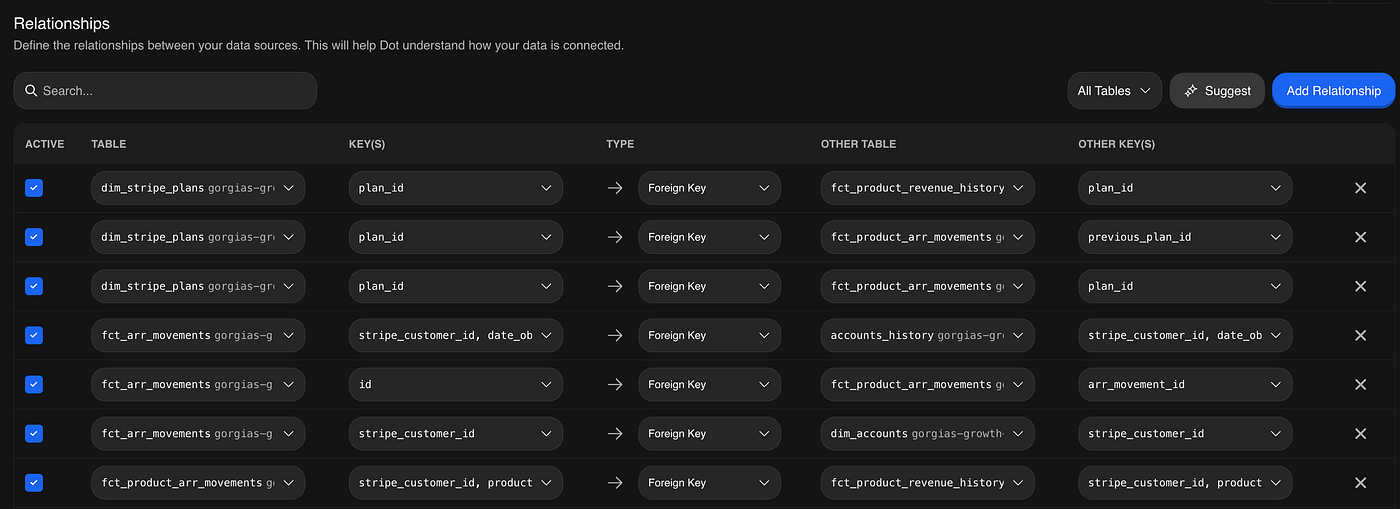
The last crucial feature of Dot is relationship mapping. Since most data model layers consist of multiple interconnected tables linked by foreign/primary keys rather than a single comprehensive table, defining these relationships explicitly provides Dot with two significant advantages:
- It prevents hallucinations when joining tables, ensuring Dot uses the correct keys (avoiding the common problem of incorrectly multiplying row counts by 100+ times due to improper joins)
- It enables Dot to incorporate relevant information from related tables when a specific model is selected as the primary object
Best Practice: When adding a new model to Dot, always define all necessary relationships to other models in your data ecosystem. This creates a comprehensive semantic layer that Dot can navigate effectively.
How to improve Dot performance
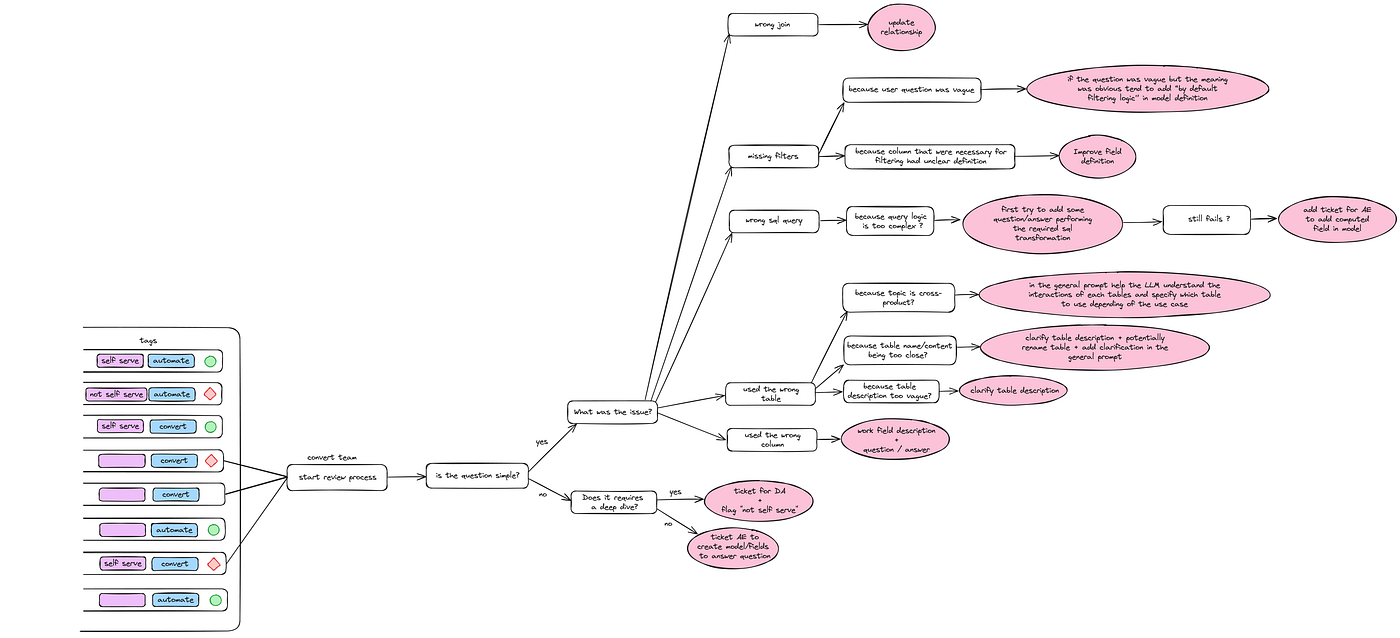
Now that you have something set up for one of your topic it can be hard to know what to update depending on the issue you see in the results you gets.
You have 6 potentials issues with your results that each needs differents treatments:
- Wrong join used in the query generated
This one is quite easy, you only need to update the relationship section of Dot and add the one you were hoping Dot should use between two models
- Missing filters
When query generation misses important filters, the issue can be categorized in two ways:
- Vague user question with implied filters: When users ask questions that seem complete but are missing expected filters ➡️ Add explicit guidance in the model’s “important details” section stating which filters should typically be applied
- Clear user question but unclear field definition: When users ask specific questions but Dot selects the wrong fields for filtering ➡️ Improve the field definitions to make their purpose, usage, and relationship to common queries more explicit
- The resulted generated query is wrong
First, we should ask ourselves: “Is the query logic we want Dot to compute truly complex?” If we expect Dot to perform complex joins, window functions, or calculations, there’s a high risk it might fail to generate them correctly.
The initial approach should be adding example queries in the model that demonstrate how to perform these complex computations. If this proves insufficient, then pre-compute these calculations in dbt within the model itself.
Finding the right complexity threshold for Dot to handle independently is challenging. This judgment will develop through experience as we implement and use the tool across numerous use cases.
- It uses the wrong table as a base
Here we have multiple potential causes for confusion:
- Cross-topic user query: When the user’s question spans multiple topics ➡️ Update the main prompt by clearly defining how topics interact and relate to each other
- Semantically similar concepts: When distinctions between similar metrics are unclear (e.g., company revenue vs. client revenue generated from our products) ➡️ Clarify table descriptions, consider renaming tables for better differentiation, and add explicit clarification in the main prompt
- Vague table descriptions: When the relevant table description lacks necessary specificity ➡️ Enhance the table description with more precise definitions, examples, and usage guidelines
- It uses the wrong column
To resolve this issue, simply update the descriptions for both columns involved: the one that was incorrectly used and the one that should have been used. Ensure each description clearly distinguishes the column’s specific purpose and appropriate use cases.
6. The question is simply too complex to be considered as self-service
Some questions are simply not suitable for self-service — they may be too complex or require too much deep analysis. For these cases, you should bring them to your data analytics team for further research.
Here is a decision tree summarising how to improve Dot accuracy:
How to roll-out Dot on your newly added Topic
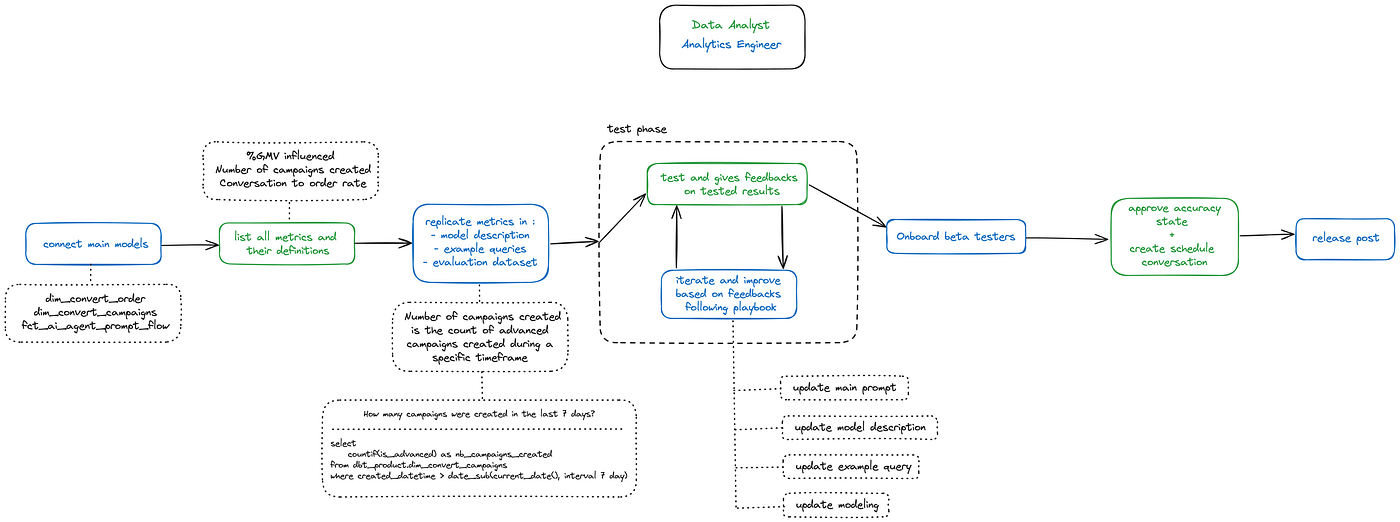
The process of rolling out a topic on Dot can be divided into 6 steps, allocated between the analytics engineer and the subject matter expert data analyst:
- Basic set up (the analytics engineer side)
Connect main models referring to that topic, add relationships, start a basic description in the main prompt follow your current structure.
- List all metrics to cover with Dot (the data analyst side)
The data analyst should document in a Notion page (or other accessible location) all metrics they want Dot to compute. For each metric, include:
- A high-level definition of the computation
- The official or commonly used name of the metric
- A link to an existing graph or report that already computes this metric (to serve as an exact computation example)
- Replicate metrics in Dot (the analytics engineer side)
Update the model description with each metric’s high-level definition and names. Additionally, add example queries for each metric.
Once you have them set up, the analytics engineer can independently test a battery of questions to implement a first round of improvements based on their knowledge of the topic. A recommended practice is to reference one of the main dashboards for that topic and attempt to reproduce the graph results by asking Dot to compute them. This approach allows the analytics engineer to work relatively independently during the initial round of updates and improvements.
- Internal improving phase (analytics engineer and data analyst together)
This phase consists of an iterative feedback loop between the analytics engineer and the data analyst. The data analyst asks topic-specific questions and provides feedback on result quality. Based on this feedback, the analytics engineer updates the various components of Dot. This back-and-forth process continues until the data analyst determines that Dot has achieved sufficient accuracy on the topic.
- Onboarding the beta-testers
Once you have a working implementation, onboard multiple beta testers who will ask questions that the data analyst or analytics engineer might not have considered. This provides additional feedback while building strong relationships and creating champions for Dot within various teams. Select participants from diverse departments related to your topic (engineering, design, marketing, product, etc.).
Schedule individual calls with these testers to explain how Dot works and how they could use it in the future. Clearly communicating that this is a beta version is crucial, as they may encounter hallucinations that you want them to report without losing trust in the tool.
Including users in the roll-out process will be one of the biggest levers for adoption when Dot becomes generally available. Invest sufficient time with each beta tester to explain how to access the tool, what it can and cannot do. The better informed they are, the more likely they will use it appropriately and experience less disappointment by asking questions within scope that have a higher probability of accurate responses.
- Schedule conversation and release (data analyst and analytics engineer)
Once the data analyst determines Dot is sufficiently accurate, he can create a “scheduled conversation.” A scheduled conversation is simply an conversation with Dot that is automatically delivered on a regular schedule via email or Slack. The data analyst can create a conversation showcasing the main metrics for that topic and schedule it to appear every morning in the primary Slack channel of rolled-out topic. After this is set up, the analytics engineer can announce the availability of the tool for that specific topic in the same channel.
Here is a drawing of the complete roll-out process:
Evaluate Dot performance
Once your topic is operational, you’ll want to track performance over time. For this purpose, we focus on two main variables:
- Quantitative measurement: What proportion of self-service questions are we able to accurately answer
- Qualitative assessment: At the end of each quarter, we consult with the data analyst responsible for the topic to determine if Dot has successfully offloaded routine questions from their workload
To be able to categorise questions referring to a certain topic, you can label each question within the UI or use the API to automatically detect and apply the appropriate labels.
Conclusion
This article reflects our learnings from implementing Dot in February 2025. If you’re reading this later, you may be using a different version of Dot with additional features beyond those described here. The goal is to provide a general understanding of our implementation strategy, where most concepts would apply regardless of the specific tool used.
Thank you for reading this far! Please don’t hesitate to share your feedback. :)
메타데이터
- post_id
- c6a4b600e4e5
- slug
- how-to-roll-out-a-data-conversational-agent-c6a4b600e4e5
- url
- https://medium.com/gorgias-engineering/how-to-roll-out-a-data-conversational-agent-c6a4b600e4e5
- canonical_url
- https://medium.com/gorgias-engineering/how-to-roll-out-a-data-conversational-agent-c6a4b600e4e5
- author_url
- https://medium.com/@yochankhoi
- status
- ok
- fetched_at
- 2026-06-14 11:28:49