Turbocharging Log Analysis with LLMs: Building a Natural Language Debugging Layer for ADX
Production issues can often feel like chasing shadows — intermittent, context-specific, and scattered across siloed logs. In my earlier…
Turbocharging Log Analysis with LLMs: Building a Natural Language Debugging Layer for ADX
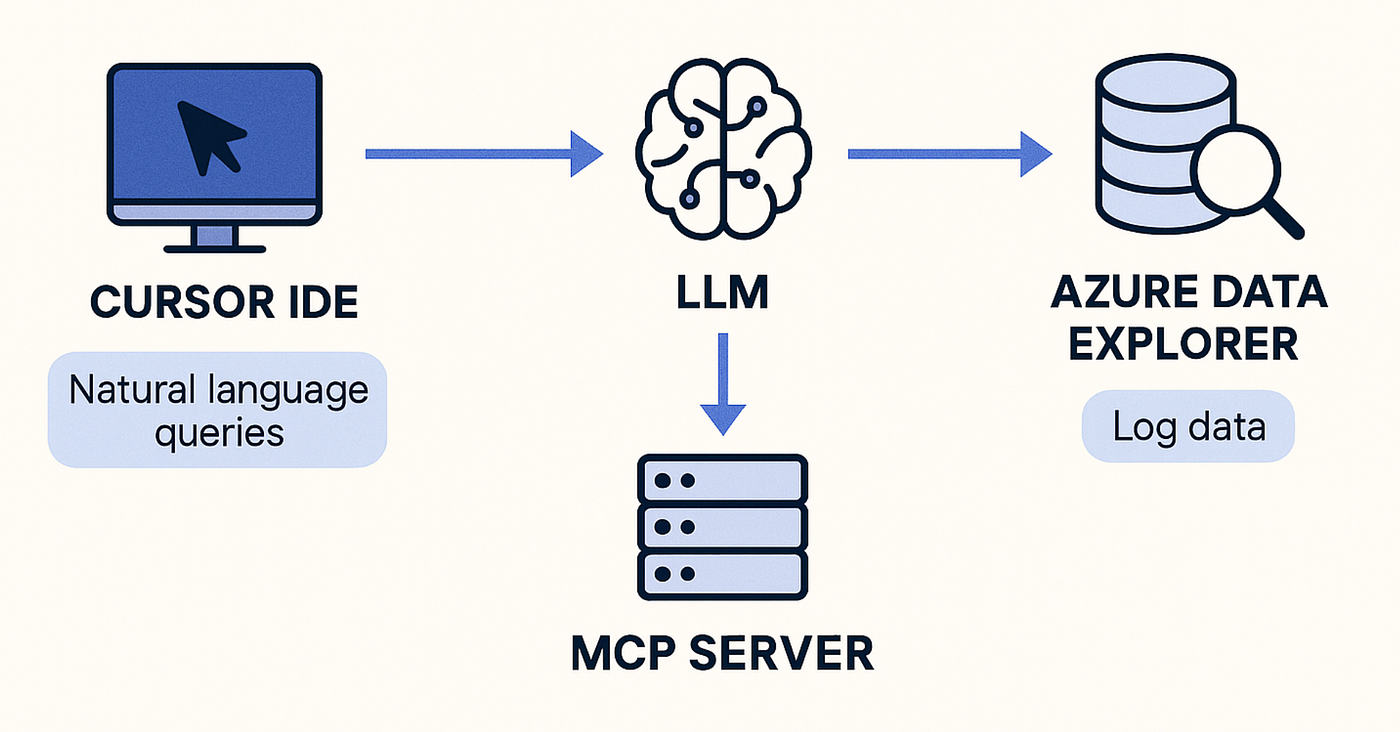
Production issues can often feel like chasing shadows — intermittent, context-specific, and scattered across siloed logs. In my earlier blogs(linked at the end of this post), I discussed setting up foundational infrastructure for production debugging — from centralizing logs to integrating observability tooling. Now, I’m excited to share the next evolution in this journey: a Model Context Protocol (MCP) server that enables natural language interaction with Azure Data Explorer (ADX) through Cursor IDE, powered by Large Language Models (LLMs).
This setup radically accelerates how we investigate user sessions, uncover anomalies, and diagnose complex issues by letting developers ask questions in plain English and instantly get relevant insights from logs and telemetry.
The Problem: Logs Are Powerful, But Not Friendly
Even with a robust centralized logging solution like Azure Data Explorer in place, debugging in production remains hard:
- Query fluency gap: Not every developer is fluent in Kusto Query Language (KQL), especially for ad hoc analysis under pressure.
- Time sink: Repetitive queries to triage sessions, filter errors, and trace flows eat up valuable time.
- Siloed exploration: Root cause analysis often requires piecing together breadcrumbs across multiple tables or services.
This led me to think: what if developers could just “talk” to ADX? Ask questions like:
- “Show me failed journeys for user ID 928a in the last 2 hours.”
- “Why did the checkout flow fail for session xyz?”
- “Are there any recurring 5xx errors in the last 24 hours?”
The Solution: Natural Language Debugging with MCP + ADX
What I Built
I built a Model Context Protocol (MCP) server that acts as a bridge between Cursor IDE and ADX, enabling LLM-powered natural language queries over structured telemetry data.
How It Works
MCP Server: Hosted on a public endpoint, this service exposes tools like:
execute_query— run KQL querieslist_tables— discover schemaget_table_schema— fetch column metadatasample_table_data— understand the shape of data
Cursor IDE Integration: Developers working in Cursor IDE can connect to this MCP, ask questions in natural language, and let the LLM translate those into precise KQL queries.
Dynamic Context Injection: The server dynamically builds prompts using schema, sample data, and query history to give the LLM full contextual awareness for accurate results.
Cursor Rules for Schema Guidance: To boost the LLM’s understanding of the data model, we use Cursor’s built-in “rules” feature to document the structure of our ADX schema — describing each table, its primary purpose, and the kind of data it holds. This dramatically improves the quality and correctness of the KQL queries being generated, especially when dealing with complex joins or domain-specific terminology.
Key Use Cases
Session-based Debugging
“What happened in user session
abc123?”
Instead of manually chaining multiple queries across the session table, event logs, and error records, the LLM can surface an end-to-end timeline with minimal input.
Pattern Detection Across Errors
“Are any API endpoints failing frequently today?”
Useful during incident response or postmortems, this helps surface noisy endpoints, new 5xx clusters, or problematic retries — instantly.
Performance Bottleneck Discovery
“Which workflows or pages have the highest latency in the last 1 hour?”
Developers can investigate latency anomalies without having to build charts or sift through aggregated dashboards.
Why This Matters
This workflow isn’t just about convenience — it unlocks:
- Faster Triage: From minutes to seconds
- Wider Adoption: Non-KQL experts can now debug
- Exploratory Analysis: Frees engineers to ask “what if” questions
- Extensible Tooling: The MCP architecture makes it easy to plug into other systems (Grafana, Sentry, custom dashboards)
Challenges and Future Improvements
- Prompt Accuracy: Complex queries still sometimes need tweaks. Few-shot examples and schema-driven guidance improve LLM performance.
- Table Overlap Hallucination: If similar data is present across multiple tables, the LLM may hallucinate or mix schemas, resulting in incorrect or ineffective KQL queries. Enhancing table descriptions and Cursor rules helps mitigate this.
Final Thoughts
This setup bridges the gap between human intuition and machine precision. It empowers teams to move from reactive debugging to intelligent, conversational diagnostics — making observability truly developer-first.
If you’re relying on ADX for logs and using Cursor IDE (or considering LLMs for dev tooling), I highly recommend exploring the MCP approach. Be sure to document your ADX schema using Cursor rules — that’s a low-effort, high-impact way to unlock even better query generation.
Feel free to reach out or drop a comment if you’re curious about the technical implementation — or want to try this setup yourself.
Links
- My previous blogs on production observability: Blog 1 • Blog 2
- Model Context Protocol
- Cursor IDE
- Azure Data Explorer
메타데이터
- post_id
- c6e2d79ca1e1
- slug
- turbocharging-log-analysis-with-llms-building-a-natural-language-debugging-layer-for-adx-c6e2d79ca1e1
- url
- https://medium.com/@imamudin/turbocharging-log-analysis-with-llms-building-a-natural-language-debugging-layer-for-adx-c6e2d79ca1e1
- canonical_url
- https://medium.com/@imamudin/turbocharging-log-analysis-with-llms-building-a-natural-language-debugging-layer-for-adx-c6e2d79ca1e1
- author_url
- https://medium.com/@imamudin
- status
- ok
- fetched_at
- 2026-07-10 06:45:42




