Stop Flying Blind: Enterprise Observability for Antigravity with Gemini Enterprise
Using Antigravity with Gemini Enterprise
Stop Flying Blind: Enterprise Observability for Antigravity with Gemini Enterprise
Using Antigravity with Gemini Enterprise
Developers can now use Antigravity through their Gemini Enterprise license. This integration brings major governance capabilities to platform administrators and security teams. Centralized settings make it easy to enforce security policies, manage available AI models, and maintain consistent developer configurations across teams.
Using Gemini Enterprise licenses also allows organizations to enable logging right at the inference endpoint. With inference logging active, administrators gain clear visibility and actionable insights into how Antigravity is used across the entire organization.
In this blog post, we look at these logs in detail. Specifically, we will explore:
- How to enable logging: Step by step guidance on configuring logging settings in Gemini Enterprise for your project.
- What they contain: A breakdown of metadata payloads, labels, and log structures for both metadata and prompt response logging.
- Insights you can extract: Concrete examples of actionable metrics and usage patterns that you can obtain directly from the log entries.
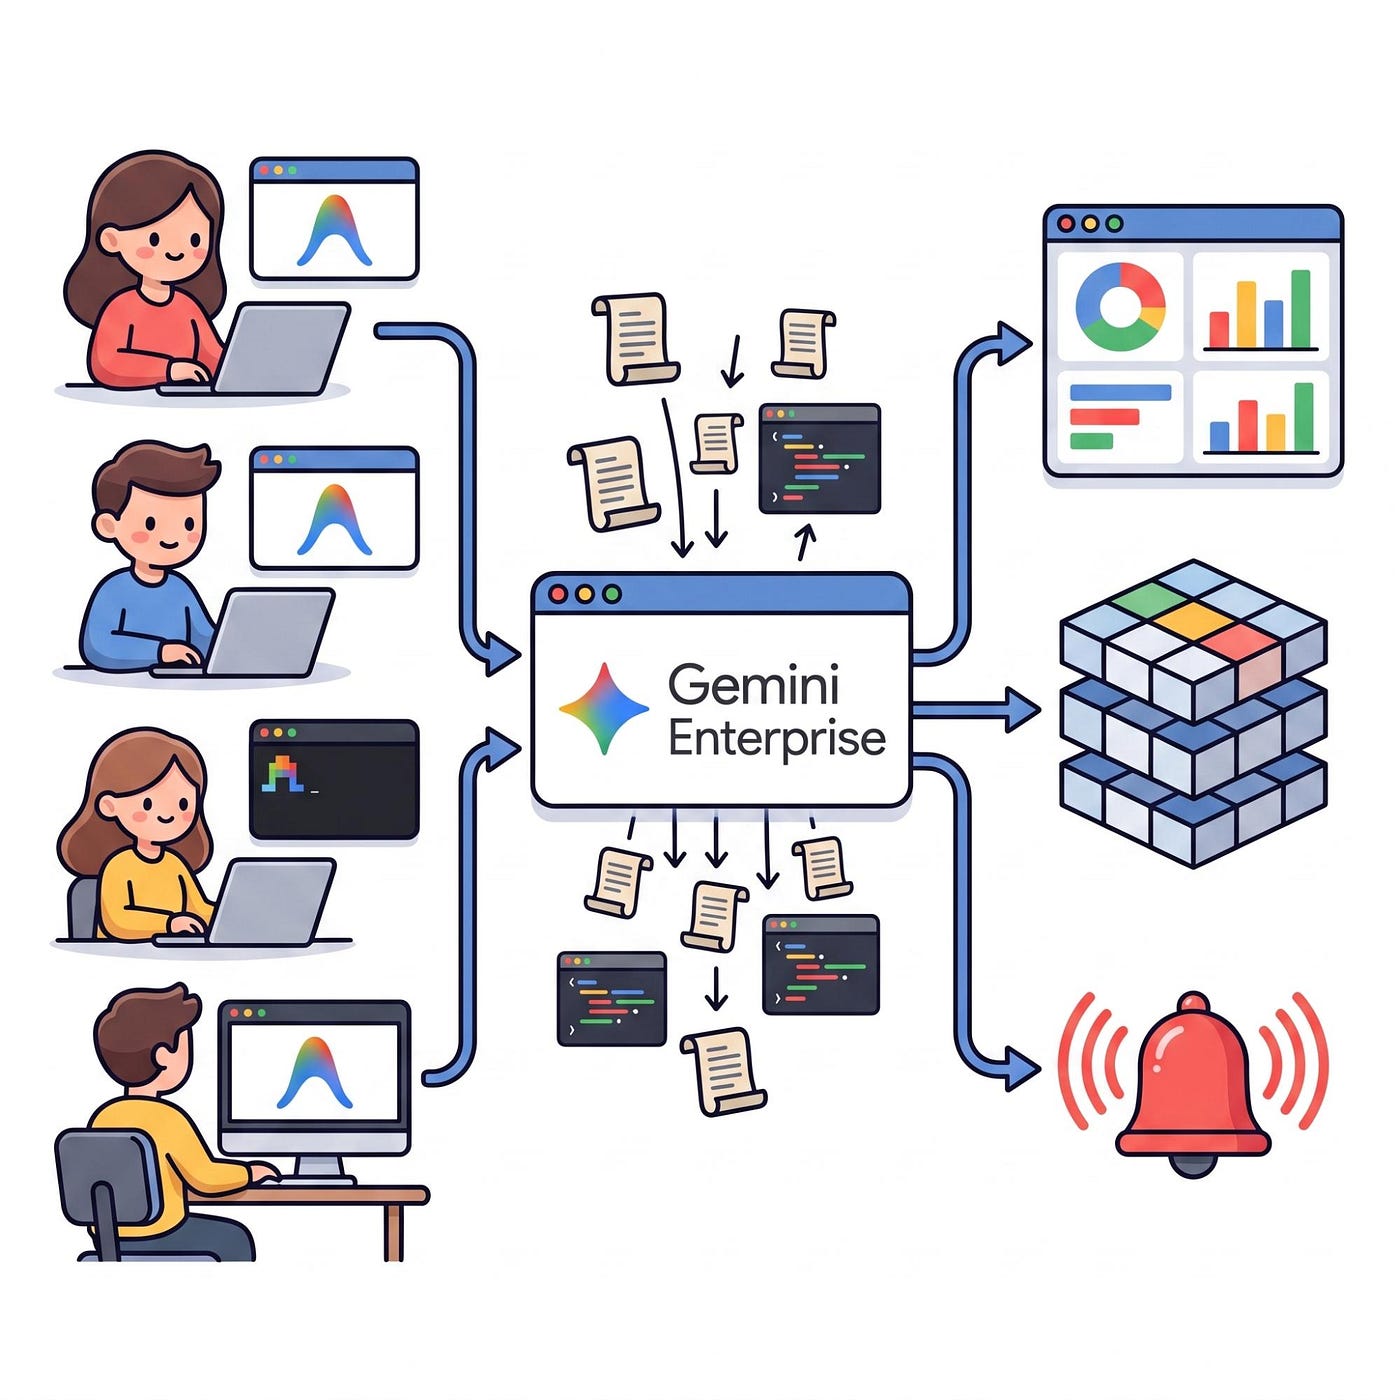
Using Gemini Enterprise for Antigravity Observability (by Nano Banana)
How to turn on Logging
If you have a project with a Gemini Enterprise subscription, you can follow the steps as listed out in the official documentation to enable the required APIs, obtain the permissions and enable the AI developer tools.
Once enabled, you should see the “AI developer tools” tab in the Gemini Enterprise > Settings page. On this settings page you have a number of options to govern how developers in your organization can use Antigravity. You also find the setting for configuring logging in two different flavors:
- Metadata logging: Captures metadata about the use of the inference service through Antigravity without storing the actual prompts and responses. With this setting enabled your code is not logged.
- Prompts and responses logging: In addition to the metadata fields this also logs the input prompt (what you type plus some additional system prompts) and the model outputs.
Which level you choose depends on factors including your observability needs. Also consider that prompt and response logging creates significantly more data volume than metadata logging alone and you might have to tweak your exclusion filters, log sinks, and retention policies to handle the increased log volume.
Full prompt logs may capture sensitive code snippets or user data. Even though the logs adhere to standard privacy policies and Google never accesses them for model training, you should strictly enforce the principle of least privilege when granting access. Restrict full log viewing access by granting permissive viewer roles only to authorized security auditors, while assigning standard team members roles that only permit viewing metadata.

Configure Logs in the Gemini Enterprise Settings
This configuration can be edited multiple times so you can for example turn on full logging to get a sense for how Antigravity works in the background and then switch to metadata logging only to reduce the overall log volume in a large-scale deployment.
Once the log is turned on and there is usage on the service after you enabled logging, you should
see the first couple of log entries in your logs explorer. With the following query:
resource.type="businessaicode.googleapis.com/BAICInstance"Let’s start digging into those logs to see what they are all about.
Metadata Logging Content
When enabling Metadata logging only (i.e. without prompts and responses logging) Antigravity generally creates one inference response log entry for every request that you make. Note that unlike in the prompt and response logging scenario the inference requests are not logged separately for metadata only. To see the response logs you can run the following logs query in Logs Explorer:
jsonPayload.@type="type.googleapis.com/google.cloud.businessaicode.logging.v1.InferenceResponseLog"Each log entry consists of the following structured logging elements (in addition to the default LogEntry fields):
jsonPayload: The structured JSON content containing domain-specific log details for the inference response:
@type: The Protobuf type URL defining the schema for this payload (e.g.,InferenceResponseLog).experience(e.g.,gemini-3.6-flash-low): The specific model configuration or variant tier used for processing the request.metadata: Additional execution metrics incl.totalTokenCount(e.g.,"19725") — The total number of tokens processed for this request.
labels: Key-value pairs containing metadata about the client and request context:
client_name(e.g.,antigravity_cli): The client application sending the request.client_version(e.g.,1.1.11): The version of the client software.model(e.g.,gemini-3.6-flash): The base AI model handling the request.request_id: Unique identifier for a specific interaction/turn within a session.trajectory_id: Unique identifier representing the entire agent conversation session.user_id(e.g.,user:bob@example.com): The user account associated with the request.
With this metadata you should be able to answer questions like:
- Who are the most active users of Antigravity?
- What are the most popular client surfaces?
- How many tokens are used per user / model / client surfaces?
- Which client versions are in use (and potentially need upgrading)?
What is notably missing in the metadata logs is any information about the prompt and response content. For that we have to also opt in to logging these fields as well.
Prompts and Responses Logging
When enabling prompts and responses logging you get another type of log entry that captures the inference request. To specifically query the relevant request and response logs you can run the following query in logs explorer:
jsonPayload.@type="type.googleapis.com/google.cloud.businessaicode.logging.v1.InferenceRequestLog" OR jsonPayload.@type="type.googleapis.com/google.cloud.businessaicode.logging.v1.InferenceResponseLog"This should give you the request response pairs for every inference request to the model

Raw Logs generated by Antigravity Users
On the request log you can see the user prompt and system prompts in the input object:
jsonPayload: {
    @type: "type.googleapis.com/google.cloud.businessaicode.logging.v1.InferenceRequestLog"
    experience: "gemini-..."
    input: {
        context: {
            files: []
        }
        messages: [
            {
                author: "USER"
                content: "<USER_REQUEST>...</USER_REQUEST>
                        <ADDITIONAL_METADATA>...</ADDITIONAL_METADATA>"
            }
        ]
    }
}
Note that the exact syntax of the user request formatting and the use of XML tags isn’t part of any published schema and might change at any time or even be inconsistent between different calls. Therefore I would not rely on them for extracting information e.g. through a regex based string parsing.
Similarly, on the response log you now find an output object that includes the model response:
jsonPayload: {
    @type: "type.googleapis.com/google.cloud.businessaicode.logging.v1.InferenceResponseLog"
    experience: "gemini-..."
    metadata: {
        totalTokenCount: "..."
    }
    output: {
        candidates: [
            {
                messages: [
                    {
                        author: "MODEL"
                        content: "..."
                    },
                    ...
                ]
            },
            ...
        ]
    }
}
Exploring the Logs in Logs Explorer
Having these interaction logs in Logs Explorer allows us to perform interesting investigations. For instance, you can pinpoint a conversation by its trajectory ID. The trajectory ID conceptually maps to the conversation ID that you see in the Antigravity client but unfortunately, as of writing this post, you can’t map the client-side conversation ID to the trajectory ID in the server-side logs.

Viewing Logs in Logs Explorer
Digging into the logs you might also spot the use of the small Flash Lite models even if you’re using a more capable model in your Antigravity session: Apparently Antigravity issued a request to the tiny model to come up with a smart title for our conversation such that this response:
 jsonPayload: {
    @type: "type.googleapis.com/google.cloud.businessaicode.logging.v1.InferenceResponseLog"
    experience: "gemini-3.1-flash-lite"
    metadata: {...}
    output: {
        candidates: [
            0: {
                messages: [
                    0: {
                        author: "MODEL"
                        content: "Launching Demo"
                    }
            1: {
                        author: "MODEL"
                        content: " From Documentation"
                    }
                ]
            }
        ]
    }
}
This output is then visible in /resume command in the CLI or in the conversation header in the Antigravity 2.0 UI.

Generated session title in /resume in Gemini CLI
Analyze with Log-Based Metrics
Looking at logs in the logs explorer is great but what if we want to dig deeper into the usage of our teams? Having to scroll through a chatty logs stream isn’t practical for this use case. We need metrics. Luckily with Log-Based metrics we can transform our logs into a nice stream of metrics.
For my purposes, I have turned the InferenceResponseLog messages into two separate metrics.
- businessaicode-tokens (Distribution) to get stats around the total token consumption values that are logged with each response.
- businessaicode-users (Counter) to get counter stats that we can slice by different labels.
The labels that I extracted for each of the metrics are:
- User ID
- Model ID
- Client Name
- Client Version

Log-Based Metrics
Metrics Dashboards
With the metrics in place we can start making them more useful e.g., by creating metrics dashboards:

A Dasboard on top of the Log-Based Metrics
We can even use these metrics to create alerts that fire for example when a user’s token consumption exceeds a threshold (note that the threshold in the screenshot below was arbitrarily set for illustration only):

Turning Log-based Metrics into Alerts
Analyze Usage in Detail with BigQuery
If you have an analytics use case that goes beyond what simple metrics can provide or want to correlate your data with additional enterprise data e.g. to map your user IDs to departments or cost centers you most likely will end up using BigQuery.
Turning a logs bucket into a BigQuery dataset is straightforward and documented in the Cloud Logging documentation.
In BigQuery you can then do things like join your request and response logs to get a better understanding of the back and forth between Antigravity and the models. Of course, you can also use Antigravity to help you come up with the GoogleSQL query for later retrieving itself in the logs.
WITH request_logs AS (
  SELECT
    JSON_VALUE(labels, '$.request_id') AS request_id,
    json_payload.input AS input
  FROM
    `strebel_workspace_default_log_bucket._AllLogs`
  WHERE
    JSON_VALUE(json_payload.`@type`) = 'type.googleapis.com/google.cloud.businessaicode.logging.v1.InferenceRequestLog'
    AND JSON_VALUE(labels, '$.request_id') IS NOT NULL
    AND json_payload.input IS NOT NULL
),
response_logs AS (
  SELECT
    JSON_VALUE(labels, '$.request_id') AS request_id,
    json_payload.output AS output
  FROM
    `strebel_workspace_default_log_bucket._AllLogs`
  WHERE
    JSON_VALUE(json_payload.`@type`) = 'type.googleapis.com/google.cloud.businessaicode.logging.v1.InferenceResponseLog'
    AND JSON_VALUE(labels, '$.request_id') IS NOT NULL
    AND json_payload.output IS NOT NULL
)
SELECT
  req.request_id,
  req.input,
  resp.output
FROM
  request_logs req
INNER JOIN
  response_logs resp
ON
  req.request_id = resp.request_id
If you want to enable non-technical users to chat with your data, then the conversational analytics agent provided by BigQuery is definitely the most approachable solution. Give it the logs dataset and a couple of example queries and you can start chatting with your data as if you had your own personal data analyst.

Using the Logs as the Basis for Conversational Analytics in BigQuery
Of course, we can take it even further and make this agent accessible to the team via the Gemini Enterprise app and bring it full circle back into the Gemini Enterprise environment. All you need is the BigQuery A2A agent card and a Client ID and Secret from the Cloud Console.

Gemini Enterprise A2A Agent Configuration
And now you can start chatting with your Antigravity activity logs data right from your Gemini Enterprise app.

Using the BigQuery Conversational AX Agent from Gemini Enterprise
Conclusions and Next Steps
If you haven’t already done so, start by enabling AI developer tools within your Gemini Enterprise subscription to give your organization the needed governance over developer workflows. Activate the optional observability logging to gain crucial visibility into how AI models serve your teams. To get started, enable metadata or prompt response logging in your Gemini Enterprise settings. Run your first queries in Logs Explorer, set up Log-Based Metrics to track token usage, and export your log data to BigQuery for deep analytics.
메타데이터
- post_id
- c741aad4e46f
- slug
- stop-flying-blind-enterprise-observability-for-antigravity-with-gemini-enterprise-c741aad4e46f
- url
- https://medium.com/google-cloud/stop-flying-blind-enterprise-observability-for-antigravity-with-gemini-enterprise-c741aad4e46f
- canonical_url
- https://medium.com/google-cloud/stop-flying-blind-enterprise-observability-for-antigravity-with-gemini-enterprise-c741aad4e46f
- author_url
- https://medium.com/@danistrebel
- status
- ok
- fetched_at
- 2026-08-17 07:46:50