Your Logistics Dashboard Is Lying to You- AIficatation of your logistics
Not with bad data. With the wrong questions.
Your Logistics Dashboard Is Lying to You- AIficatation of your logistics
Not with bad data. With the wrong questions.

Here’s a scene that plays out in logistics operations rooms across India every morning.
The dashboard is open. On-time delivery: 87.3%. Exceptions: 42 active. Halts: 11 unresolved. Cost per shipment: ₹14,200.
The operations manager looks at it, nods, and opens WhatsApp.
Because the dashboard told him nothing he can act on.
He already knew exceptions were up. He doesn’t know which exceptions are about to breach SLA in the next four hours. He can see 11 unresolved halts. He doesn’t know which three of those are genuine breakdowns and which eight are drivers taking lunch. He has a cost-per-shipment number. He has no idea which lane, which transporter, and which vehicle type is driving it up.
The data is there. The intelligence isn’t.
This is the gap IntuGenie was built to close.
The Real Problem Is Not Data. It’s Generic Visibility.
Enterprise logistics teams in India are not data-poor. Most large operations running on platforms like IntuTrack have rich, real-time streams: trip data, ETA updates, halt logs, exception classifications, POD status, transporter performance scores, freight costs, compliance records.
The problem is that this data is presented generically — the same dashboard for a cement manufacturer dispatching bulk tankers and an FMCG company managing temperature-sensitive last-mile delivery. Same metrics. Same alerts. Same structure.
But a cement manufacturer’s most critical question on a Monday morning is not the same as an FMCG company’s. A coal logistics team managing plant inbound inventory doesn’t need the same intelligence surface as a freight marketplace matching loads to carriers.
Standard visibility shows information. Customised intelligence creates action.
That’s the distinction IntuGenie is built on.
*Why generic logistics dashboards fail enterprise operations*
What IntuGenie Actually Is
IntuGenie is Intugine’s AI-powered transportation analytics layer. It doesn’t replace your existing visibility platform. It sits on top of it.
The architecture is deliberately simple:
Your existing data (trips, ETAs, halts, exceptions, POD, compliance, freight costs) feeds into the IntuGenie AI layer, which queries, analyzes, and contextualises it according to your specific operating logic — and surfaces customised operational intelligence in the form of reports, dashboards, workflows, and decision support.
One data foundation. Multiple customised outcomes.
The shift it enables is not manual to automated. It’s standard to customised — visibility that understands the context of your supply chain rather than presenting the same generic slice to everyone.
The Questions That Actually Matter
The best way to understand what IntuGenie does is to look at the questions it can answer — questions that a standard dashboard simply cannot.
Which trips are at risk of SLA breach in the next three hours? Not which trips have exceptions. Not which trips are delayed. Which specific trips, ranked by breach probability, need intervention right now.
Which transporter has the highest exception rate on this lane this month? Not aggregate exception count. Lane-specific, transporter-specific, time-bounded.
Which halts are still unclassified? Unclassified halts are operationally invisible — they could be breakdowns, diversions, rest stops, or pilferage events. IntuGenie surfaces the unresolved ones, not the total halt count.
Where is lead distance variance increasing? Not average lead distance. The trend. Which lanes are getting longer, which routes are drifting from planned paths at a systemic level.
Which shipments need escalation before SLA impact? Not after the breach is recorded. Before it happens.
Which locations are creating repeated detention? Not detention time as an aggregate metric. The specific origin yards, destination facilities, and intermediate stops that are structurally slow — the ones where dwell time consistently exceeds threshold.
These are not exotic analytics requests. They are the questions every logistics operations manager wants answered every morning. They just couldn’t be answered by the dashboard.
*What to track in a logistics KPI dashboard | [Detention time — causes and how to reduce it](https://library.intugine.com/detention-time-logistics-india)*
Why Different Supply Chains Need Different Intelligence
This is where the design philosophy of IntuGenie becomes important.
A standard BI tool gives you the same query interface regardless of domain. That’s its strength and its limitation — it’s flexible but context-free. It doesn’t know that in cement logistics, back-unloading at an unregistered location is a pilferage signal, not a route deviation. It doesn’t know that in coal logistics, a halt within 5 km of a power plant’s inbound gate during a peak inventory replenishment window has a completely different risk profile than the same halt on an open highway.
IntuGenie is built to carry that context.
For cement operations, the intelligence priorities are: unloading verification (did the discharge happen at the registered destination?), back-unloading risk (was material offloaded before reaching the destination?), dealer delivery accuracy, and route compliance. These are specific to the bulk tanker and tipper model that drives cement distribution in India.
For coal and power, the priorities shift: halt classification (is this a genuine breakdown or a suspicious stop near a competing buyer?), plant inbound ETA (inventory buffer management at power plants is time-critical), trip risk scoring, and exception escalation before plant production is affected.
For freight marketplaces, the intelligence surface is different again: transporter reliability scoring by lane, vehicle availability forecasting, lane fitment matching, and supply intelligence — understanding where capacity is likely to tighten before it actually does.
The same underlying trip and exception data. Completely different intelligence surfaces, configured to the operating logic of each vertical.
*AI logistics platform deployments in India 2026 | [Fleet performance analytics for Indian logistics](https://library.intugine.com/fleet-performance-analytics-logistics-india)*
The “Transformation Project” Trap
There’s a specific reason the carousel that introduced IntuGenie opened with the line: “AI should plug into your logistics operations. Not become another transformation project.”
It’s a genuine problem in enterprise logistics technology.
Most large Indian enterprises that have invested in supply chain visibility over the past five years have done so through multi-year implementation projects — ERP integrations, custom BI deployments, TMS rollouts. The ROI timelines are long. The change management is exhausting. The gap between what was promised in the demo and what’s live in production eighteen months later is often significant.
IntuGenie is architected as an additive layer, not a replacement system. It plugs into existing visibility data — whether that’s IntuTrack, another TMS, or a custom ERP integration — and adds the intelligence layer on top. No rip-and-replace. No 12-month implementation. No retraining the entire operations team on a new system.
The result is that the value is visible quickly. A logistics team that’s been staring at the same generic dashboard for three years can start asking IntuGenie specific operational questions from day one — and get answers that the dashboard was never designed to provide.
*Logistics digital transformation India — a practical roadmap*
What Enterprises Actually Gain
Three outcomes show up consistently across IntuGenie deployments:
Faster decisions. The bottleneck in logistics operations is rarely data collection — it’s the time it takes to turn data into a decision. When a manager has to cross-reference three reports and call two people to answer “which trips need attention right now,” decisions slow down. When IntuGenie surfaces the answer directly, the decision cycle compresses from hours to minutes.
Enterprise-specific intelligence. Insights configured to your operating logic, not a generic logistics benchmark. A cement manufacturer’s on-time performance metric means something different from an express logistics company’s — the thresholds, the exception classifications, the SLA structures are different. IntuGenie carries that specificity.
Actionable workflows. Reports and dashboards that connect directly to escalation flows. Not a table of data you have to interpret and then manually escalate — a workflow that moves from insight to action without a human manually bridging the gap.
The broader principle the IntuGenie team articulates simply: AI becomes most useful when it fits the operation it serves.
Generic AI on top of logistics data produces generic insights. Contextualised AI — tuned to the specific workflows, risk patterns, and decision logic of a cement plant or a coal corridor or a freight marketplace — produces intelligence that actually changes what happens on the ground.
The Dashboard Is Not the Problem
One last thing worth saying clearly: IntuGenie is not an argument against dashboards.
Dashboards are valuable. Real-time visibility is valuable. Knowing where your trucks are, what the current ETA looks like, and how many exceptions are open is genuinely useful operational information.
The argument IntuGenie makes is narrower and more precise: visibility is necessary but not sufficient. The next layer — the layer that contextualises that visibility against your specific operating logic, asks the right questions of the right data, and surfaces answers you can act on immediately — is the layer that most logistics operations are still missing.
The future of transportation analytics is not more dashboards. It is AI that understands how each supply chain actually works.
That’s what IntuGenie is.
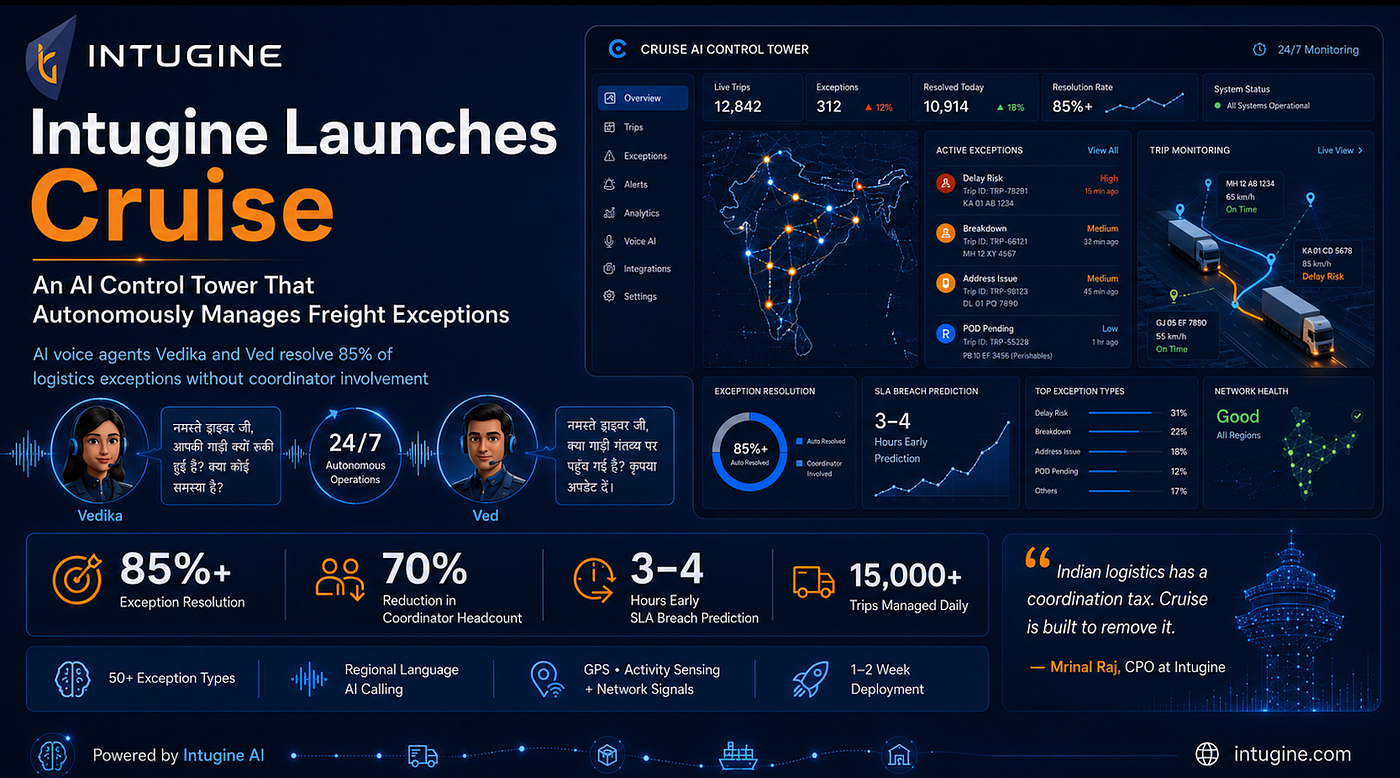
IntuGenie is part of the Intugine platform, which includes IntuTrack (real-time fleet visibility), Cruise (AI control tower and exception management), and the IAS module (activity sensing using sensors for bulk freight). Together they form a complete supply chain intelligence stack for enterprise logistics operations.
Explore the full Intugine knowledge library at [library.intugine.com](https://library.intugine.com/)
Learn more about IntuGenie at [intugine.com](https://intugine.com/)
메타데이터
- post_id
- c88dfeb82a45
- slug
- your-logistics-dashboard-is-lying-to-you-aificatation-of-your-logistics-c88dfeb82a45
- url
- https://medium.com/supply-chain-story/your-logistics-dashboard-is-lying-to-you-aificatation-of-your-logistics-c88dfeb82a45
- canonical_url
- https://medium.com/supply-chain-story/your-logistics-dashboard-is-lying-to-you-aificatation-of-your-logistics-c88dfeb82a45
- author_url
- https://medium.com/@reymrinal
- status
- ok
- fetched_at
- 2026-07-22 23:32:06