Complete rest or light exercise for better next-day recovery?
As a long time user of WHOOP (900+ nights and counting) and someone keen on my own physical health, I aim to achieve high physical recovery…
Complete rest or light exercise for better next-day recovery? Testing it on 967 nights of my WHOOP data
As a long time user of WHOOP (900+ nights and counting) and someone keen on my own physical health, I aim to achieve high physical recovery metrics before big sessions / sporting events. My prior assumptions of rest up and do as little as possible the day before I want my body to peak have been shifting lately. I am now starting to believe that I am more likely to have a green recovery (a recovery score >= 67%, see WHOOP Recovery) on the day following a day of medium-low exertion (e.g. a light 15 minute jog or a long walk) than a day where I make a conscious effort to reduce physical exertion and limit myself to a couple of short walks at most. However, I have never investigated this with the actual data, therefore I aimed to investigate the probability of having a green recovery the day following different levels of strain (see WHOOP Strain). Based on my recent change in beliefs, I expected to find an inverted U-shape in Green Recovery probability with strain. E.g. Probability of green recovery increases until a medium-low level of strain before reducing below low levels of strain when reaching the higher strain levels.
However, following a dive into my own data (n=1) my recent changes in beliefs are no longer growing stronger. Not only did I not find an inverted U-shape increase in probability with the increase in strain, the analysis provided evidence supporting a continuous decline in the probability of achieving a green recovery score in line with prior day strain increasing.
The prior 967 days of recovery scores were grouped (≤33 =Red, >33 & ≤ 66 = Amber, >66 = Green) and shifted 1 row to align with the prior days strain scores. The strain scores were also grouped (≤5.25 = Low, >5.25 & ≤ 10.5 = Medium-Low, >10.5 & ≤ 15.75 = Medium-High and >15.75 & ≤ 21 = High).
From this a base rate for the probability of a green recovery score was calculated to be 0.415 (401 of 967 days) and this was used as the base rate prior. For each of the four strain categories, the total nights, green recoveries and conditional probabilities were then calculated.
Low: 209 days | 131 Green Recoveries | P(Green Recovery | Low Strain) = 0.627
Medium-Low: 495 days | 218 Green Recoveries | P(Green Recovery | Medium-Low Strain) = 0.440
Medium-High: 202 days | 51 Green Recoveries | P(Green Recovery | Medium-High Strain) = 0.252
High: 61 days | 1 Green Recovery | P(Green Recovery | High Strain) = 0.016
The base rate of 0.415 is the observed probability of a green recovery and not the true rate, therefore the the beta distribution to calculate the probability of a the base rate probability was implemented. Using this as the prior helps shrink the mean posterior towards the base rate in the strain bands with a smaller number of days (such as the High band n=61, one green night).
When investigating the prior strength (number of days of data) to include when calculating the posterior means, the impact of 1, 10, 50 and 100 nights on the mean and band size was investigated. Figure 1 below shows the impact of the prior strength on the High strain band in comparison to the more populated strain bands. As a result of this analysis, showing the impact of strength=50 (mean=0.20) vs strength=10 (mean=0.07) vs the raw (0.02) it was decided to use 10 nights as the strength for the beta prior (alpha = 4.15, beta = 5.85).
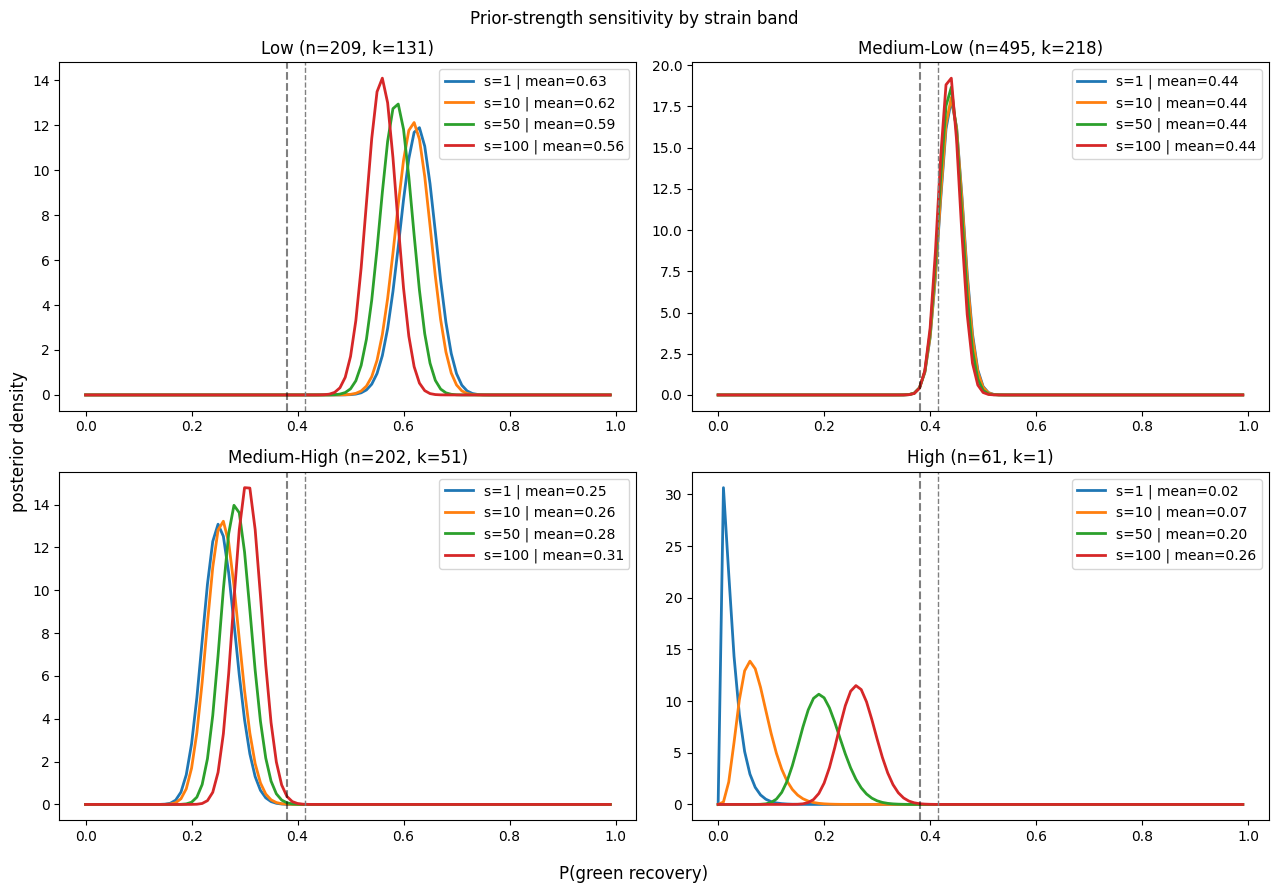
Figure 1: Impact of Prior Strength on mean sensitivity within each strain band
The posterior mean and the 95% credible intervals were then calculated for P(Green Recovery | Strain) using the beta distribution. The 95% credible intervals provide a range for which there is a 95% probability that the true value lies within the range. given the data and the prior. This differs from a 95% confidence interval which provides an interval that the true value would be present in within 95% of repeated experiments (Hespanhol et al., 2019).
from scipy.stats import beta

green_nights_total = len(df_cat[df_cat['recovery_category_shift']=='Green'])
total_nights = len(df_cat['created_at'])

# Creates a dict for the green recovery, total recoveries and p(green recovery)
strain_cat_dict = {"Low":None, "Medium-Low":None, "Medium-High":None, "High":None}
for cat in strain_cat_dict.keys():
    df_strain_cat = df_cat[df_cat['strain_category']==cat]
    strain_nights = len(df_strain_cat)
    green_nights = len(df_strain_cat[df_strain_cat['recovery_category_shift']=='Green'])
    green_night_probability = green_nights / strain_nights

    strain_cat_dict.update({cat: [strain_nights, green_nights, green_night_probability]})

# Calculates the base rate for P(Green Recovery)
base_rate = green_nights_total / total_nights
s = 10
alpha_prior, beta_prior = base_rate * s, (1 - base_rate) * s

# calculates the posterior mean and 95% confidence intervals
for i, cat in enumerate(strain_cat_dict.keys()):
    n, k = strain_cat_dict[cat][0], strain_cat_dict[cat][1]
    a_post, b_post = alpha_prior + k, beta_prior + (n - k)
    posterior_mean = a_post / (a_post + b_post)
    low, high = beta.ppf([0.025, 0.975], a_post, b_post)
Figure 2 shows the results for each strain band in which the 95% credible intervals do not overlap in any of the strain bands and provides evidence that the relationship between strain level and P(Green Recovery) is not an inverted U-shape as expected, but actually a monotonic decline in P(Green Recovery) as strain increases.

Figure 2: Posterior Mean & 95% credible intervals for P(Green Recovery | Prior Day Strain) showing P(Green Recovery) falls monotonically as strain increases
The findings of this analysis show an association between green recovery scores and a low level of strain the day prior. Thus, supporting the resting up and keeping strain levels low on the prior day is associated with a greater probability of next day recovery being green.
Some of the physiological mechanisms relating to the reduced probability with increasing strain will be, increased sympathetic activation following exercise delaying parasympathetic reactivation. In studies investigating intense running sessions (James et al., 2013) and resistance training (Flatt et al., 2019) have found varying recovery times up to 24 hours post exercise for HRV metrics as a result of reduced parasympathetic activation. This provides evidence for for increased resting heart rate, suppressed HRV and thus negatively impacting sleep among other factors which all contribute to the WHOOP recovery score and therefore reducing the probability of green recoveries as strain increases.
It should be noted there are sizeable limitations to this finding as the analysis was kept light touch without controlling for a large amount of confounding factors to a recovery score. Despite this, the bayesian method implemented here provides a solution accounting for variations in sample sizes to answer a question without diving deep and losing months of my life in a python notebook.
This analysis provides a platform for further investigation of key positive health drivers and sets the basis for predictive modelling of recovery scores.
References
Hespanhol L, Vallio CS, Costa LM, Saragiotto BT. Understanding and interpreting confidence and credible intervals around effect estimates. Braz J Phys Ther. 2019 Jul-Aug;23(4):290–301. doi: 10.1016/j.bjpt.2018.12.006. Epub 2018 Dec 31. PMID: 30638956; PMCID: PMC6630113.
James, D. V. B., Munson, S. C., Maldonado-Martin, S., & De Ste Croix, M. B. A. (2012). Heart Rate Variability: Effect of Exercise Intensity on Postexercise Response. Research Quarterly for Exercise and Sport, 83(4), 533–539. https://doi.org/10.1080/02701367.2012.10599142
Flatt AA, Globensky L, Bass E, Sapp BL, Riemann BL. Heart Rate Variability, Neuromuscular and Perceptual Recovery Following Resistance Training. Sports (Basel). 2019 Oct 18;7(10):225. doi: 10.3390/sports7100225. PMID: 31635206; PMCID: PMC6835520.
메타데이터
- post_id
- c96bf62802a0
- slug
- complete-rest-or-light-exercise-for-better-next-day-recovery-c96bf62802a0
- url
- https://medium.com/@jordan.l.pickles/complete-rest-or-light-exercise-for-better-next-day-recovery-c96bf62802a0
- canonical_url
- https://medium.com/@jordan.l.pickles/complete-rest-or-light-exercise-for-better-next-day-recovery-c96bf62802a0
- author_url
- https://medium.com/@jordan.l.pickles
- status
- ok
- fetched_at
- 2026-08-21 11:38:00