Public libraries are still open to the public (but not as often as they used to be)
Note: This post was written for an assignment in LIS 572 at the University of Washington’s Information School.
Public libraries are still open to the public (but not as often as they used to be)
Note: This post was written for an assignment in LIS 572 at the University of Washington’s Information School.
Recently, a hairdresser asked me what I was studying in school. When I told him I was studying library science with the goal of working in a public library after graduation he looked surprised and remarked, “Public libraries must be disappearing, no?”
I worry that this may be a common perception. In truth, libraries continue to be central to the civic life of many cities, and provide needed spaces for some of our most vulnerable neighbors. The continued importance of libraries is hard to summarize in any individual statistic, but as an example, the Seattle Public Library had 330,00 unique active patrons last year in a city with a population of roughly 781,000 (Seattle Public Library; U.S. Census). With nearly half of all residents regularly using the library, we cannot afford to think of libraries as disappearing.
However, the reality underlying my hairdresser’s assumption is that libraries are under threat. A year ago, in March 2025, President Trump issued an executive order to eliminate the Institute of Museum and Library Services (see this ALA page for more information about the order). The IMLS provides funding to vulnerable libraries and library programs, and also collects data on the state of public libraries nationwide. Though the IMLS is temporarily safe (thanks to the advocacy efforts of the American Library Association and other organizations), it’s important to recognize that libraries need our protection.
To further understand the state of libraries, I delved into the IMLS Public Library Survey datasets from 2019 and 2023. I wanted to understand how access to public libraries has changed over time, and particularly how it changed in the years following the Covid-19 pandemic. I chose to use open hours as a proxy for accessibility, since the IMLS collects limited data on other library details. In the IMLS’s own assessment, library open hours had mostly bounced back from Covid-19 by 2023, particularly in large cities (Public Library Trends). However, total nationwide hours were still down. I wanted to take a look at how these changes played out at a more detailed level, to understand where and what kinds of library services might be under the most threat. I also wanted to publicize the IMLS data to show how valuable the agency’s work can be.
The Dataset
My analysis is based on two connected datasets: the IMLS Public Libraries Survey Data from 2019 and the IMLS Public Libraries Survey (PLS) Data from 2023 (find the full data here: IMLS). For the PLS, the IMLS collects data from “approximately 9,000 public libraries with approximately 17,000 individual public library outlets… in the 50 states, the District of Columbia, and outlying territories” (IMLS PLS Overview). It has conducted the PLS annually since 1988. The PLS is coordinated at the state level by state library agencies, and asks public libraries about “library visits, circulation, size of collections, public service hours, staffing, electronic resources, operating revenues and expenditures and number of service outlets.” It is a voluntary census containing data submitted by public libraries, and it had over a 95% response rate for both 2019 and 2023.
I focused my analysis primarily on the outlet data files, which contain records for every individual library location, rather than aggregating by library system. The 2023 file has 17,586 records representing outlets of 9,252 library systems. These outlets came from all 50 states and most US territories, but excluded libraries from Puerto Rico and American Samoa because those territories did not answer the survey in 2023. The overall survey response rate for libraries nationwide in 2023 was 96.4%. The 2019 file contains 17,496 records representing outlets of 9,237 libraries. As with the 2023 data, the survey includes data from all 50 states but not Puerto Rico. However, the 2019 dataset does include the libraries of American Samoa, as well as libraries from the remaining US territories. The 2019 survey had a response rate of 97.5%.
Before running my analyses, I filtered both datasets for only library outlets that directly reported their open hours, excluding those where the hours were imputed based on prior years’ data. This reduced the number of outlets in 2023 to 16,927 and the number in 2019 to 17,080. I then performed an inner join on the two sets to include only those that responded in both years. That gave me 15,240 outlets to use for my analysis. Looking through the remaining outlets, there are still some outliers, including outlets that reported zero open hours in a year, and those that reported open hours that would add up to more than 100 hours per week. However, I chose to keep these in my analysis because they were directly reported by the libraries. Looking into a few individual cases, my hypothesis is that some libraries may have reported their open hours as all hours when their online services were available, which in some cases was far beyond the hours the library space was open. I believe this stays relatively consistent with my use of open hours as a proxy for library availability, and therefore should not cause significant skews in my analysis.
Ethical Considerations and Limitations
There are some inherent limitations to working with this dataset. The primary one is that it is a national census that strives to capture data from every public library, which means that the data collected from each is limited. I am going to focus on the survey field for total number of open hours per year, to try to understand how Covid-19 may have affected how accessible American public libraries are for people with varying schedules. However, this field does not communicate which hours libraries are open. It also does not communicate the reasons why open hours may have changed. This is a major limitation of the data.
Another limitation of the data is that both years omit data from Puerto Rico. This means my analysis leaves out a major segment of the American population, and one that has been especially impacted by a lack of government support. Finally, since the data is a census that has to be filled out by each individual library, there is a chance that the responses are skewed towards libraries with the resources to devote time to answering a survey. Despite the high response rates, I cannot confirm whether the libraries that failed to respond represent a biased segment of the population. By filtering for only libraries that directly reported their hours, I may be skewing the data. To respond to this, I tried to use medians in my analysis where possible, which should reduce the effects of outliers. I also aggregated everything to the highest category levels for most of my analysis, to further cushion some of the possible biases that can occur in small samples.
Findings
When I first began this research, I thought I would see a decrease in library open hours from 2019 to 2023. However, the IMLS analysis already showed that overall open hours had mostly bounced back from Covid-19 by 2023. Going into my own data analysis I wanted to understand whether that recovery was distributed equally, or whether it would vary across different data stratifications.
To start, I calculated the change in hours for each individual outlet. I then took a look at overall counts for the outlets that decreased their hours versus those that increased their hours or kept them the same. My finding was that just over half of all library outlets decreased their hours from 2019 to 2023. This suggests that while there were not significant decreases, there was slightly less access to libraries nationwide in 2023 than there had been four years earlier.
Analysis by State
This was backed up by my analysis of library hour changes across states. For every state and territory, I calculated both the average (mean) change in hours from 2019 to 2023, and the median change in hours from 2019 to 2023.
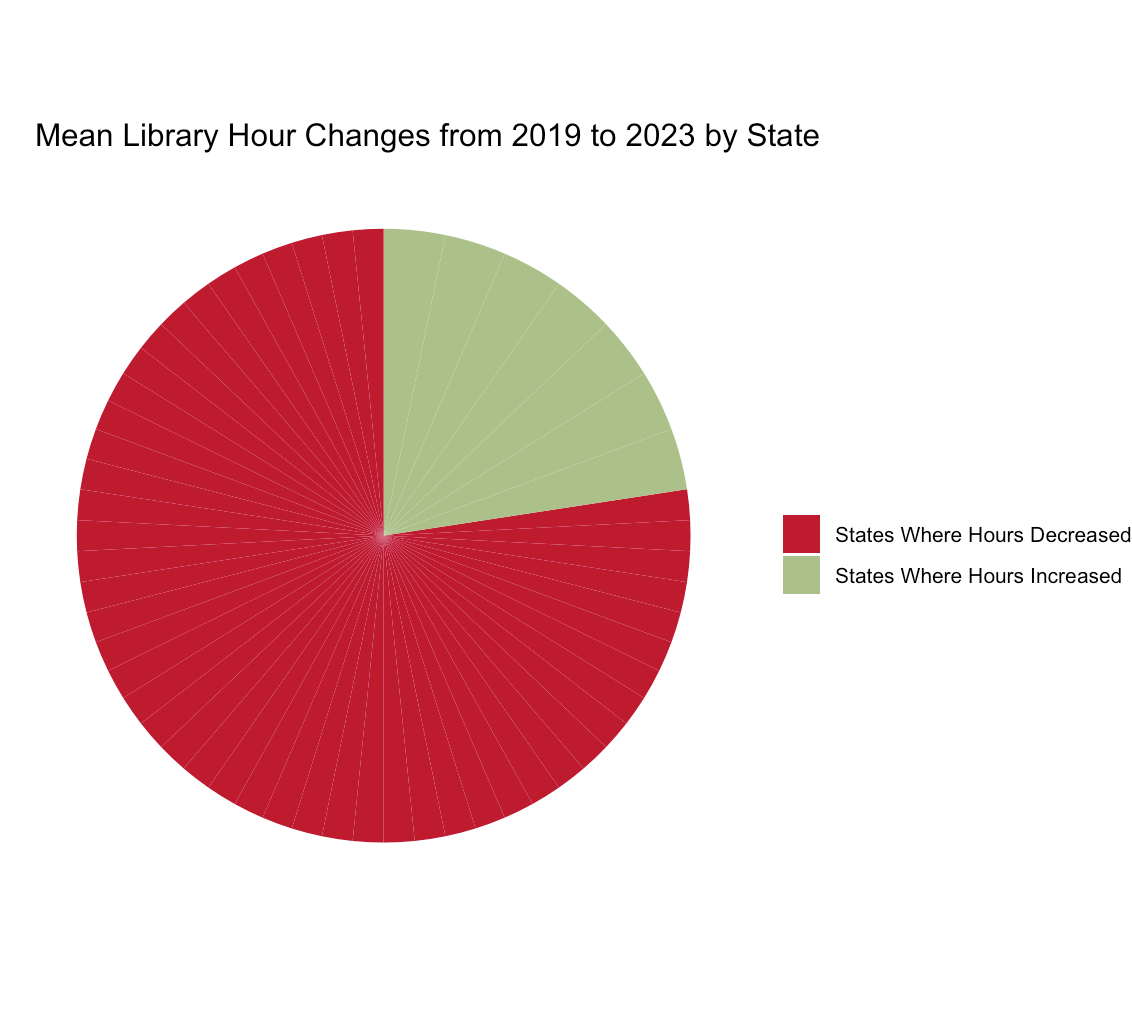
In 87% of states/territories, the average change in hours from 2019 to 2023 was negative, indicating a decrease in hours.
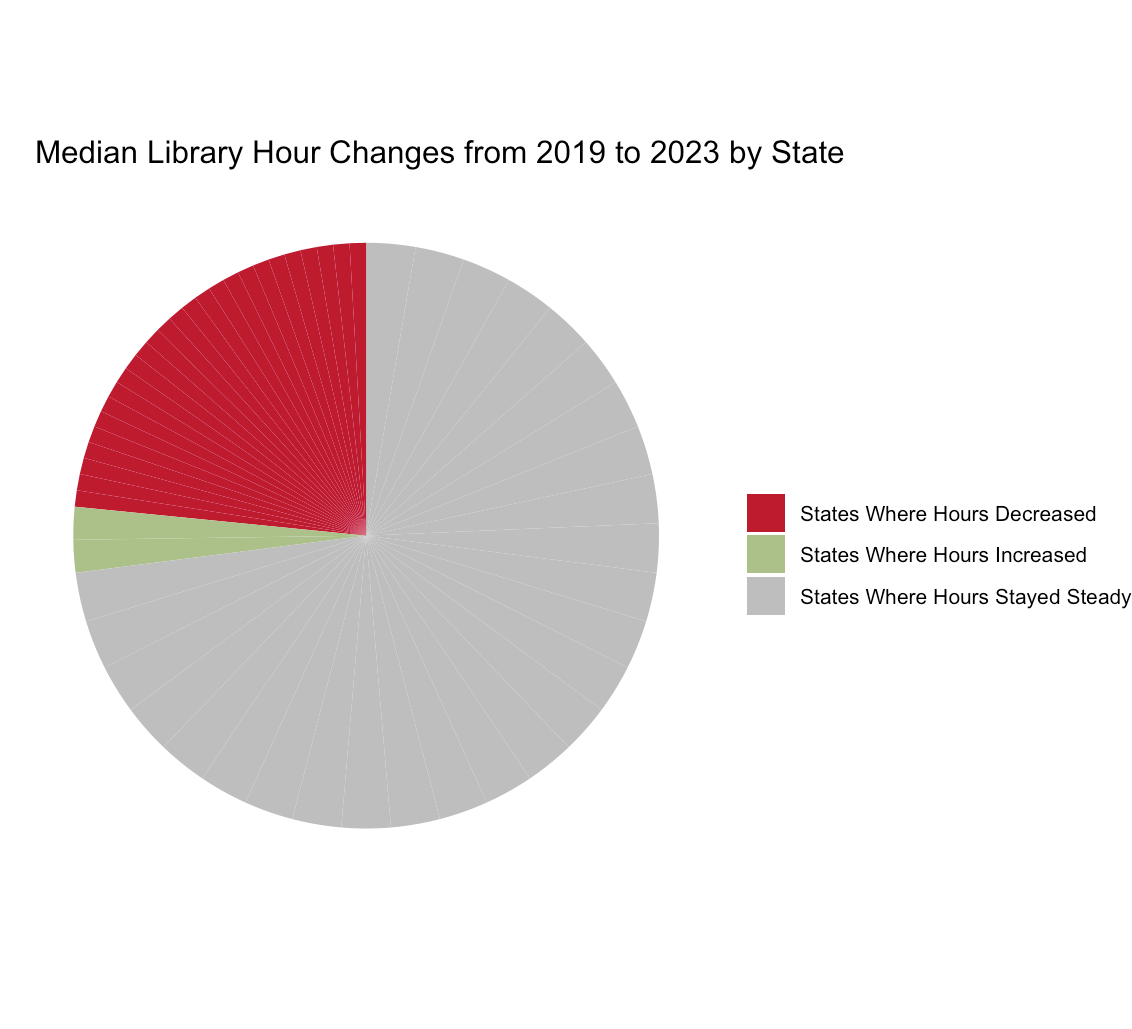
In 49% of states/territories, the median change in open hours across libraries was zero.
Looking at all 55 states and territories included in the data, there were 48 where the average number of hours decreased and only seven where the average number of hours increased. On the other hand, in the plurality of jurisdictions (27 of the 55) the median change in hours was zero, while the median showed a decrease in hours in 26 jurisdictions and an increase in only two.
Comparing these two plots, it’s clear that the trend toward decreased hours was present nationwide, rather than being contained to a few states or territories. However, while that aggregate decrease happened in the majority of jurisdictions, it did not exist in every library. Instead, the median library did not change its hours from 2019 to 2023. The conclusion I draw from this is that our libraries continue to be a strong force nationwide, but not an unbreakable one. At the level of individual libraries, most of them were able to maintain or regain their hours through Covid-19, but that does not mean that access stayed the same. In most jurisdictions, there were outliers where library hours were cut significantly.
I have two separate takeaways from this analysis. On the one hand, the fact that overall open hours nationwide mostly bounced back after Covid-19, and the fact that this stays true when looking at medians across states, shows that public libraries are still receiving support in the majority of municipalities. These statistics imply that, across the country, most libraries found that they were missed during Covid-19-related closures and that the public wanted them to return to their normal hours. This is something librarians should be proud of, and it serves as an answer to those who think libraries are fading away. The reality is that public libraries have fought back against threats at every turn, and continue to thrive.
On the other hand, it is notable that there were negative outliers pulling down the averages in 87% of states and territories. To better understand the causes behind this trend, I looked into how it played out in my home state of Connecticut. In Connecticut, the biggest decrease in hours was at the Central branch of the Hartford Public Library (HPL). The central library was open 1,643 fewer hours in 2023 than in 2019. Looking more deeply into the data, this correlates with a decrease in the number of weeks the library was open. While the HPL was open for all 52 weeks of 2019, it was only open for 26 weeks in 2023. Doing some research, I found that this was caused by a large flood in the building at the end of 2022 that forced the library to close (NBC Coverage). Looking across the other libraries with decreased hours in Connecticut, several (but not most) of them were also closed for more full weeks in 2023 than in 2019, which suggests that there may have been renovations needed at them as well. However, there were still over 100 libraries that decreased their annual hours without changing the number of weeks they were open. This implies that the overall decrease in library hours in Connecticut was spread across libraries and had a variety of causes.
While this conclusion is not the most illuminating, it does point to the fact that as a general rule, library accessibility is slightly decreasing. It also indicates that there is a national trend that nonetheless needs to be handled at a local level. Nationwide, communities value their libraries and libraries are working hardto stay open, but their hours are still decreasing. We need to find the libraries where hours and weeks of availability are being cut the most dramatically and make sure they get the funding they need.
Analysis by Branch Type
In addition to looking at library hour changes by state, I also looked at how library hours changed based on the type of library location. There were three types of library outlets in my filtered dataset: central libraries, branch libraries, and bookmobiles. Across these three categories, I examined how many libraries had an increase in hours, a decrease in hours, and consistent hours from 2019 to 2023. (The plot showing the results is below). The outcome of this analysis was that the proportions were fairly similar across outlet types. There were slightly more hour decreases and slightly fewer hour increases at central libraries than at branch libraries or bookmobiles. There were also slightly more hour decreases at bookmobiles than at branch libraries. My hypothesis is that these differences may come from the fact that, nationally, there are more central libraries than there are branch libraries or bookmobiles. Additionally, in library systems that only have one branch those branches are labeled as central libraries, which means central libraries are likely to be more rural, while branch libraries are definitionally parts of larger systems. Therefore, central libraries are more likely to face the kind of natural disasters or understaffing that might cause a decrease in hours.
However, despite the very different circumstances of central libraries, branch libraries, and bookmobiles, the differences between their rates of hour decreases were surprisingly small. Therefore, my main takeaway here backs up what I found from analyzing states: the trends we’re seeing in library hours are consistent across stratifications of the data. In both different sectors and different locations, library hours decreased slightly from 2019 to 2023.
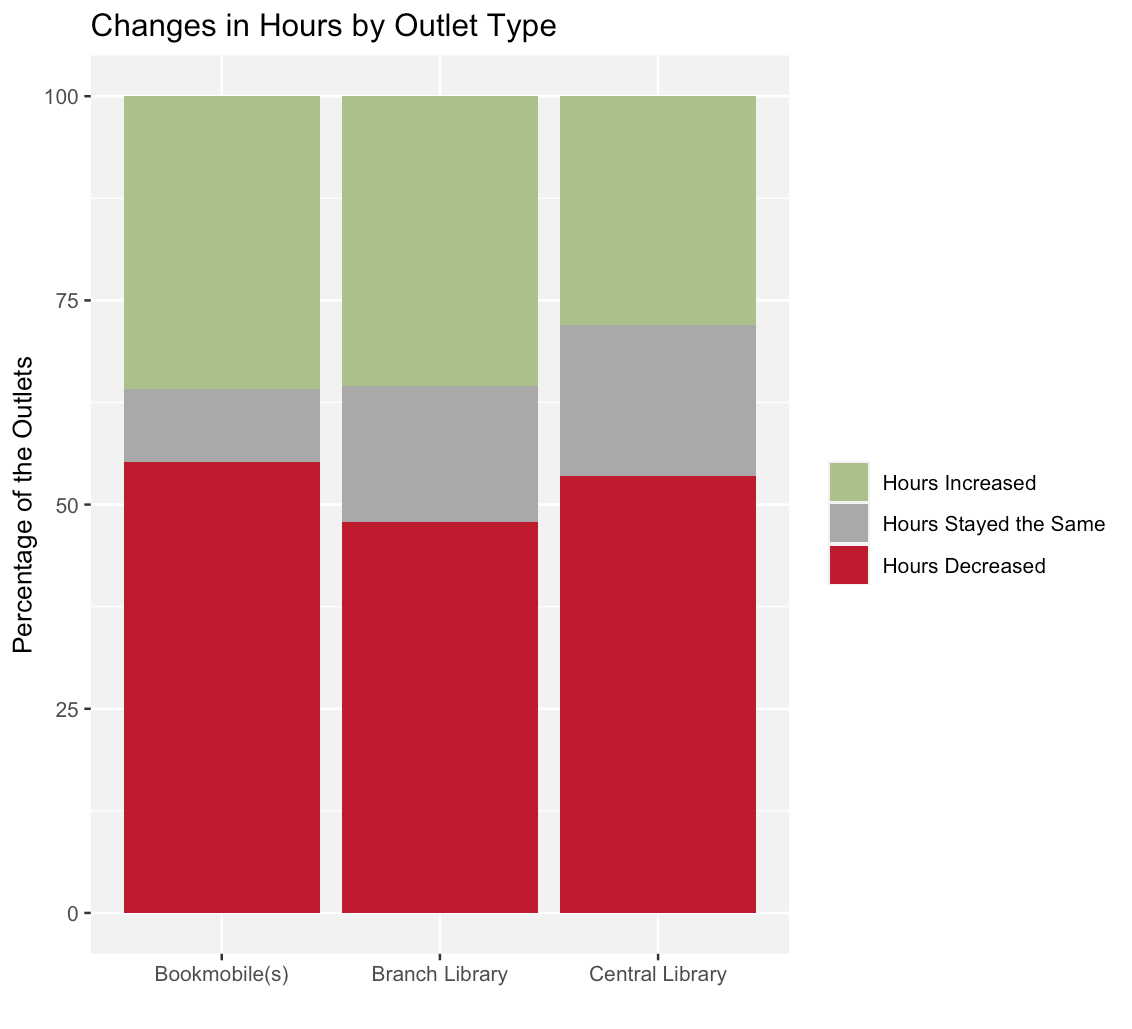
The percentage of outlets that decreased their hours from 2019 to 2023 was relatively consistent across the three types of library outlet locations.
Conclusions
Overall, this analysis gave me a renewed sense of hope for public libraries. Despite the decreases in total library open hours from 2019 to 2023, the median change remained at zero for most states. This shows that nationwide our libraries stayed strong through Covid-19 and continued to provide safe spaces for their communities. At the same time, the aggregated library open hours are ticking down, and not for a single obvious reason. Therefore, we need to keep our attention on our most vulnerable libraries to make sure they are getting the resources needed to stay resilient.
In the future, I hope to continue this work by analyzing how data from more recent years changes these trends. Since the 2023 dataset is the most recent dataset released by the IMLS, it’s not possible yet to see the full arc of recovery from Covid-19 or the impacts of funding cuts from the current administration. I’m interested to see how those changes might affect the datasets for 2024 and 2025.
Additionally, in the future I would like to compare library hours to other community statistics. Given that the IMLS dataset includes census tracts for every library outlet, it would be easy to compare how changes in library hours track with changes in home values or median incomes. However, this work would require examining longer time scales, since Census data points are updated more rarely. For the purpose of this post, I wanted to contain my analysis by delving deeply into this single dataset and this narrow time period, so I did not have the capacity to consider Census data. In the future, I think examining the two datasets together could yield powerful insights.
My biggest takeaway from this analysis is the value of the IMLS surveys. Getting to see trends in public libraries from the aggregated national level all the way down to specific branches is extremely powerful. When we think about the IMLS, it’s easy to focus on funding for libraries and library advocacy. However, the agency’s value as a source of data for understanding library trends is similarly vital and should not be overlooked.
메타데이터
- post_id
- ca5f4753a292
- slug
- public-libraries-are-still-open-to-the-public-but-not-as-often-as-they-used-to-be-ca5f4753a292
- url
- https://medium.com/@hannahcb_98674/public-libraries-are-still-open-to-the-public-but-not-as-often-as-they-used-to-be-ca5f4753a292
- canonical_url
- https://medium.com/@hannahcb_98674/public-libraries-are-still-open-to-the-public-but-not-as-often-as-they-used-to-be-ca5f4753a292
- author_url
- https://medium.com/@hannahcb_98674
- status
- ok
- fetched_at
- 2026-06-13 00:08:42



