Kubernetes in production: monitoring metrics
At the Satellite Applications Catapult we’re once again running an ARD processing campaign in AWS , using Spot Instances. Spotinst’s Ocean…
Kubernetes in production: monitoring metrics
At the Satellite Applications Catapult we’re once again running an ARD processing campaign in AWS EKS, using Spot Instances. Spotinst’s Ocean service for EKS has opportunistically chosen an EC2 “m5.large” instance for our current load. However, since the Spotinst Web UI is not (yet) collecting metrics for custom namespaces, I decided to use Metrics-Server and Prometheus to query such metrics, so that we can get a good feel of resource utilization.
Monitoring Resource Metrics with Metrics-Server
Metrics-server allows users to query resource metrics using kubectl right from the command line. Its installation is pretty straightforward:
git clone https://github.com/kubernetes-incubator/metrics-server.gitkubectl apply -f metrics-server/deploy/1.8+/Now we can query resource metrics using kubectl from the command line. It makes sense to start by getting the CPU and memory usage for individual nodes:
kubectl top nodeNAME CPU(cores) CPU% MEMORY(bytes) MEMORY%
ip-192-168-167-86.eu-west-2.compute.internal 1998m 99% 3163Mi 41%We can then have a look at resource usage per pod within our ARD processing namespace:
kubectl top pod --namespace=$NAMESPACE --containersPOD NAME CPU(cores) MEMORY(bytes)
redis-master-0 redis 4m 4Mi
s2job-ard-campaign-worker-bgfv4 ard-campaign 634m 1014Mi
s2job-ard-campaign-worker-sp4p8 ard-campaign 593m 979Mi
s2job-ard-campaign-worker-vbw9s ard-campaign 617m 979MiWe can also get metrics in a raw format, e.g.:
kubectl get --raw "/apis/metrics.k8s.io/v1beta1/nodes" | jq .{
"kind": "NodeMetricsList",
"apiVersion": "metrics.k8s.io/v1beta1",
"metadata": {
"selfLink": "/apis/metrics.k8s.io/v1beta1/nodes"
},
"items": [
{
"metadata": {
"name": "ip-192-168-167-86.eu-west-2.compute.internal",
"selfLink": "/apis/metrics.k8s.io/v1beta1/nodes/ip-192-168-167-86.eu-west-2.compute.internal",
"creationTimestamp": "2019-09-17T17:41:46Z"
},
"timestamp": "2019-09-17T17:41:37Z",
"window": "30s",
"usage": {
"cpu": "1995335854n",
"memory": "3546020Ki"
}
}
]
}Monitoring Resource Metrics with Prometheus
Prometheus has become a favorite resource monitoring tool among DevOps. We can install it using Helm and the Prometheus Operator. The Prometheus Operator is a Kubernetes-specific project that makes it simple to set up and configure Prometheus for Kubernetes clusters. We can install the Prometheus Operator with:
helm install --name prometheus stable/prometheus-operator \
  --namespace monitoring
Once the Prometheus Operator is installed, we can forward requests to the Prometheus server pod from our local machine:
kubectl port-forward -n monitoring \
  prometheus-prometheus-prometheus-oper-prometheus-0 9090:9090
Access to the Prometheus dashboard is possible by navigating to http://127.0.0.1:9090. However, if you run kubectl within a Linux installation without a Desktop as I do, then you have no use for this port forwarding as it is.
If you run CentOS 7 or similar, you can forward traffic from a physical network interface to the loopback one with e.g.:
sudo firewall-cmd --permanent --direct \
  --add-rule ipv4 nat OUTPUT 0 -p tcp -o lo \
  --dport 9090 -j REDIRECT --to-ports 9090
sudo firewall-cmd --zone=public --add-port=9090/tcp --permanentsudo firewall-cmd --reloadsudo sysctl -w net.ipv4.conf.eno16780032.route_localnet=1In the above example “eno16780032” is the physical network interface I access my server through: replace it as appropriate for your setup.
For Ubuntu or similar, the above would be accomplished with e.g.:
sudo iptables -t nat -I PREROUTING -p tcp -d 10.21.12.10/24 --dport 9090 -j DNAT --to-destination 127.0.0.1:9090sudo iptables -A INPUT -p tcp --dport 9090 -m comment --comment "Prometheus dashboard" -j ACCEPTsudo sysctl -w net.ipv4.conf.ens192.route_localnet=1After the above redirection is in place, I am able to access the dashboard by navigating to http://10.21.12.10:9090, 10.21.12.10 being the IP address of the server where I installed and configured kubectl for interacting with my EKS cluster. Note: this is also a convenient route into your cluster’s VPC from within your intranet, that removes the need to reserve, and pay for, a public IP address with AWS. Such route is only recommended for lightweight traffic to a management dashboard or similar!
I won’t provide a comprehensive set of metrics that I am looking at, but as the top command is showing that memory utilization on our Kubernetes node is quite high on average, let’s have a look at how it changes over time:
sum(container_memory_usage_bytes{container_name!=""}) / :node_memory_MemTotal_bytes:sum * 100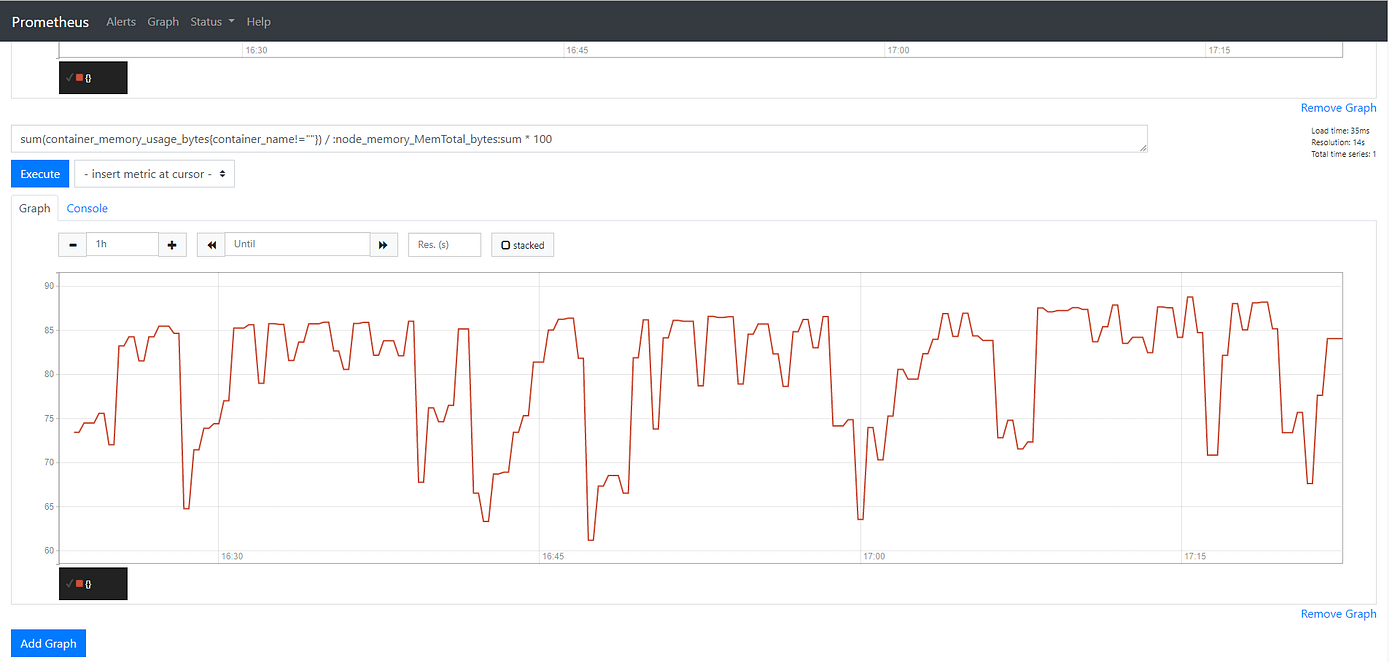
Memory usage for all Pods within the Kubernetes cluster
The following query confirms that the bulk of memory utilization is claimed by the ARD processing campaign:
sum(container_memory_usage_bytes{container_name="ard-campaign"}) / :node_memory_MemTotal_bytes:sum * 100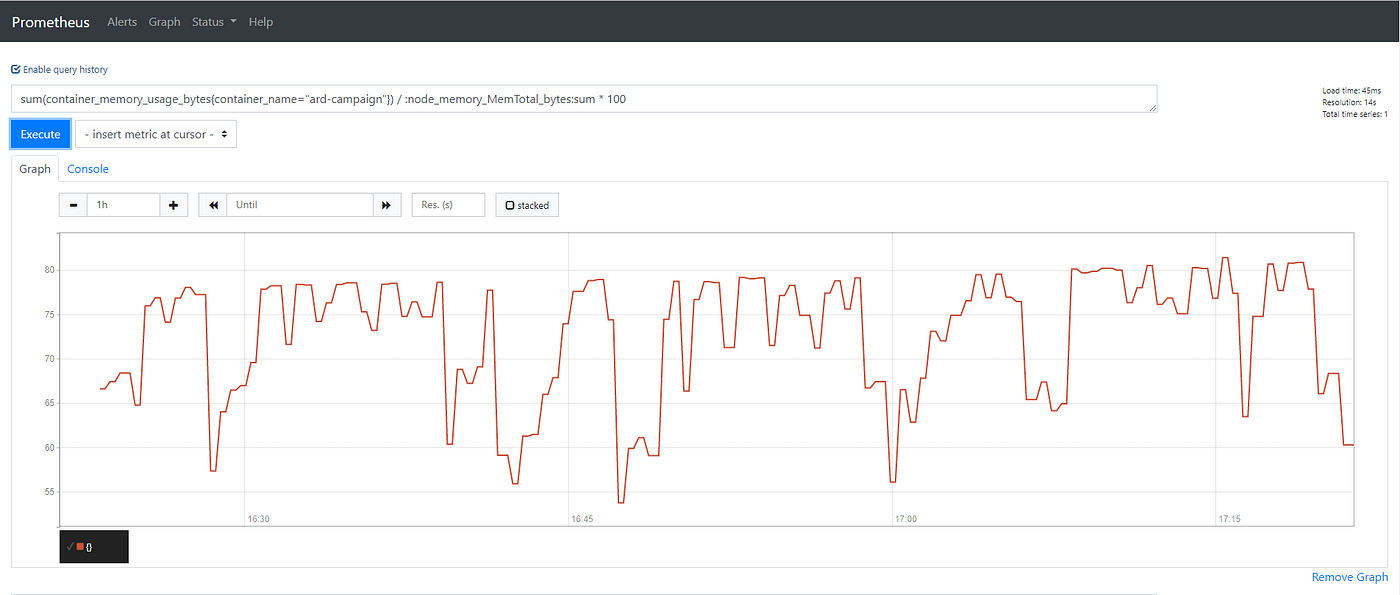
Memory usage for Pods part of the ard-campaign
Conclusions
Monitoring Kubernetes is important in the context of resource utilization and cost control. Kubernetes’ Metrics-Server and Prometheus are a quite comprehensive set of tools for monitoring clusters and getting useful insights.
메타데이터
- post_id
- cb7ae4e40b4f
- slug
- kubernetes-in-production-monitoring-metrics-cb7ae4e40b4f
- url
- https://medium.com/@luigidifraia/kubernetes-in-production-monitoring-metrics-cb7ae4e40b4f
- canonical_url
- https://medium.com/@luigidifraia/kubernetes-in-production-monitoring-metrics-cb7ae4e40b4f
- author_url
- https://medium.com/@luigidifraia
- status
- ok
- fetched_at
- 2026-07-27 13:52:01