Your Spark Tests Aren’t Flaky. They’re Starving.
A wall of ConnectionRefusedError in CI, one real OOM, and two lines that fixed it. Here’s the debugging chain that led there.
Your Spark Tests Aren’t Flaky. They’re Starving.
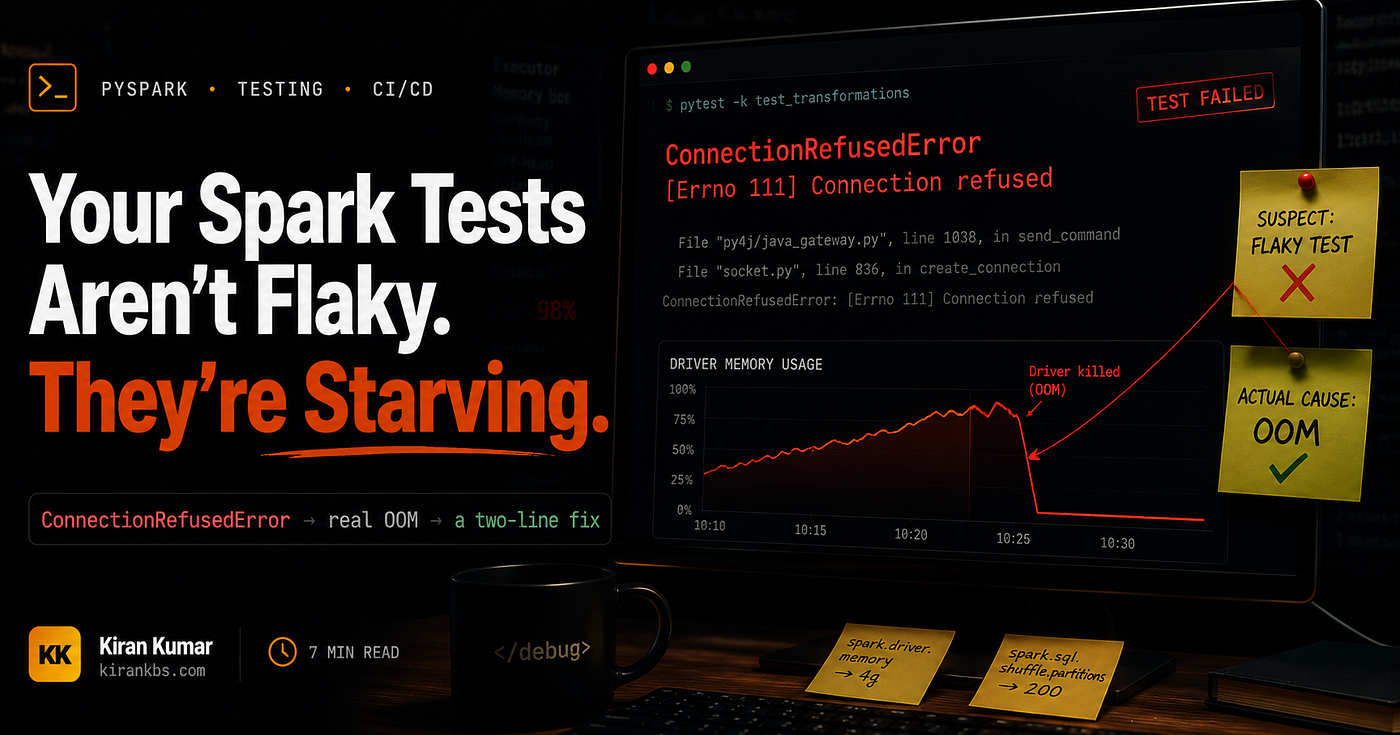
A wall of ConnectionRefusedError in CI, one real OOM, and two lines that fixed it. Here’s the debugging chain that led there.
If you’ve ever stared at a CI log full of ConnectionRefusedError and Not enough memory to build and broadcast the table, only to run the same tests on your laptop and watch them pass — this post is for you.
Real debugging session. Two sneaky Spark memory issues are hiding in a perfectly reasonable test setup. No hand-waving. Just the chain of events, why it happens, and the fix.
The symptom: a cascade of failures
CI runs your PySpark test suite inside a container. You see something like this:
FAILED test_streaming_pipeline - SparkException: Not enough memory to build
 and broadcast the table to all worker nodes.
FAILED test_data_quality_checks - ConnectionRefusedError: [Errno 111]
ERROR test_aggregation_pipeline - ConnectionRefusedError: [Errno 111]
ERROR test_feature_extraction - ConnectionRefusedError: [Errno 111]
ERROR test_model_inference - ConnectionRefusedError: [Errno 111]
…12 more errors…
One “real” failure. Then a wall of ConnectionRefusedError.
Your first instinct: “Twelve tests broke? What did I change?” But you changed nothing in those tests. They were passing yesterday.
The turning point came when we noticed the failure wasn’t random. The same test was failing first every time.
Not the same group of tests. Not the same module. The exact same test.
That’s usually a sign you’re not dealing with flaky behavior at all. Flaky tests tend to fail in different places across runs. Deterministic failures that trigger a cascade of secondary errors usually point to a shared resource being corrupted or exhausted.
In our case, the shared resource was the Spark JVM itself.
The insight: one crash kills everything
PySpark in local mode — your driver IS the JVM. There’s no separate cluster. When Spark runs out of memory trying to broadcast a table, it doesn’t just fail that one query. It crashes the entire JVM process.
Every subsequent test that tries to talk to Spark gets ConnectionRefusedError because there’s no JVM left to connect to.
So 12 “failures” are actually 1 failure + 11 corpses.
The first thing to do when you see a wall of ConnectionRefusedError in your Spark test suite: scroll up and find the one test that actually OOM’d. Everything after it is collateral damage.
The setup that creates this problem
Most PySpark test suites use a pattern like this:
python
@pytest.fixture(scope="session")
def session_spark(tmp_path_factory):
 """One SparkSession for the entire test run"""
 spark = (
 SparkSession.builder
 .master("local[*]")
 .config("spark.sql.extensions", "io.delta.sql.DeltaSparkSessionExtension")
 .appName("tests")
 .getOrCreate()
 )
 return spark
@pytest.fixture(scope="function")
def spark(session_spark):
 """Per-test cleanup: drop tables, clean artifacts"""
 for table in session_spark.catalog.listTables():
 session_spark.sql(f"DROP TABLE {table.name}")
yield session_spark
for table in session_spark.catalog.listTables():
 session_spark.sql(f"DROP TABLE {table.name}")
Sensible. SparkSession creation is expensive (5–10 seconds), so you share one across the session. The function-scoped fixture handles per-test cleanup.
Two hidden problems.
Problem 1: No one sets spark.driver.memory
When you don’t set spark.driver.memory, PySpark defaults to 1GB in local mode.
On your dev machine with 16–32GB RAM, this is fine — the JVM can usually squeeze through, and your complex query plans just barely fit.
In a CI container? Memory is often capped at 2–4GB total, shared between the OS, Python, and the JVM. That 1GB default becomes a hard ceiling. Spark’s Adaptive Query Execution will happily try to broadcast a table that doesn’t fit.
The fix is embarrassingly simple:
python
spark = (
 SparkSession.builder
 .master("local[*]")
 .config("spark.driver.memory", "2g") # Don't rely on the 1g default
 .getOrCreate()
)
But wait — if your tests were passing for months with 1GB, why did they suddenly start failing?
Problem 2: the cache leak you didn’t know about
Somewhere in your codebase, a workflow does something like:
python
intermediate_result = expensive_computation(input_data)
persisted = intermediate_result.persist() # Cache for reuse
output_table.append(persisted)
final_result = another_computation(persisted)
final_table.append(final_result)
…but never calls persisted.unpersist()
Fine in production — each job runs in its own Spark application, and cached data dies with it.
In your test suite? All tests share the same session-scoped SparkSession. That persist() call pins data in the JVM heap memory. Your per-test cleanup drops tables — but it never releases cached DataFrames.
# What your fixture does
for table in spark.catalog.listTables():
 spark.sql(f"DROP TABLE {table.name}") # ✅ Cleans tables
# What your fixture DOESN'T do
spark.catalog.clearCache() # ❌ Never releases persisted DataFrames
Test by test, your JVM heap fills up with zombie DataFrames. Test A persists 50MB. Test B persists another 80MB. By test C, there’s not enough heap left for a broadcast join.
Why does AQE make this worse
Adaptive Query Execution is great in production. It observes actual data sizes at runtime and picks optimal join strategies — including converting sort-merge joins to broadcast hash joins when one side is small enough.
But “small enough” is relative to available memory. When your JVM heap is 1GB and half of it is eaten by zombie cached DataFrames, AQE’s broadcast decision is based on data size, not available heap. It sees a 40MB table and thinks “easy broadcast!” — but there’s only 200MB of free heap left after caching overhead and GC pressure.
Boom. Not enough memory to build and broadcast the table to all worker nodes.
The cruelest part: the table it’s trying to broadcast might be tiny — sometimes a few KB lookup. It’s not the broadcast data that’s the problem. It’s heap fragmentation from cached DataFrames that don’t leave enough contiguous memory for the broadcast buffer.
The full fix: two lines
@pytest.fixture(scope="session")
def session_spark(tmp_path_factory):
 spark = (
 SparkSession.builder
 .master("local[*]")
 .config("spark.driver.memory", "2g") # Fix 1: Don't rely on 1g default
 .getOrCreate()
 )
 return spark
@pytest.fixture(scope="function")
def spark(session_spark):
 yield session_spark
 session_spark.catalog.clearCache() # Fix 2: Release cached DataFrames
 for table in session_spark.catalog.listTables():
 session_spark.sql(f"DROP TABLE {table.name}")
That’s it.
The debugging checklist
Next time your Spark CI goes red with a wall of errors:
Step 1: Ignore the ConnectionRefusedError tests. Find the FIRST failure — that’s your actual problem.
Step 2: Check if spark.driver.memory is explicitly set in your test SparkSession. If not, you’re running on 1GB.
Step 3: Search your codebase for .persist() and .cache() calls. For each one, check if there’s a corresponding .unpersist(). In production, this doesn’t matter. In tests with a shared SparkSession, it’s a memory leak.
Step 4: Check if your test fixture calls spark.catalog.clearCache() between tests.
Step 5: If you’re still hitting OOM after the above, you have a genuinely memory-hungry query plan. Disable broadcast joins entirely in your test config:
.config("spark.sql.autoBroadcastJoinThreshold", -1)This forces sort-merge joins everywhere — slower, but no broadcast buffer allocation. Your tests will take a bit longer. They won’t OOM.
A few Spark testing smells are worth watching for:
- Session-scoped SparkSession with no cache cleanup
- Uses persist() or cache() without matching unpersist()
- No explicit spark.driver.memory setting
- Broadcast joins enabled against large test fixtures
- Test datasets copied directly from production
- ConnectionRefusedError appearing after another SparkException
None of these guarantee a problem. But seeing several together should immediately put memory pressure on your debugging checklist.
The bigger mismatch
Production Spark has a 16GB driver, dedicated executors, and per-job isolation. Your test suite has a 1GB driver, no executors (local mode), and a shared JVM that accumulates state across hundreds of tests.
Treat your test SparkSession configuration as a first-class concern:
- Set memory explicitly. Don’t assume defaults transfer from your laptop.
- Clean up aggressively. Tables, views, cached DataFrames, and temp directories.
- Understand what’s shared. Session-scoped fixtures share JVM state — that’s the point, but leaks compound across the whole run.
Your Spark tests aren’t flaky. They’re starving.%
메타데이터
- post_id
- cbaaa4de9488
- slug
- your-spark-tests-arent-flaky-they-re-starving-cbaaa4de9488
- url
- https://medium.com/towards-data-engineering/your-spark-tests-arent-flaky-they-re-starving-cbaaa4de9488
- canonical_url
- https://medium.com/towards-data-engineering/your-spark-tests-arent-flaky-they-re-starving-cbaaa4de9488
- author_url
- https://medium.com/@kirankbs
- status
- ok
- fetched_at
- 2026-06-15 20:49:13