Mastering t-Tests in Statistics and Python: One-Sample, Independent, and Paired t-Tests Explained
Learn what a t-test is, when to use it, and how to perform one-sample, independent, and paired t-tests using Python.
Mastering t-Tests in Statistics and Python: One-Sample, Independent, and Paired t-Tests Explained
Learn what a t-test is, when to use it, and how to perform one-sample, independent, and paired t-tests using Python.
Introduction
Imagine you’re working as a data analyst in a hospital. A doctor asks you a simple question:
“Did our new medication actually reduce patients’ blood pressure, or was the improvement simply due to chance?”
Or perhaps you’re a marketing analyst who wants to know whether a new advertising campaign generated higher customer spending than the previous campaign.
Maybe you’re an education researcher trying to determine whether students performed better after attending a tutoring program.
Although these questions come from different industries, they all have one thing in common: they require comparing averages to determine whether an observed difference is statistically significant.
This is where the t-test becomes one of the most valuable tools in statistics and data science.
The t-test helps us determine whether differences between sample means are likely to reflect genuine differences in the population or whether they are simply the result of random sampling variation. It is one of the first statistical tests every aspiring data scientist should master because it forms the foundation for more advanced techniques such as ANOVA, regression analysis, and machine learning model evaluation.
What Is a t-Test?
A t-test is a statistical hypothesis test used to compare means.
Its primary purpose is to determine whether an observed difference between averages is statistically significant or whether it could have occurred purely by chance.
Suppose the national average Mathematics score is 70, but a class of students scores an average of 74.
Should we conclude that this class is genuinely better than average?
Not necessarily.
Sample averages naturally vary because of random sampling. Even if the true population mean is exactly 70, some randomly selected classes will score slightly above or below that value.
A t-test helps us answer an important question:
Is the observed difference large enough that it is unlikely to have happened by chance?
If the answer is yes, we reject the null hypothesis. If not, we conclude that there isn’t enough evidence to support a real difference.
Why Are t-Tests Important?
T-tests are among the most widely used statistical techniques because they allow researchers and analysts to make evidence-based decisions.
They are used in almost every industry.
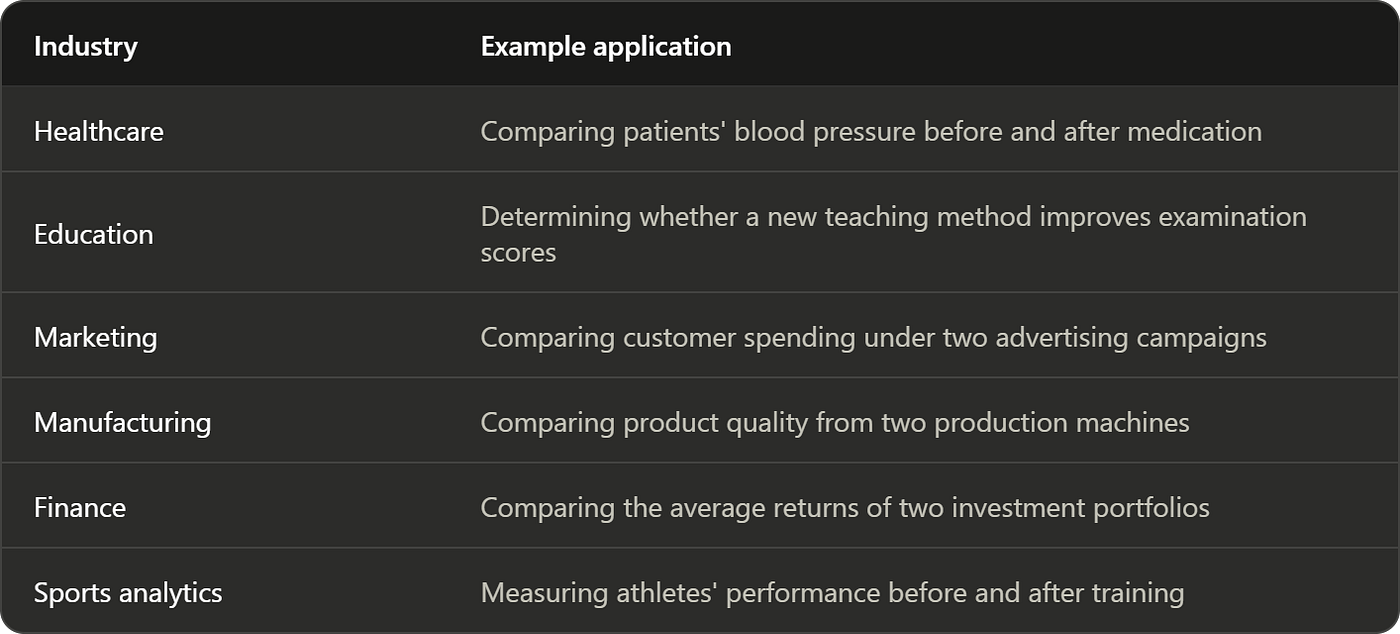
Without statistical testing, we might make decisions based solely on random fluctuations in the data.
Understanding Hypothesis Testing
Before learning the different types of t-tests, it’s important to understand hypothesis testing, which provides the framework for all statistical inference.
Every t-test begins with two competing hypotheses.
Null Hypothesis (H₀)
The null hypothesis assumes that no significant difference exists.
For example:
- The average score is equal to 70.
- Boys and girls have the same average Mathematics score.
- Students’ scores did not improve after tutoring.
The null hypothesis always represents the idea that nothing has changed.
Alternative Hypothesis (H₁)
The alternative hypothesis states that a significant difference does exist.
Examples include:
- The average score differs from 70.
- Boys and girls have different average Mathematics scores.
- Students improved after tutoring.
The goal of a t-test is to determine whether there is enough evidence to reject the null hypothesis in favor of the alternative hypothesis.
Understanding the p-Value
The p-value is one of the most misunderstood concepts in statistics.
A p-value measures how likely it would be to observe results at least as extreme as those in your sample if the null hypothesis were true.
Most researchers use a significance level (α) of 0.05.
The decision rule is simple:
- If p < 0.05, reject the null hypothesis.
- If p ≥ 0.05, fail to reject the null hypothesis.
Notice the wording carefully.
We say “fail to reject the null hypothesis”, not “accept the null hypothesis.”
A non-significant result does not prove that the null hypothesis is true. It simply means the available evidence is not strong enough to reject it.
The Three Types of t-Tests
Although all t-tests compare means, they are used in different situations.
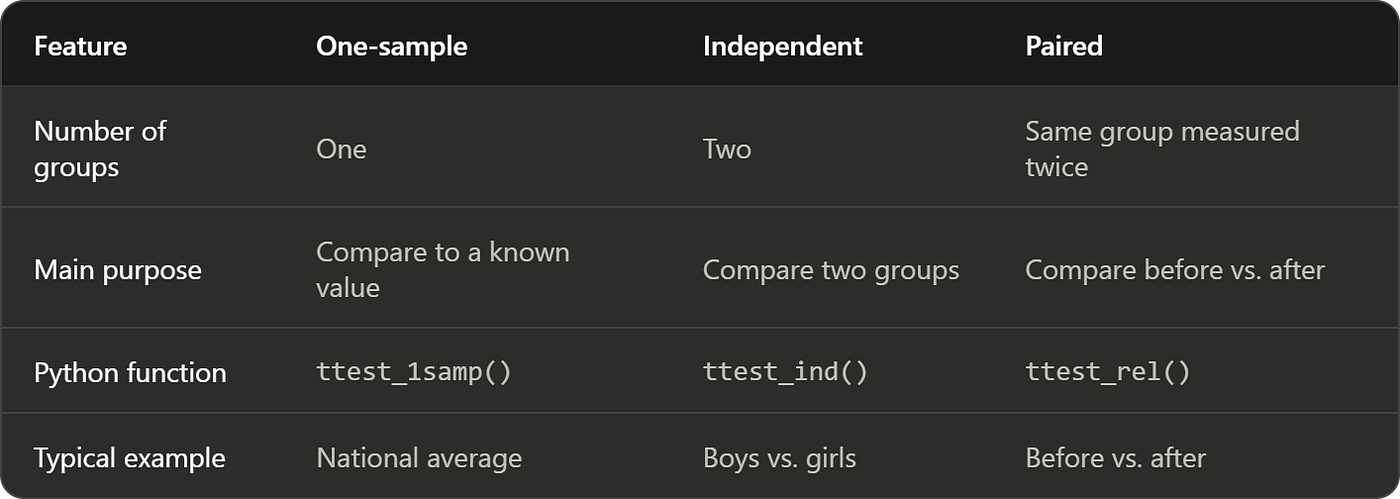
One-Sample t-Test: Compare one sample mean with a known population mean. Is the average exam score different from the national average?
Independent Samples t-Test: Compare the means of two independent groups. Do boys and girls perform differently in Mathematics?
Paired Samples t-Test: Compare two related measurements from the same individuals. Did students improve after tutoring?
Let’s examine each one in detail.
1. One-Sample t-Test
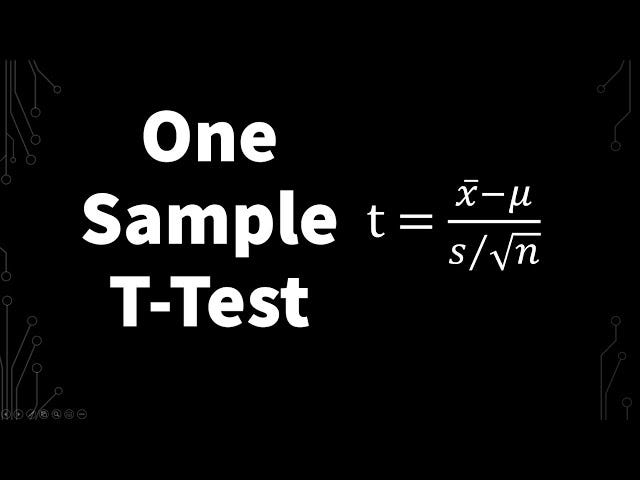
What Is a One-Sample t-Test?
A One-Sample t-Test compares the average of a single sample with a known or hypothesized population mean.
It answers questions such as:
- Is the average customer satisfaction score different from 80?
- Is the average employee salary different from the industry average?
- Is the average examination score different from the national average?
When Should You Use It?
Use a One-Sample t-Test when:
- You have one sample.
- You know the population mean or a target value.
- Your data are continuous.
Real-Life Example
A school wants to determine whether its students perform differently from the national average of 70 marks in Mathematics.
Five students are randomly selected.
Student: 1, 2,3,4,5
Score: 72, 75, 68, 74, 71
import numpy as np
from scipy.stats import ttest_1samp

# Mathematics scores
scores = np.array([72, 75, 68, 74, 71])

# National average
population_mean = 70

# Perform the One-Sample t-Test
t_statistic, p_value = ttest_1samp(scores, popmean=population_mean)

print(f"Sample Mean: {scores.mean():.2f}")
print(f"T-statistic: {t_statistic:.3f}")
print(f"P-value: {p_value:.3f}")
Expected Output
Sample Mean: 72.00
T-statistic: 1.633
P-value: 0.178
Interpretation
The sample mean is 72, while the national average is 70.
Although the sample scored slightly higher, the p-value is 0.178, which is greater than the significance level of 0.05.
Therefore, we fail to reject the null hypothesis.
This means that there is insufficient statistical evidence to conclude that the class performs differently from the national average.
The difference of two marks could simply be due to random sampling variation rather than a genuine difference in performance.
2. Independent Samples t-Test (Two- Sample t-Test)
What Is an Independent Samples t-Test?
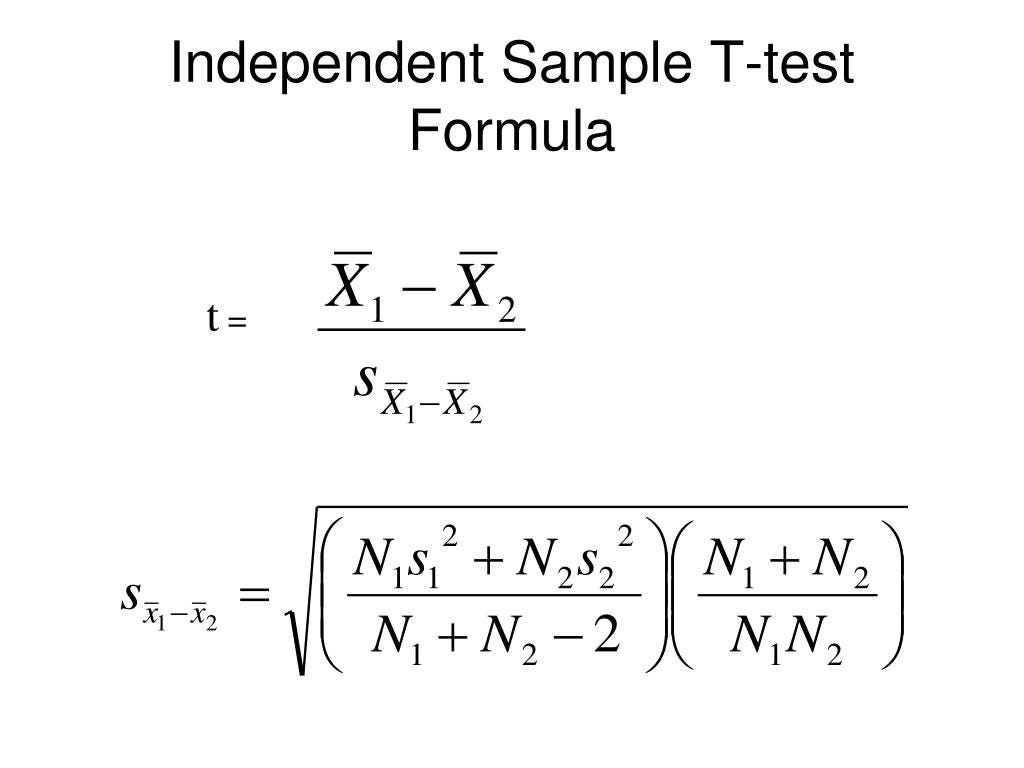
An Independent Samples t-Test (also called a Two-Sample t-Test) is used to determine whether the average values of two independent groups differ significantly.
Unlike the One-Sample t-Test, which compares a sample against a known value, the Independent Samples t-Test compares two separate groups of observations.
Think of it as answering questions like:
- Do boys and girls perform differently in Mathematics?
- Does Drug A lower blood pressure more effectively than Drug B?
- Do customers exposed to Advertisement A spend more than those exposed to Advertisement B?
In each case, every observation belongs to only one group.
When Should You Use an Independent Samples t-Test?
Use this test when:
- You have two independent groups.
- The outcome variable is numerical (continuous).
- Each observation belongs to only one group.
- You want to compare the average values of the two groups.
Typical applications include:

Real-Life Example
A school wants to investigate whether boys and girls perform differently in Mathematics.
Five students are randomly selected from each group.
Boys: 78,72,69,75,81
Girls: 84,86,90,88,91
The research question is:
Is there a statistically significant difference between the average Mathematics scores of boys and girls?
import numpy as np
from scipy.stats import ttest_ind

# Mathematics scores
boys = np.array([78, 72, 69, 75, 81])
girls = np.array([84, 86, 90, 88, 91])

# Perform Independent Samples t-Test
t_statistic, p_value = ttest_ind(
    boys,
    girls,
    equal_var=True
)

print(f"Boys Mean: {boys.mean():.2f}")
print(f"Girls Mean: {girls.mean():.2f}")
print(f"T-statistic: {t_statistic:.3f}")
print(f"P-value: {p_value:.4f}")
Expected Output
Boys Mean: 75.00
Girls Mean: 87.80
T-statistic: -5.164
P-value: 0.0009
Interpretation
The average score for boys is:
75.0
The average score for girls is:
87.8
Girls scored approximately 12.8 marks higher than boys.
The p-value is:
0.0009
Since
0.0009 < 0.05
we reject the null hypothesis.
This provides strong statistical evidence that the average Mathematics scores differ between boys and girls.
Visualizing the Results
Visualizations make statistical results easier to understand.
import matplotlib.pyplot as plt

plt.boxplot(
    [boys, girls],
    tick_labels=["Boys", "Girls"]
)

plt.title("Mathematics Scores")

plt.ylabel("Score")

plt.show()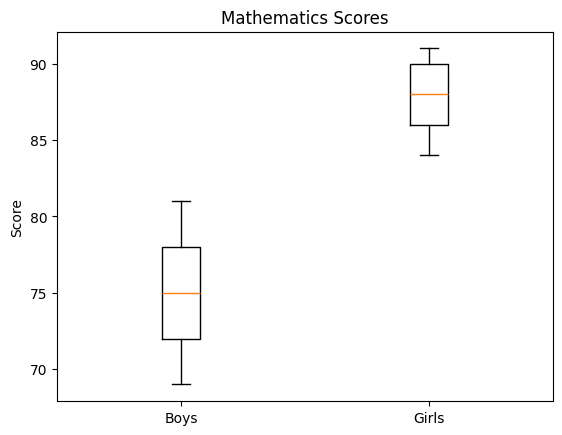
The boxplot clearly shows that the girls’ scores are consistently higher than the boys’ scores.
However, visual differences alone are not enough. The Independent Samples t-Test confirms that the observed difference is statistically significant.
3. Paired Samples t-Test
What Is a Paired Samples t-Test?
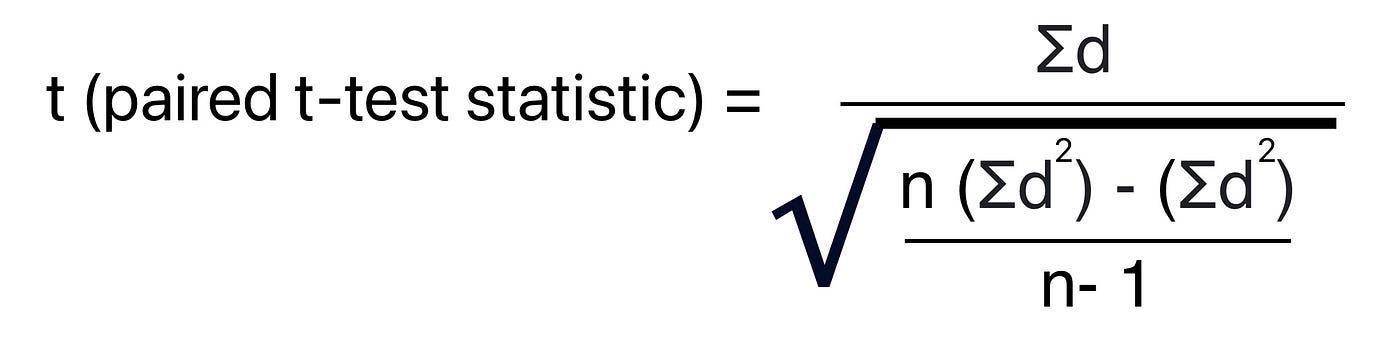
A Paired Samples t-Test (also called a Dependent Samples t-Test) is used when the same individuals are measured twice.
Rather than comparing two independent groups, this test measures whether the average change within individuals is statistically significant.
It is commonly used in:
- Before-and-after studies
- Medical treatment evaluations
- Employee training assessments
- Student performance evaluations
When Should You Use a Paired Samples t-Test?
Use this test when:
- The same individuals are measured twice.
- Each observation has a matching observation.
- The outcome variable is numerical.
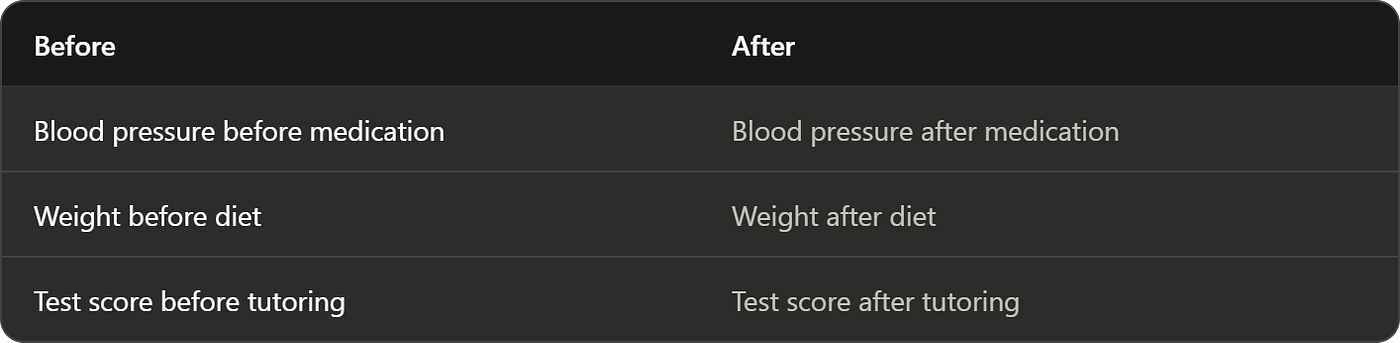
Examples include:
Real-Life Example
A teacher introduces a new tutoring program.
Five students take the same Mathematics examination before and after attending the program.

Research Question:
Did students improve after completing the tutoring program?
Python Implementation
import numpy as np
from scipy.stats import ttest_rel

before = np.array([60,55,70,65,58])

after = np.array([68,62,75,70,66])

t_statistic, p_value = ttest_rel(after, before)

print(f"Average Before: {before.mean():.2f}")
print(f"Average After: {after.mean():.2f}")
print(f"T-statistic: {t_statistic:.3f}")
print(f"P-value: {p_value:.4f}")
Expected Output
Average Before: 61.60
Average After: 68.20
T-statistic: 9.710
P-value: 0.0006
Understanding the Code
The ttest_rel() function compares paired observations.
Unlike the Independent Samples t-Test, it does not compare two unrelated groups.
Instead, it calculates the difference between each student’s “Before” and “After” scores and tests whether the average difference is significantly different from zero.
Interpretation
Students scored:
61.6 before tutoring.
After tutoring, they scored:
68.2
The average improvement was approximately:
6.6 marks
The p-value is:
0.0006
Since
0.0006 < 0.05
we reject the null hypothesis.
The tutoring program produced a statistically significant improvement in student performance.
Visualizing Before-and-After Scores
One of the best ways to visualize paired data is with a line chart.
import matplotlib.pyplot as plt

students = ["S1","S2","S3","S4","S5"]

plt.plot(
    students,
    before,
    marker="o",
    label="Before"
)

plt.plot(
    students,
    after,
    marker="o",
    label="After"
)

plt.title("Student Scores Before and After Tutoring")

plt.xlabel("Student")

plt.ylabel("Score")

plt.legend()

plt.show()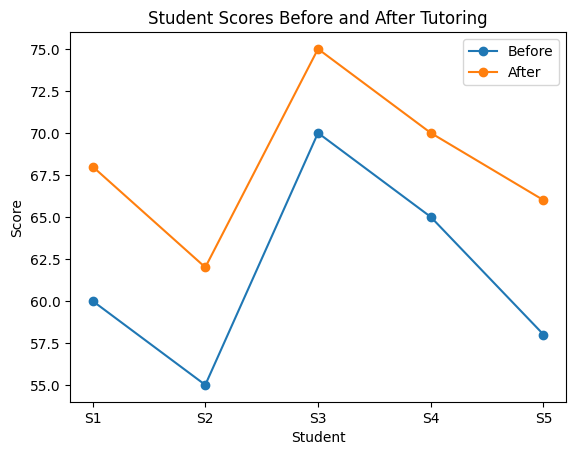
Notice that every student’s score increased after tutoring.
The visualization provides an intuitive understanding of the improvement, while the Paired Samples t-Test confirms that the improvement is statistically significant.
Key Differences Between the Three t-Tests
Choosing the Right t-Test
One of the biggest challenges for beginners is deciding which t-test to use. Fortunately, the choice becomes straightforward if you ask a few simple questions about your data.
Start by asking:
Do you have only one sample?
If yes, and you’re comparing its average with a known or hypothesized population mean, use a One-Sample t-Test.
Example:
Is the average Mathematics score of my class different from the national average of 70?
Are you comparing two different groups?
If yes, ask another question:
Are the groups independent?
If each observation belongs to only one group, use an Independent Samples t-Test.
Examples:
- Boys vs. Girls
- Drug A vs. Drug B
- Machine A vs. Machine B
- Online Learning vs. Classroom Learning
Are the same people measured twice?
If you’re comparing before-and-after measurements or repeated observations from the same individuals, use a Paired Samples t-Test.
Examples:
- Blood pressure before and after medication
- Student scores before and after tutoring
- Employee productivity before and after training
- Weight before and after a diet program
A Quick Decision Table
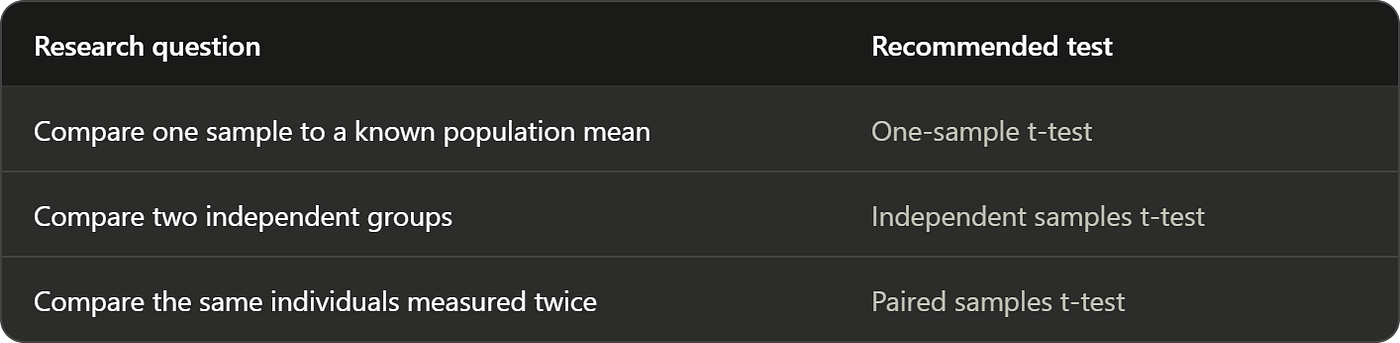
When in doubt, ask yourself one simple question:
“Are these observations independent, or are they paired?”
The answer usually determines the correct test.
Assumptions of a t-Test
Like all statistical methods, t-tests rely on several assumptions. Checking these assumptions helps ensure that your conclusions are reliable.
1. Continuous Data
The variable being analyzed should be numerical.
Examples include:
- Examination scores
- Salaries
- Blood pressure
- Weight
- Customer spending
Categorical variables such as gender or marital status are not suitable for t-tests.
2. Independence of Observations
Each observation should be independent of the others.
For example, if you’re comparing boys and girls, each student’s score should appear only once in the dataset.
For paired t-tests, the observations are paired within individuals, but each pair should still be independent of every other pair.
3. Approximately Normal Distribution
The data (or the differences for a paired t-test) should be approximately normally distributed, especially for small sample sizes.
For larger samples (typically 30 or more observations), the t-test is fairly robust because of the Central Limit Theorem.
4. Equal Variances (Independent Samples t-Test)
The classic Independent Samples t-Test assumes that both groups have similar variances.
When this assumption is violated, you can use Welch’s t-Test, which is implemented in SciPy by setting:
ttest_ind(group1, group2, equal_var=False)Welch’s t-Test is often preferred because it performs well even when group sizes or variances differ.
Common Mistakes
Even experienced analysts occasionally misuse t-tests. Here are some of the most common pitfalls to avoid.
1. Choosing the Wrong Test
Using an Independent Samples t-Test for before-and-after data is a common mistake.
If the same individuals are measured twice, always use a Paired Samples t-Test.
2. Misinterpreting the p-Value
A p-value is not the probability that the null hypothesis is true.
Instead, it represents the probability of obtaining results at least as extreme as those observed assuming the null hypothesis is true.
3. Ignoring Effect Size
A statistically significant result does not necessarily imply a meaningful difference.
For example, an average increase in customer spending of $0.20 may be statistically significant if the sample size is very large, but it may have little practical value for the business.
Whenever possible, complement your t-test with an effect size such as Cohen’s d.
4. Saying “Accept the Null Hypothesis”
This is one of the most common mistakes in statistics.
Instead of saying:
“We accept the null hypothesis.”
Say:
“We fail to reject the null hypothesis.”
A non-significant result simply means that the evidence is insufficient to conclude that a difference exists.
Best Practices
When performing a t-test, follow these guidelines:
- Clearly define your research question.
- Choose the correct type of t-test.
- Check the assumptions of the test.
- Visualize your data using boxplots or histograms.
- Interpret both the t-statistic and the p-value.
- Consider reporting an effect size alongside statistical significance.
- Explain your findings in the context of the real-world problem rather than focusing only on the numbers.
Following these practices will help you produce analyses that are both statistically sound and meaningful to decision-makers.
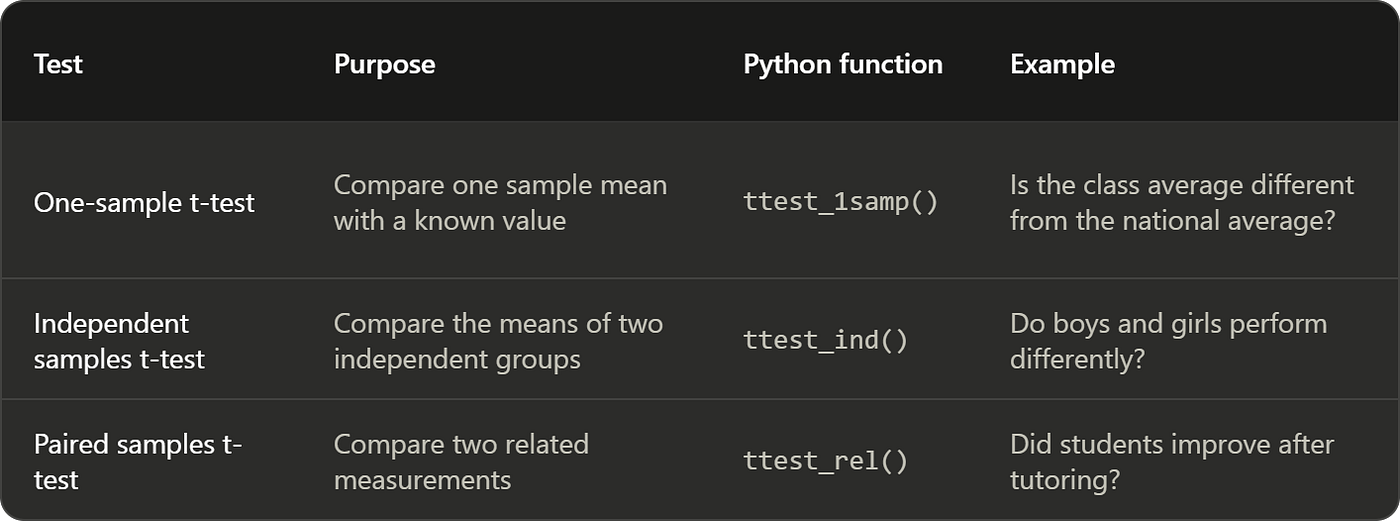
Summary of the Three t-Tests
The table below provides a quick comparison of the three types of t-tests covered in this article.
Final Thoughts
The t-test is one of the most important statistical tools in data science because it enables us to determine whether observed differences are meaningful or simply the result of random variation.
Throughout this article, you’ve learned:
- What a t-test is and why it is important.
- How hypothesis testing forms the foundation of statistical inference.
- The differences between One-Sample, Independent Samples, and Paired Samples t-Tests.
- How to implement each test in Python using
scipy.stats. - How to interpret the t-statistic and p-value.
- How to choose the correct test for different research questions.
Although the t-test is often introduced as a beginner’s statistical technique, it remains a powerful and widely used method across healthcare, education, finance, marketing, manufacturing, and many other fields. Understanding when and how to apply it correctly is an essential skill for every data scientist and analyst.
메타데이터
- post_id
- cd0a8b53ede5
- slug
- mastering-t-tests-in-statistics-and-python-one-sample-independent-and-paired-t-tests-explained-cd0a8b53ede5
- url
- https://medium.com/@brentwash35/mastering-t-tests-in-statistics-and-python-one-sample-independent-and-paired-t-tests-explained-cd0a8b53ede5
- canonical_url
- https://medium.com/@brentwash35/mastering-t-tests-in-statistics-and-python-one-sample-independent-and-paired-t-tests-explained-cd0a8b53ede5
- author_url
- https://medium.com/@brentwash35
- status
- ok
- fetched_at
- 2026-08-10 13:37:27