Microsoft Sentinel Training Lab (Part 1)
The lab sets up a Microsoft Sentinel workspace and uses pre-recorded data to simulate scenarios that demonstrate its various features.
Microsoft Sentinel Training Lab (Part 1)
The lab sets up a Microsoft Sentinel workspace and uses pre-recorded data to simulate scenarios that demonstrate its various features.

Module 1 — Setting up the environment
This module covers the deployment of the Microsoft Sentinel Training Lab solution, which will be used throughout the subsequent modules.
Prerequisites
To begin using Microsoft Sentinel, you need a Microsoft Azure subscription. If you don’t have one yet, you can create a subscription by signing up for a free account here.
- An Azure subscription
- Permissions to create a resource group in your Azure subscription
- Note: Installing Sentinel for the very first time in a Subscription needs Subscription Contributor or Owner permission
Microsoft Sentinel provides a “trial mode” where data ingestion up to 10GB/day is free for the first 31 days when first added to a workspace. Sentinel will prompt that it is in trial mode once installed.
Topic 1: The Microsoft Sentinel workspace
In this topic we will show how to create a brand new Microsoft Sentinel workspace to store the data.
- Navigate to the Azure Portal and log in with your account.
- In the top search bar, type Sentinel and click on Microsoft Sentinel.

-
In the Microsoft Sentinel screen, click Create at the top left.
-
You can choose to add Microsoft Sentinel to an existing Log Analytics workspace or build a new one. We will create a new one, so click on Create a new workspace.

- In the Create Log Analytics workspace page, fill out the form as follows:
- Subscription: choose the Azure subscription where you would like to deploy the Microsoft Sentinel workspace
- Resource Group: select an existing resource group or create a new resource group (recommended) that will host the lab resources
- Region: from the drop down, select the Azure region where the lab will be located
- Workspace Name: provide a name for the Microsoft Sentinel workspace. Please note that the workspace name should include 4–63 letters, digits or ‘-’. The ‘-’ shouldn’t be the first or the last symbol.
- Example:
sentinel-training-ws

Click Review + create and then Create after the validation completes. The creation takes a few seconds.
- You will be redirected back to the Add Microsoft Sentinel to a workspace. Type the name of your new workspace in the search box, select your workspace and click Add at the bottom.

- The deployment will begin. When it’s complete in a minute or two, your Microsoft Sentinel workspace is ready to use!
Topic 2: Deploy the Microsoft Sentinel Training Lab Solution
In this topic we will deploy the Training Lab solution into the existing workspace. This will ingest pre-recorded data (~20 MB) and create several other artifacts that will be used during the topics.
- In the Azure Portal, go to the top search bar and type Microsoft Sentinel Training. Select the Microsoft Sentinel Training Lab Solution marketplace item.

- Read the solution description and click Create at the top.

- In the Basics tab, select the Subscription, Resource Group and Workspace that you created in Exercise 1, or provide the details for your existing workspace. Optionally, review the different tabs (Workbooks, Analytics, Hunting Queries, Watchlists, Playbooks) in the solution. When ready, click on Review + create.

-
Once validation is ok, click Create. Note that the deployment process takes about 15 minutes, in part because we want to make sure all the ingested data is ready for you to use once finished.
-
Once the deployment finishes, go back to Microsoft Sentinel and select the workspace. To do this from the Azure Portal, type “Sentinel” and click the Microsoft Sentinel service, then click the workspace from the list.
On the home page, we should see some ingested data along with several recent incidents, although it may take a few minutes for them to appear.

Topic 3: Configure Microsoft Sentinel Playbook
In this topic, we will configure a Playbook which will be used later in the lab. We’re going to allow our playbook to access Sentinel.
- Navigate to the resource group where the lab has been deployed.
- In the resource group you should see an API Connection resource called azuresentinel-Get-GeoFromIpAndTagIncident, click on it.

- Click on Edit API connection under General.

- Click on Authorize and a new window will open to chose an account. Pick the user that you want to authenticate with. This should normally be the user that you’re logged in with.

- Click Save.

Module 2 — Data Connectors
In this module you will learn how to install and enable Data Connectors in Microsoft Sentinel to bring in alerts and/or telemetry from different sources.
Topic 1: Enable the Azure Activity connector
This topic explains how to enable the Azure Activity data connector, which imports logs from Azure management plane activities and allows us to track administrative actions within the subscription.
NOTE: The user account must have at least Reader permissions to any subscription we want to monitor, in order to perform this topic.
- Open the Microsoft Sentinel instance by typing Sentinel into the search box, clicking the Sentinel service, and then the workspace.
- Open Content Hub and search for the Azure Activity content solution.
- Tick the Azure Activity solution and click either Install button.

-
When the deployment completes, select Data Connectors in the Configuration section of the Sentinel workspace.
-
In the data connectors screen, click the Azure Activity connector. If you already have lots of connectors, you can type activity into the search bar to narrow down the list.
-
Select the Azure Activity connector and click on Open connector page in the right-hand panel.

-
On the Azure Activity connector page, scroll down through the Configuration instructions until you get to number 2, Connect your subscriptions through diagnostic settings new pipeline.
-
Click on Launch Azure Policy Assignment wizard, which will redirect you to the policy creation page.

- In Scope, select your subscription.
Note: Policy lets you deploy a setting to multiple possible targets — for example, if you have Owner permission at a Management Group level, you can assign a policy to configure collection of Azure Activity logs from all subscriptions under that group.

- Go to the Parameters tab. On the Primary Log Analytics workspace select the Microsoft Sentinel workspace:

- We’ll use the deployIfNotExists (DINE) feature of Azure Policy to deploy the setting directly to any Activity logs in scope. To do this, tick Create a remediation task. Leave the Managed Identity set to a System Managed Identity, and pick a region proximate to your subscription.

-
Press Review and Create, and then Create to save the policy.
-
It is normal if you don’t immediately see the connector showing as connected and with a green bar, as Azure Policy can take some time to apply.
-
Head back to the Content Hub and click on the Azure Activity solution, and click the Manage button at the bottom of the panel on the right.

- From the Manage view, the contents of the solution are displayed: any connectors, analytics rules, workbooks, hunting queries and other content included in the solution pack are visible here. Now these have been installed, they will each appear in the relevant section of the Sentinel interface.

Now we’ve connected Activity, we’ll move on to some other connectors.
Topic 2: Enable the Microsoft Defender for Cloud Data Connector
This topic covers how to enable the Microsoft Defender for Cloud data connector. This connector allows us to stream security alerts from Microsoft Defender for Cloud into Microsoft Sentinel, so we can incorporate Alerts from Defender, view Defender data in workbooks, and investigate and respond to incidents.
NOTE: To do this topic, our user must have the Security Reader role in the subscription. If not done already, we will also need to enable any of the Defender plans in Microsoft Defender for Cloud.
- Open the Microsoft Sentinel workspace and click on the Content Hub.
- Search for defender in the search bar, select the Microsoft Defender for Cloud content solution, and click Install.

-
After deployment finishes, click the Manage button at the bottom right.
-
In the list of content, tick the Microsoft Defender for Cloud connector and click Open Connector Page.

- In the Microsoft Defender for Cloud connector page, check that your permissions are sufficient as noted in the panel at the top.

Topic 3: Enable Microsoft Defender Threat Intelligence connector
In this topic, we’ll add the Microsoft Defender Threat Intelligence (MDTI) connector to your Sentinel workspace, which ingests Microsoft Threat Intelligence indicators automatically into the ThreatIntelligenceIndicator table. MDTI provides a set of indicators and access to the https://ti.defender.microsoft.com portal at no additional cost, with the premium features of the MDTI portal and API requiring licensing.
The Threat Intelligence content solution includes the data connectors for all supported forms of Threat Intelligence.
NOTE: Sentinel also supports importing Threat Intelligence indicators via the TAXII protocol using the Threat Intelligence — TAXII data connector, so if you have your own preferred TI source, you can add that to your workspace instead.
- Open your Microsoft Sentinel workspace and click on the Content Hub.
- Search for threat intel in the search bar, select the Threat Intelligence content solution, and click Install.

- After deployment finishes, click the Manage button at the bottom right.

- Select the Microsoft Defender Threat Intelligence (preview) connector and click Open Connector Page at the bottom right.

- On the Connector page, from the Import indicators list, select an option for which indicators to import, or leave the default “All available” selected, and click Connect.

Threat Intelligence indicators will start being ingested into our ThreatIntelligenceIndicator table.
Module 3 — Analytics Rules
This module covers Analytics Rules in Microsoft Sentinel, and shows how to create different types of rules for security detections.
Topic 1: Enable an Azure Activity rule
As we’ve already installed the Azure Activity content solution in Module 1, we’ll enable one of the included rules.
- In the Microsoft Sentinel instance, go to Analytics.
- Click the Rule Templates tab if not selected. Rule templates are installed here by content hub solutions. We can create active rules based on the templates supplied here, or create them from scratch.
- Click the Add Filter button, and select Source name as the filter, then Azure Activity and click Apply

- Find and click the template Suspicious Resource deployment and look at the short summary description in the panel on the right:
- The default Severity is specified as Low
- The Description describes the intent of the rule
- It uses the Azure Activity data source, and there’s a green “connected” icon showing that the
AzureActivitytable is available - The template specifies the tactic of Impact for threat categorization and reporting
- A preview of the KQL query which runs the detection is shown in the Rule query area for quick inspection
We’re going to create this rule with the default parameters in place. Click Create rule.

- In the Analytics Rule Wizard, check the rule is Enabled on the first page, then click Set rule logic. Note: you can click either the tab at the top, or the button at the bottom to continue.

- On the Set rule logic screen, you have the ability to create or modify the KQL query, control entity mapping, enable and adjust alert grouping, and define the scheduling and lookback time range.
Some highlights:
- Expand the query panel using the arrows above the query (top right)
- Pop the query open, review the output and edit the KQL using View query results
- Simulate alert volume from the rule by using the Results simulation area’s Test with current data button

Click Next: Incident settings at the bottom (or the Incident settings tab at the top) to continue the wizard.
- On the Incident settings tab, note that Incident creation is enabled, and Alert grouping is disabled. Not every Alert detected by Sentinel must be promoted into an Incident — particularly noisy alerts! These settings can always be modified later if desired.

- This rule looks good so far, and we’re going to accept the current state and skip to rule creation, so click the Review and Create tab.

- On the Review and create tab, review the rule configuration, and then click Save to deploy your new rule to the Active rule set.
Topic 2: Create a Microsoft Sentinel custom analytics rule
Scenario
A security consultant informs you about intelligence related to malicious inbox rule manipulation, based on online threat reports. The described attack vector includes the following indicators:
- Office activity
- Creation of new inbox rules
- Presence of certain keywords within the rules
Considering the attack vector and your organization’s risk, the consultant recommends creating a detection rule for this activity. In this topic, we will use the Microsoft Sentinel analytics rule wizard to build a new detection rule.
Set up the detection
- Open the Sentinel Logs area and navigate to a query tab
- Run the search query below to see a list of activities Sentinel ingested
- Note: we may need to adjust the Time range to more than the last 24h if the training lab content was installed longer ago
OfficeActivity_CL
| distinct Operation_s- As we can see, a New-InboxRule operation is indeed captured in our logs:
-
Click into Analytics, click the Create button in the action bar at the top, and pick Scheduled query rule.
-
For the Name, type Malicious Inbox Rule — student
-
In the rule Description, state the intent of the rule: This rule detects creation of inbox rules which attempt to Delete or Junk warnings about compromised emails sent to user mailboxes.
-
Under Tactics tick Persistence and Defense Evasion.
-
For rule severity select Medium.
-
Press Next: SET rule logic.
-
In the Rule logic page, review and copy the query below:
let Keywords = dynamic(["helpdesk", " alert", " suspicious", "fake", "malicious", "phishing", "spam", "do not click", "do not open", "hijacked", "Fatal"]); OfficeActivity_CL
| where Operation_s =~ "New-InboxRule"
| where Parameters_s has "Deleted Items" or Parameters_s has "Junk Email"
| extend Events=todynamic(Parameters_s)
| parse Events with * "SubjectContainsWords" SubjectContainsWords '}'*
| parse Events with * "BodyContainsWords" BodyContainsWords '}'*
| parse Events with * "SubjectOrBodyContainsWords" SubjectOrBodyContainsWords '}'*
| where SubjectContainsWords has_any (Keywords) or BodyContainsWords has_any (Keywords) or SubjectOrBodyContainsWords has_any (Keywords)
| extend ClientIPAddress = case( ClientIP_s has ".", tostring(split(ClientIP_s,":")[0]), ClientIP_s has "[", tostring(trim_start(@'[[]',tostring(split(ClientIP_s,"]")[0]))), ClientIP_s )
| extend Keyword = iff(isnotempty(SubjectContainsWords), SubjectContainsWords, (iff(isnotempty(BodyContainsWords),BodyContainsWords,SubjectOrBodyContainsWords )))
| extend RuleDetail = case(OfficeObjectId_s contains '/' , tostring(split(OfficeObjectId_s, '/')[-1]) , tostring(split(OfficeObjectId_s, '\\')[-1]))
| summarize count(), StartTimeUtc = min(TimeGenerated), EndTimeUtc = max(TimeGenerated) by Operation_s, UserId__s, ClientIPAddress, ResultStatus_s, Keyword, OriginatingServer_s, OfficeObjectId_s, RuleDetail-
We can check how many hits the query finds using the Test with current data button on the right side, which helps with Alert modelling and tuning.
-
Under Alert enhancement, expand the Entity mapping section, which allows us to map fields to well-known categories (entity types):
- Click Add new entity, and then pick Account as our first type. Fill out the identifiers as follows:
- In the left-hand selector, pick FullName as the type, and set the right-hand column identifier to UserId__s
- This tells Sentinel that we have some sort of Account, specified by its full name, in the column UserId_s
- Press Add new entity and this time select Host
- In the left-hand selector, select FullName, and map it to OriginatingServer_s in the right column
- Press Add new entity, and pick the IP entity type
- In the left-hand selector, pick Address, and map it to the ClientIPAddress value
- Your mapping should look like the below:
Add a customized Alert title
Now, to make your SOC more productive, save analyst time, and help quickly and effectively triage newly-created incidents, a SOC analyst asks you to provide the affected user from the search results as part of the alert title.
- To achieve this, we’ll use the Alert details feature and use a custom Alert Name Format.
- As we know the username is available in the UserId_s column, under the Alert Details heading, in the Alert Name Format section, provide the dynamic title “Malicious Inbox Rule — {{UserId__s}}”
- Under Query scheduling, set the run query every to 5 minutes and the Lookup data to last 12 Hours.
If you deployed the lab more than 12 hours ago, you will need to change the lookback period in order to cover that period.
- Leave the other values at defaults.

-
Click the Incident settings button or the tab at the top.
-
As our SOC is under stress, we want to reduce the number of alerts and be sure that when analyst handle a specific incident, he/she will see all related events or other incidents related to the same attack story. For that we will implement the Alert grouping feature. To do so, follow the steps below:
- On the Incident settings tab under Alert grouping:
- Set Group related alerts into incidents to Enabled.
- Set Limit the group to alerts created within the selected time frame to 12 hours.
- Set the Group alerts triggered by… setting to Grouping alerts into a single incident if the selected entity types and details matches, then pick only the Account.
- Skip to Review and create and Save your new Analytics rule.

The next time the rule is scheduled, it should find the logs from the OfficeActivity_CL custom log table and raise grouped Alerts as Incidents.
Tip: You should already be able to see the sample Incident with a similar outcome from the rule installed when the Training Lab content was onboarded (if it was onboarded recently).
Topic 3: Review resulting security incident
Now we’ve created a custom Analytics rule to detect malicious inbox rule creation, let’s quickly review an Incident produced by a similar Analytics rule which was installed and run when this training lab content was onboarded.
Find the Incident
- From the Microsoft Sentinel instance, select Incidents and review the incident page.
- Find the incident with the title “Malicious Inbox Rule, affected user “AdeleV@contoso.OnMicrosoft.com” or similar — notice that the title adapted to the user affected by the detection.
- In the right pane we can review the incident preview, this view will gave us high level overview on the incident and the entity that related to it.
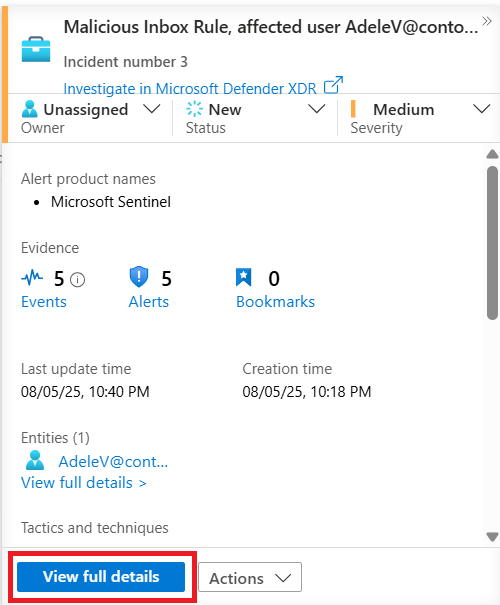
There’s a lot of information in this quick view panel!
- At the top: Title, ID, assignment to a user, status (New/Active/Closed) and Severity
- The Description provided by the rule (providing good descriptions helps analyst understand detections)
- Any Alert products involved (here, just Sentinel)
- A count and quick links to Events, Alerts and any Bookmarks added to the incident
- Incident update and creation times
- Quick links to entity pages for Accounts (here Adele’s account — but also potentially Hosts, IPs, and more)
- Tactics noted by the rule definition
- A link to the Incident Overview workbook, which provides a live report on the Incident state
- A direct link to edit the rule producing the detection, in case you need to edit the rule/detection logic quickly
- Quick tagging and tag display
- A direct link to the incident
- The most recent comment, if present
… so you can see a snapshot of the most critical information and perform basic incident management directly from the summary panel.
-
Click View full details at the bottom
-
On the full Incident page (Preview), you can find:
- The same quick panel (now on the left)
- The Incident Actions button at the top right
- The Overview tab which includes:
- An Incident timeline panel, which shows any Alerts and Bookmarks associated with that incident in a timeline view
- An Entities panel allowing a quick pivot to an entity on the Entities tab
- The Entities tab allowing exploration of Entity insights and timelines directly
- A list of Similar incidents at the bottom of the page for added context, if available
- A set of Incident insights in the right-hand panel, if available
- After looking over the Incident, click the Entities tab to list all the mapped entities related to this incident.

- Click the entity “AdeleV@contoso.OnMicrosoft.com” from the incident Entities list :
- This action will navigate to the Entities tab, a list of entities with 3 sub-tabs on the right.
- Clicking each tab will show different information about the Entity and its state
- Note: State information is pulled from various sources: Some may be pulled directly from Azure services (like Microsoft Entra ID or Azure Virtual Machine host information), some from onboarded data sources, and some from UEBA (if enabled).

메타데이터
- post_id
- cd170f5938e8
- slug
- microsoft-sentinel-training-lab-part-1-cd170f5938e8
- url
- https://medium.com/@houssamed198/microsoft-sentinel-training-lab-part-1-cd170f5938e8
- canonical_url
- https://medium.com/@houssamed198/microsoft-sentinel-training-lab-part-1-cd170f5938e8
- author_url
- https://medium.com/@houssamed198
- status
- ok
- fetched_at
- 2026-06-28 10:39:35