How to Figure Out What’s Running On a Specific Port on Linux
Some strange process is running on a particular port — what is that?
How to Figure Out What’s Running On a Specific Port on Linux
Some strange process is running on a particular port — what is that?
⚙️ Check out my series on [*Automating Cybersecurity Metrics](https://medium.com/cloud-security/automating-cybersecurity-metrics-890dfabb6198). The [Code](https://github.com/tradichel).*

🔒 Related Stories: [*Unif](https://medium.com/cloud-security/ubiquiti-dream-machine-pro-b9a4f68c254d)i* | [*Dream Machine Pro](https://medium.com/cloud-security/ubiquiti-dream-machine-pro-b9a4f68c254d) | [Ubiquiti](https://medium.com/cloud-security/ubiquiti-dream-machine-pro-b9a4f68c254d) | [Network Security](https://medium.com/cloud-security/network-security-68e1f26db9df)*

💻 Free Content on* [Jobs in Cybersecurity](https://medium.com/cloud-security/cybersecurity-careers-and-jobs-69c05616d2b4) | *✉️ Sign up for the [*Email List](https://2ndsightlab.medium.com/subscribe)*
I’ve written before about netstat, ps, and lsof. But let’s take it a little bit further in this post. I want to figure out exactly where the executable exists on a system that is generating some network traffic.
Here’s the scenario. I’m using a host-based firewall called Little Snitch as mentioned before. I have it configured so that I have to review and accept every new connection so I can see if anything unusual is happening — especially when I am trying to test new network appliances or software.
As I was connecting to a particular application I started seeing popups indicating that Google Chrome is trying to make a connection on an unexpected high port. What is that? If it can’t connect the first time it tries repeatedly on different ports — both UDP and TCP. Each time there will be two requests in quick succession — a request and response? Once I allow two connection it stops the popups. But why is the application trying to connect on those high ports?
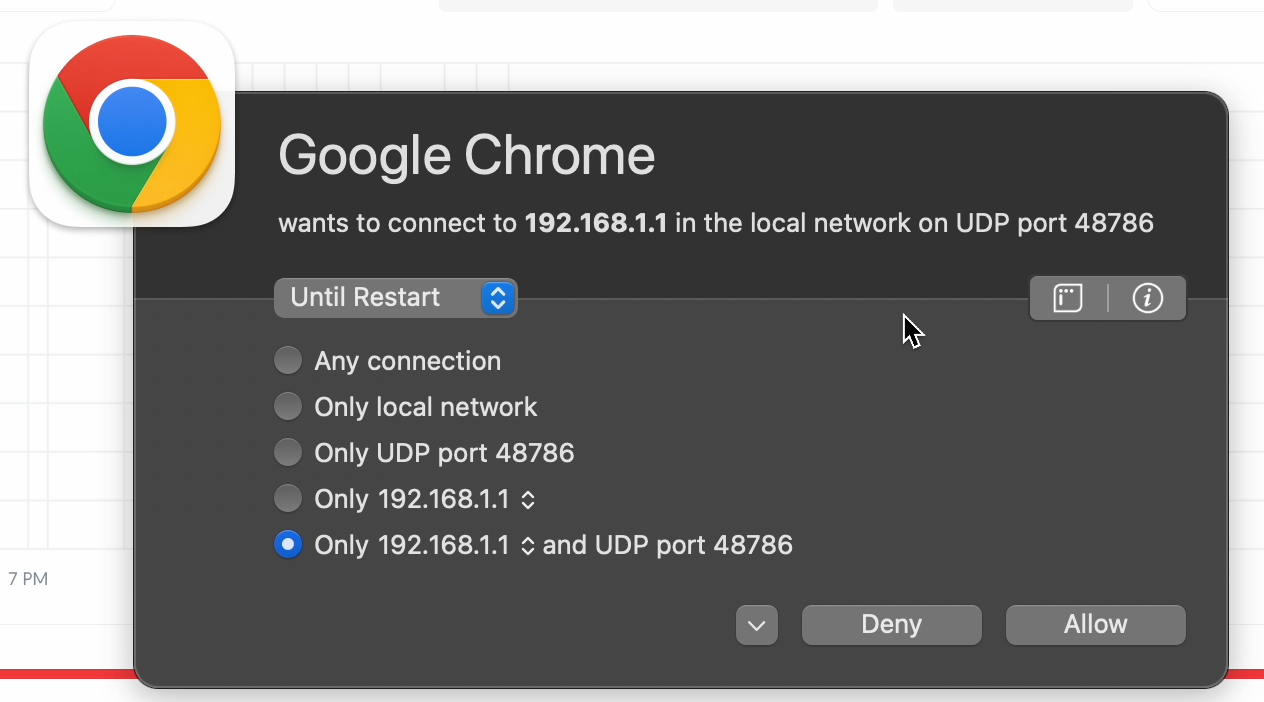

I scour the documentation and the web for the application and I can’t find anything that answers my question with any specifics — only vague mentions of real time communications — which I have not enabled and am not using in this application. So now it’s time to do some reverse engineering to figure out what is causing that traffic. Once I find the source I could take further steps to figure out why that particular source is sending this traffic.
Offline testing
The first thing I’m doing is testing this device offline. That way, I will have less traffic to sort through. I’ve got two laptops running — one where I’m writing this post connected to the internet. I’ve got another computer connected to the device which is also not connected to the Internet to ensure no traffic is escaping that I’m somehow missing.
Client side packet capture on my laptop
First, I ran Wireshark as explained in this post:
[embed]What is Packet Sniffing? The most basic introduction to Wiresharkmedium.com
Wireshark captures network traffic on my local laptop. It shows what my laptop connects to and what is connecting to my laptop. In order to understand what is connecting to what you have to understand something about the protocols involved. They all work differently — HTTP, HTTPS, TLS, SMTP, POP, ARP, IP, ICMP, IPv4, IPv6, etc.
Wireshark can help you decipher a lot of information about your network traffic automatically — but sometimes it is wrong. So you still might need to know a bit more about the protocol to see if Wireshark is giving you the correct information or not.
In order to reduce the noise I run WireShark right before I open the application and close it after I capture what I need.
Server side packet capture on the remote host
I want to capture traffic on the remote host so I connect to it using SSH. However, this host is a bit complicated. When I run this command to get all traffic except SSH traffic it’s not working:
sudo tcpdump -nvt not port 22What’s going on here? Well I have multiple interfaces. Perhaps tcpdump is only applying that not port command on Debian to a particular interface. So I try this command to get all the interface traffic:
sudo tcpdump -nvt -i all not port 22Yeah, that’s too much. I’m getting VLAN traffic, etc.
So let’s reduce that to the particular ethernet interface I’m intersted in.
Run this command to view all the interfaces:
sudo netstat -iI see some switch interfaces and the local host interface (lo) and one other interface sending a fair amount of data. That interface happens to map to the physical port where my laptop is plugged in.
I’m mostly interested in the interface my laptop is plugged into so lets start there.
sudo tcpdump -nvt -i br0 not port 22That’s more like it. I see a lot requests sent to then entire network on a port that this device uses to discover and register devices on the network. That’s expected. I see some random DNS requests from my laptop which do not look out of the ordinary. Unfortunately using Google Chrome is going to generate a lot of noise so I might alternately also run this test in a different browser and compare the results, but for now I am using Google Chrome and it connects to a lot of things when it opens up.
Capture a baseline
I start by capturing a baseline of the normal traffic. I don’t want to see any of the Google traffic or anything unneccessary so I close all the applications that might be connecting to the device beyond the operating system, and I’m filtering out SSH.
I run the above command and output the data to a file:
sudo tcpdump -nvt -i br0 not port 22 > baseline.txtBut what if I want to capture this traffic and view it in wireshark? There’s a separate option to create a pcap. I can capture the pcap, transfer it to my laptop, and view it in Wireshark.
I run this command to capture a pcap that I can review in WireShark:
sudo tcpdump -nvt -i br0 not port 22 -w baseline.pcapAfter some time I enter Ctrl-C to stop the process and validate that my baseline.pcap file exists. I could also copy it to my laptop and verify it before proceeding which I would do in an actual security incident.
Capture the anomalous traffic
Next I capture the stun traffic. I run the same command above to obtain a pcap from the traffic I’m about to generate.
sudo tcpdump -nvt -i br0 not port 22 -w anomalous.pcapI open up my console on the laptop and immediately get two new connections in quick succession. I take screen shots of those popups. Now I should have pcaps on both sides of the connection to inspect. I let that run for a bit.
What is interesting is that when I did not have focus on Google Chrome and I was taking screen shots of the popups I got multiple sets of what two popups. When I am focused in the browser normally I accept two in succession and then the popups stop. This tells me that if I don’t quickly accept the requests to connect, then it tries again.
SSH disruption and work around
Now it is at this point that I want to check what is running on the two ports. But for some reason, I can no longer SSH into my device. I try stopping and starting the SSH service and resetting the password but nothing is working. At this point I try to reboot. I wonder if the anomalous traffic caused this interruption with my ability to SSH into the system, or perhaps it was something to do with the packet capture. I’m not sure.
After rebooting I can easily login again. To avoid confusion I move the initial anomalous files to a different location and start over.
This time, I connect to three different SSH sessions in separate terminal windows before I start. Then new SSH connections should not be a problem.
Let’s try that again…
Start the anomalous packet captures on both sides.
Take a screen shot of the popups to get the ports.
Moving on…
Taking a look at the pcaps
When I look at the differences between my baseline and the anomalous pcaps I see a bunch of DNS requests to stun servers. Google is a free stun server and in general production applications shouldn’t use it. Twilio is a paid service so is a bit better. But still, what is trying to use stun?

I also see a lot of STUN or possibly TURN traffic.
You can filter on STUN in Wireshark, but not TURN (which is essentially a variation of STUN to get around NATs and Firewalls for real time communications…but has been used for other nefarious purposes in the past like C2 channels.

If you look at the details of the UDP protocol you can see information like the source and destination IP, but in this case it’s a bit misleading. When I look at the source and destination addresses it appears that my laptop is initiating the connection. However, this connection only occurs when I open a particular web page. The whole initiation of this traffic is actually coming from the server side application but it’s serving up some JavaScript apparently to make this all happen. I haven’t reverse engineered this all in great detail.

You can also look at other details in the packet.
Ok so we know it’s STUN traffic. Now what?
Reviewing the RFC for the STUN protocol
One thing I can do next is review the RFC for the STUN Protocol to understand eactly what packets are gettting sent back and forth and what should be in them. Then I can see if there is anything extraneous in these packets that shouldn’t be there or if this traffic is doing anything out of the ordinary.
Well, there are a bunch of RFCs when you do a quick Google search so first I’d have to look at all the dates and figure out which one is the latest. I have done that in other posts and explained how I looked for the correct RFCs for things like Secure Remote Password (SRP) so not going to repeat that here.
Once you find the correct protocol you can review the details of the requests and responses and packet structure to learn more about it. Then compare the RFC to what you see in the packet.
Beyond understanding the details of the protocol and how it works, I want to understand is why the particular application I am using needs STUN. So I need to take a closer look at what software component or code is sending this traffic.
Check what is using those ports on the laptop and the device
First, on the remote host, I try this command for each port. I get no results.
sudo netstat -n | grep [port]Next I run this command with both ports:
sudo netstat -nlp | grep [port]This time I can see that the server is listening on the TCP port and the other port appears without LISTEN. So what is that all about? Is it connecting back to itself through the browser?
And what is node18 doing exactly? Let’s see if we can find out.
Figuring out what executable is running on a port
These are the steps I forget and remember all the time. So hopefully if I write them down I’ll remember them once and for all or at least I will have a reference.
First I try lsof with the i directive and the port for each port like this:
sudo lsof -i:[port] -nHere I can see the PID and for both connections, it’s the same PID for both those connections. Interesting…I’ll save my speculation until I have more proof of what is going on here.
The PID is the Process Identifier which identifies a particular running process on your system. A process is something like an application or a service or some system component that executes commands.
So what actually is running this process? We can use the PID to get more information.
Next we can run ps which will give us more information about that PID:
ps -aux | grep <PID>From the above command I can see the binary that triggered the action which is some sort of go or C compiled binary, and the JavaScript file it may have kicked off in the process. It appears to be node version 18 after I test the version later below.
/usr/bin/node18What else can I find out? I look in the folder where the JavaScript file exists.
I can see that there’s a webrtc.node which is what I suspected. Stun and WebRTC are often used together — including by malware that bypasses firewalls. But for this product this behavior may or may not be expected.
From what I can see at a quick glance this component has something to do with video and audio — so maybe a camera or phone. I figure that out with a quick look at the JavaScript and WebRTC file.
But is that supposed to be running in my browser when I’m connected to the console of this device and have not deployed any of those types of devices? What is that all about?
At the moment I have my camera and microphone disallowed for all applications in my OS so hopefully whatever this is doing can’t capture any audio or video without permissions. But it could be doing something completely different. Maybe it’s some kind of device discovery. But I don’t particularly want that running in my admin console in a browser when I’m logged into the device or connecting to my admin laptop. I’d probably run those types of applications on a separate machine, if I run them at all.
When I inspect what is in the /usr/bin folder I notice there are are two files — node18 and node20.
Out of curiosity I run this command:
/usr/bin/node18 --versionI get :
v18.18.2I run the same command for node20 and I get:
v20.15.0What’s the latest version of node? Head over to the download page. Choose Linux. Click the version drop down and you’ll see v23.6.0.
Are there any vulnerabilities in those older versions? Yes there are. One in particular that stands out is an SSRF vulnerability:
Interesting.
Well, there’s more I could do here like look for process hollowing, process injection, etc. and I could further try to reverse engineer the component (depending on the licensing) but that’s all I have time for at the moment.
Follow for updates.
Teri Radichel | © 2nd Sight Lab 2024
About Teri Radichel:
~~~~~~~~~~~~~~~~~~~~
⭐️ Author: Cybersecurity Books
⭐️ Presentations: Presentations by Teri Radichel
⭐️ Recognition: SANS Award, AWS Security Hero, IANS Faculty
⭐️ Certifications: SANS ~ GSE 240
⭐️ Education: BA Business, Master of Software Engineering, Master of Infosec
⭐️ Company: Penetration Tests, Assessments, Phone Consulting ~ 2nd Sight Lab
Need Help With Cybersecurity, Cloud, or Application Security?
~~~~~~~~~~~~~~~~~~~~~~~~~~~~~~~~~~~~~~~~~~~~~~~~~~~~~~~~~~~~~
🔒 Request a penetration test or security assessment
🔒 Schedule a consulting call
🔒 Cybersecurity Speaker for PresentationFollow for more stories like this:
~~~~~~~~~~~~~~~~~~~~~~~~~~~~~~~~~~~~~~~~~~~~~~~~~~~~~~~~~~~~~
❤️ Sign Up my Medium Email List
❤️ Twitter: @teriradichel
❤️ LinkedIn: https://www.linkedin.com/in/teriradichel
❤️ Mastodon: @teriradichel@infosec.exchange
❤️ Facebook: 2nd Sight Lab
❤️ YouTube: @2ndsightlab
메타데이터
- post_id
- cd35a25d359f
- slug
- how-to-figure-out-whats-running-on-a-specific-port-on-linux-cd35a25d359f
- url
- https://medium.com/cloud-security/how-to-figure-out-whats-running-on-a-specific-port-on-linux-cd35a25d359f
- canonical_url
- https://medium.com/cloud-security/how-to-figure-out-whats-running-on-a-specific-port-on-linux-cd35a25d359f
- author_url
- https://medium.com/@2ndsightlab
- status
- ok
- fetched_at
- 2026-06-26 21:52:29