9 Linux Commands I’ve Run at 2AM More Times Than I Can Count
It was 2:07AM on a Tuesday in March when our payments API stopped accepting connections. Not slow. Not 5xx-ing. Refusing. The pod was up…
9 Linux Commands I’ve Run at 2AM More Times Than I Can Count

Created by Author
It was 2:07AM on a Tuesday in March when our payments API stopped accepting connections. Not slow. Not 5xx-ing. Refusing. The pod was up. Kubernetes said it was healthy. Datadog showed normal CPU.
I SSH’d into a node, ran six commands in about ninety seconds, and found it: 8,400 sockets stuck in CLOSE_WAIT. The service had been leaking connections for hours and the file descriptor limit had finally caught up. Restart bought us time, the fix took two days.
I didn’t reach for man. I didn't Google "how to debug Linux." Muscle memory ran the same six commands I'd run a hundred times before.
That gap between knowing Linux commands and reaching for them in the dark is what actually separates the engineer who handles a Sev1 from the one who paged their lead at 2:14AM asking for help.
I’ve been on-call for 3 years across startups and a 50-SRE platform org. The nine commands below are the only ones I actually run when production is broken. Not ls. Not grep. The ones that tell you what a running system is doing right now when every observability tool you usually trust is either slow, lying, or unreachable.
By the end of this you’ll have:
- The exact 9 commands that handle 90% of my incident-response work
- A specific syscall trick that once saved me 40 minutes on a Go mutex bug
- Three runnable “what do I check when X” scenarios you can paste into your runbook tomorrow
TL;DR — The 9 Commands, Get Ready ;)
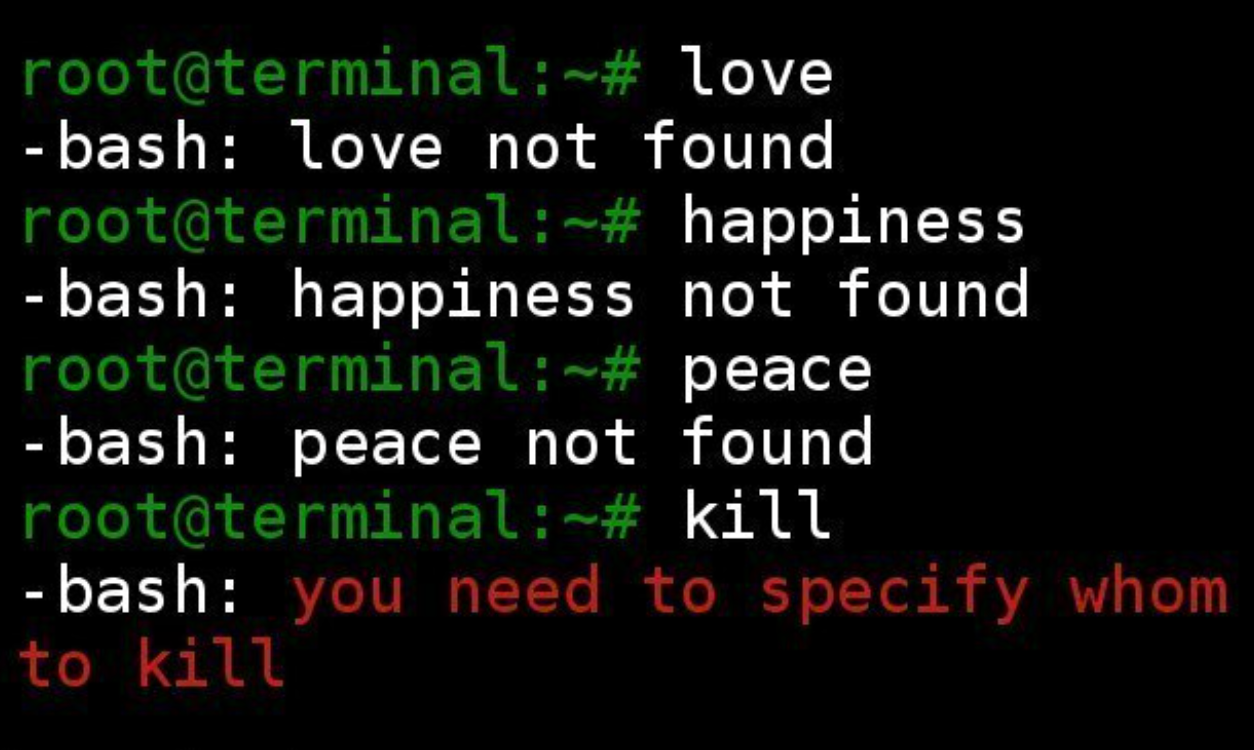
Source: Programmer Humour
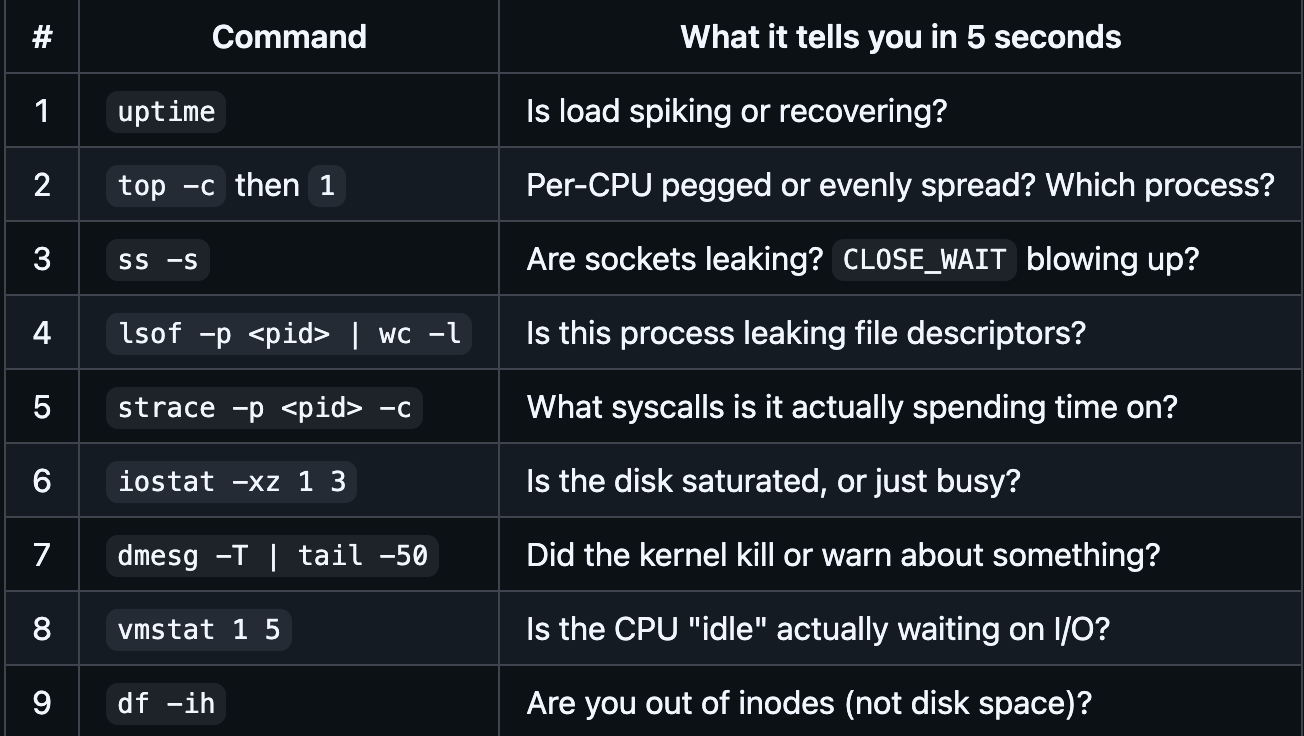
If you’re skimming, this table is the article. The rest is the why and the war stories.
Created by Author
Save this. The rest of the article is the context behind each one.
What this article is not
A Linux cheatsheet. A ls -la explainer. A "100 Linux commands every developer should know" listicle.
If you’re an SRE, DevOps engineer, or backend engineer running production systems, every command in those articles is already below your floor. What you need are the commands that surface what a running system is doing right now not what’s on disk, not what’s in your CI, not what the dashboard claims is happening.
These nine are the ones I run before I open Datadog. Because at 2AM, the terminal is the only thing I trust to be honest.
The First-60-Seconds Commands
These three run on every unhealthy host I touch, in this order, every time. I don’t think about it.
1. uptime — direction of travel before anything else
uptime
# 02:07:13 up 47 days, 3:22, 1 user, load average: 18.42, 12.17, 8.03
One line. Three numbers. 1-minute, 5-minute, 15-minute load averages.
I’m not looking at the absolute number first. I’m looking at the direction. If 1m is much higher than 15m, I’m walking into a fire that’s still growing. If 15m is higher than 1m, the incident already peaked which changes my entire approach.
A load average of 18 on a 4-core box means 4.5x more work queued than the CPU can handle. Something is saturated. The question is what.
I do this before opening a single graph. Three seconds to set the scene.
2. top -c then press 1
top -c
# then press: 1
top alone is fine. top -c shows the full command path for each process — not just java, but java -Xmx4g -jar /opt/payments/processor.jar. That matters when there are 40 Java processes on a box and you need to know which one is misbehaving.
Press 1 to expand the per-CPU breakdown. If one core is pegged at 100% and the rest are 5%, you're staring at a single-threaded bottleneck or a runaway thread pinned to a core. If all cores are evenly busy at 80%, you have a real capacity problem.
P sorts by CPU, M sorts by memory. On a memory incident I hit M before anything else.
3. ss -sthe command that ended my CLOSE_WAIT incident
ss -s
# Total: 2841 (kernel 2943)
# TCP:   1204 (estab 847, closed 201, orphaned 14, synrecv 0, timewait 196/0), ...
ss replaced netstat more than a decade ago and most Linux tutorials still show netstat. Ignore them. ss -s is the socket state summary one line per protocol, instant snapshot.
The three things I look for:
- High
TIME_WAIT— connections not being reused. Usually a connection-pooling problem or a traffic drop. Rarely critical. - High
CLOSE_WAIT— the remote side closed the connection, but our process never calledclose(). That's a resource leak. Always. - High
SYN_RECV— could be a SYN flood. More often it's just traffic the server isn't accepting fast enough.
CLOSE_WAIT has caused three separate production incidents I've personally worked. The pattern is identical every time: service starts rejecting connections after ~6 hours of load, APM looks fine, every dashboard is green, and ss -s shows several thousand connections in CLOSE_WAIT.
That night in March, this command was #3 and the incident was effectively diagnosed by minute two.
The “Which Process Is Eating This Box” Commands
Once you know something is wrong, these tell you what and why.
4. lsof -p <pid> | wc -l — the file descriptor leak detector
lsof -p 18473 | wc -l
# 14831
In Linux, “files” is misleading. lsof lists actual files, network sockets, pipes, device handles everything a process holds a descriptor to. The count alone is diagnostic.
A normal application process sits at a few hundred open descriptors. When I see 14,000+, something is leaking. The breakdown tells you what kind:
lsof -p 18473 | awk '{print $5}' | sort | uniq -c | sort -rn | head
# 8241 IPv4
# 3891 REG
# 1203 FIFO
IPv4 dominating means connection leak. REG dominating means log files or temp files opened without being closed (I've seen this with rotating log libraries that hold the old file open after a rotate). FIFO usually means subprocess pipes piling up.
5. strace -p <pid> -c — the syscall breakdown
strace -p 18473 -c
# ^C after 10s
# % time     seconds  usecs/call     calls    errors syscall
# ------ ----------- ----------- --------- --------- ----------------
#  83.21    1.842341        1842      1000           futex
#  12.44    0.275318         275      1002           epoll_wait
#   3.11    0.068923          68      1014       182 write
This is the most powerful command on the list and the one I’m most careful with. Plain strace -p prints every syscall, can hurt the process, and floods your terminal. The -c flag changes everything it just counts syscalls and prints a summary when you Ctrl+C. Run it, count to ten, kill it, read.
What the distribution tells you:
futexdominating thread contention. Mutex hell. A Go service of mine once spent 83% of its CPU onfutexwhile Datadog showed a healthy-looking 40% CPU usage. The user-time number was lying because mutex waits weren't getting counted the way I expected.epoll_waitdominating the process is mostly waiting for I/O. Normal for event-loop apps. Abnormal if there's supposed to be work happening.writewith a high error count broken pipe, disk full, or permission denied, thousands of times per second. Always points at a downstream that disappeared.nanosleepexponential backoff. Something is failing and retrying.
The “errors” column is what most engineers miss. Five hundred EAGAIN per second on write is a signal you won't get from any dashboard.
The Disk & Memory Commands
Disk and memory issues are the ones that quietly turn a degraded service into a dead one.
6. iostat -xz 1 3 — disk saturation vs disk latency
iostat -xz 1 3
# Device  r/s  w/s  rkB/s  wkB/s  await  svctm  %util
# sda     0.2  847   1.6   27104  184.3   1.18   99.9
-x is extended stats. -z hides idle devices so you're not scrolling through 12 loop mounts. 1 3 means sample every second, three times.
The column I read first is %util. Anything above 80% means the device is saturated. await is average milliseconds per I/O operation. Above 20ms on an SSD is bad. Above 100ms is a crisis.
The senior-level read is svctm vs await. If await is 180ms but svctm is 1ms, your I/O is spending 179ms sitting in a queue. The device itself is fine. You've just hit disk concurrency limits usually because some process is hammering it with parallel requests.
7. The df flag that has saved me twice: -ih
df -h        # disk space — what everyone checks
df -ih       # inode usage — what catches you when df -h says 30% used
Twice in three years I’ve been paged for “disk full” alerts where df -h showed 30% used. Both times it was inode exhaustion — some process had created millions of tiny temp files. When inodes hit 100%, you can't create new files. Even if you have 600GB of disk free.
df -ih is muscle memory now. If I see "no space left on device" but df -h looks fine, this is the next command before I do anything else.
8. vmstat 1 5 — the "service is slow but everything looks fine" command
vmstat 1 5
# procs -----------memory---------- ---swap-- -----io---- -system-- ------cpu-----
# r  b   swpd   free   buff  cache   si   so    bi    bo   in   cs us sy id wa st
# 2  8      0 512M   87M  3.2G    0    0     0 84512 1823 4218  4  2  4 90  0
Look at that wa of 90 in the cpu section. That's I/O wait. Ninety percent of CPU time was spent waiting for disk.
top would tell you the CPU is "90% idle." Datadog would probably show low CPU usage. The CPU is technically idle but it's idle because it can't make progress until disk comes back. This single column has caught more "service is slow" incidents for me than any APM tool.
9. dmesg -T | tail -50 — when the kernel knows and your app doesn't
dmesg -T | tail -50
# [Mon Jun 16 01:58:22 2025] Out of memory: Kill process 18473 (java) score 892 or sacrifice child
# [Mon Jun 16 01:58:22 2025] Killed process 18473 (java) total-vm:3156948kB, anon-rss:2841444kB
The kernel ring buffer. -T converts timestamps from seconds-since-boot to human-readable dates so you don't have to do mental math at 2AM.
This is where OOM kills land. Where hardware errors get reported. Where NFS mount timeouts appear. Where the kernel mentions, helpfully, that it just killed your Java process because the host was out of memory something that won’t show up in your application logs because the application didn’t get a chance to log it.
I run this early on every investigation. A process that keeps dying and restarting will not always leave traces in the app logs. The kernel always knows.
The Commands That Don’t Make the Top 9 But Earn Their Keep
These show up in specific scenarios often enough that I keep them in my back pocket.
tcpdump -i eth0 -nn port 8080 -c 100
tcpdump -i eth0 -nn port 8080 -c 100
# 02:14:33.481234 IP 10.0.1.42.51832 > 10.0.2.17.8080: Flags [S], seq 2941084932
# 02:14:33.481289 IP 10.0.2.17.8080 > 10.0.1.42.51832: Flags [S.], seq 1039274891
-nn skips DNS and port name resolution. -c 100 caps it at 100 packets. Always cap it. tcpdump without -c on a busy interface will flood your terminal and possibly impact the host.
The TCP flags tell the story:
[S]= SYN (connection attempt)[S.]= SYN-ACK (server accepted)[.]= ACK (handshake complete)[R]= RST (hard reset — connection aborted)
A flood of [R] flags on connections to your service means something is actively refusing them. That's not a timeout. That's rejection. The fix is usually three layers deeper than where the symptom shows up.
curl with proper timing breakdown
curl -w "dns:%{time_namelookup}s connect:%{time_connect}s ttfb:%{time_starttransfer}s total:%{time_total}s\n" \
     -o /dev/null -s http://10.0.2.17:8080/healthz
# dns:0.001s connect:0.003s ttfb:2.847s total:2.849s
DNS instant, TCP connect instant, but time-to-first-byte was 2.8 seconds. The problem is inside the application, not the network. Most people running curl URL would have said "the service is slow." This tells you where.
/proc/<pid>/status directly
cat /proc/18473/status | grep -E 'VmRSS|VmPeak|VmSwap|Threads'
# VmPeak:  2847312 kB
# VmRSS:   2614028 kB   ← actual RAM in use right now
# VmSwap:   212044 kB   ← memory swapped to disk
# Threads:       48
VmRSS is the truth your monitoring tool tries to be. VmSwap is the thing that's destroying your tail latency without you knowing a swapping process will be slow in ways APM won't explain. VmPeak is the highest the process ever hit; useful for "was there a spike I missed?"
No agent. No exporter. Straight from the kernel.
Three Runbook Snippets You Can Paste In Tomorrow
These are the exact loops I run during specific incident types. Templated for your runbook.
Scenario 1: “Service is slow but CPU and memory look fine”
# Look for hidden I/O wait
vmstat 1 5
# If wa > 30% - your disk is the problem, not your code.
# Then find what's hitting disk:
iotop -oPa     # if installed
# or
pidstat -d 1   # disk I/O per process
Scenario 2: “We think we have a memory leak”
# Watch RSS growth of a specific process
for i in $(seq 1 12); do
  echo "$(date): $(cat /proc/18473/status | grep VmRSS)"
  sleep 10
done
# If VmRSS grows by 50MB every 10 seconds and never shrinks - that's a leak.
# Not a suspicion. A confirmation.
Scenario 3: “Intermittent connection failures”
# Count CLOSE_WAIT over time
for i in $(seq 1 20); do
  echo "$(date +%H:%M:%S) CLOSE_WAIT: $(ss -tn state close-wait | wc -l)"
  sleep 5
done
# If the number climbs and never resets, your application has a
# connection leak that will exhaust file descriptors and start
# refusing new connections. It will happen again after every
# restart, faster each time.
That third one is the script I now drop into every payments-service runbook. The March incident was preventable with a single cron running that loop.
The Three Kernel Parameters That Have Bitten Me Most
sysctl net.ipv4.tcp_tw_reuse
sysctl net.core.somaxconn
sysctl fs.file-max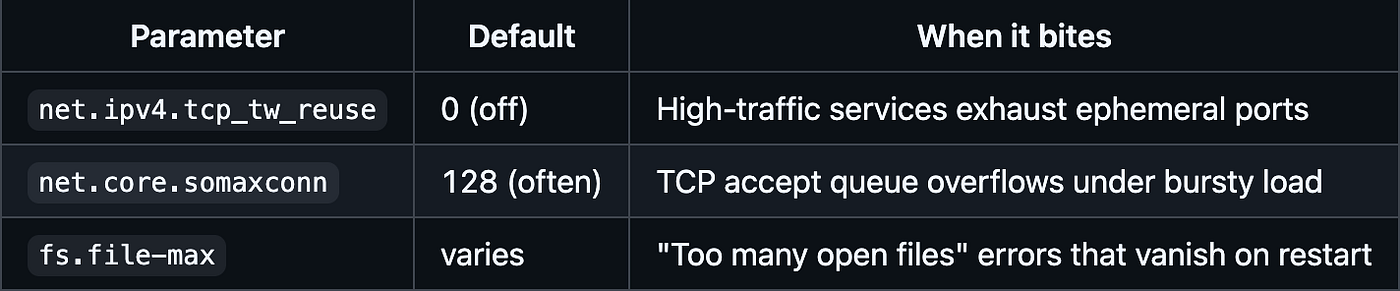
Created by Author
These don’t show up in your application logs. They show up as mysterious connection refusals, EMFILE: too many open files, or a service that works for 4 hours and then doesn't. The application logs say nothing. The kernel parameters quietly say everything.
When I land at a new company, checking these three is in my first-week onboarding doc.
Why These and Not the Others?
You’ll notice I didn’t include htop, glances, dstat, or any of the prettier alternatives. They're fine. They're just not on every box.
Every command on this list works on:
- A bare-bones EC2 AMI from 2018
- An Alpine container you
kubectl exec'd into - A GCP COS node
- An ephemeral ECS task
- A bare-metal box at a colo running Debian 9
That portability is the point. The terminal is always there. Your dashboards may not be. At 2AM when Datadog is slow and the Kubernetes API is timing out and the on-call lead isn’t picking up — these nine commands are the things you can still rely on.
This is also why I think every SRE interview worth taking will ask you to debug a slow service over SSH with no observability tooling. (I’ve written about the actual SRE interview questions I’ve seen and how I answer them if you want the full list — these commands are about half of what came up across 9 interview loops.)
How to Actually Build the Muscle Memory
The only way to have these ready at 2AM is to use them before 2AM.
A few things that worked for me:
- Spin up a $5/month VPS. Run a deliberately broken Go service against it. Watch it die with these commands.
- After every incident, write down which command you reached for first. Compare it across postmortems. The pattern will surprise you.
- Build a personal runbook with the literal command strings you use — not the man-page variants. Include your team’s real port numbers and process names. Make it copy-pasteable at 3AM with one hand.
The engineers who stay calm during incidents aren’t smarter than you. They’ve just typed these commands more times.
Key Takeaways
uptime— direction of load, before anything else.top -c+1— which process is on fire, on which core.ss -s— socket state summary catches connection leaks in seconds.CLOSE_WAITis the most expensive one.lsof -p <pid> | wc -l— file descriptor count surfaces resource leaks fast.strace -p <pid> -c— syscall distribution reveals what the process is actually doing.iostat -xz 1 3—%utilandawaitdistinguish disk saturation from disk latency.df -ih— inode exhaustion looks identical to disk full, butdf -hwon't show it.vmstat 1 5— thewacolumn catches I/O wait when CPU looks "idle."dmesg -T | tail -50— the kernel always knows about OOM kills and hardware failures.
What’s Next
The next article in this series goes deep on tcpdump — the specific filters I use to debug network problems no APM can see. Including the one that found a service-mesh-induced packet loss in 3 seconds after 40 minutes of dashboard-staring.
If this article saved you a debugging session — a clap helps Medium show it to more on-call engineers who might need it. Follow me if you want the tcpdump deep-dive when it drops, and the rest of the Production Engineering Survival Guide series.
What command do you always type first? Drop it in the comments, I read every one and the list might change based on reader replies.

Thank you for being a part of the community
Before you go:
- Be sure to clap and follow the writer ️👏️️
- Follow us: LinkedIn | Medium | GitHub 🐙
- Join our Developers Global Community on Discord 🧑🏻💻
메타데이터
- post_id
- cd8e8a1328d7
- slug
- 9-linux-commands-ive-run-at-2am-more-times-than-i-can-count-cd8e8a1328d7
- url
- https://medium.com/developersglobal/9-linux-commands-ive-run-at-2am-more-times-than-i-can-count-cd8e8a1328d7
- canonical_url
- https://medium.com/developersglobal/9-linux-commands-ive-run-at-2am-more-times-than-i-can-count-cd8e8a1328d7
- author_url
- https://medium.com/@moizezzy.me
- status
- ok
- fetched_at
- 2026-07-09 09:01:30