Profiling Flutter Apps, Part 1: A Practical Workflow
Start with the right setup
Profiling Flutter apps (Part 1): A practical workflow

Flutter performance discussions usually begin with uncertain feedback:
“This screen feels slow.”
“The animation stutters”, or
“it is slow on older devices”.
The real challenge is not finding performance issues, but diagnosing them. We often end up making random optimizations: refactoring widgets, adding const, tweaking layout, hoping something improves, without understanding the root cause.
Smooth Flutter apps are built on a simple habit: measure under the right conditions, analyse the frame data, and optimise only once you’ve pinpointed the bottleneck.
Start with the right setup
Before you start opening any profiling tool, let’s make sure your setup is valid. Otherwise, everything that follows is useless.
There are three fundamental rules:
- Run the app in profile mode
- Always use a real physical device; do not use simulators
- Reproduce a specific interaction at a time.
Debug mode introduces extra work and can completely falsify performance. Simulators are useful for the development process, but they are not reliable indicators of real rendering performance.
If your measurement is wrong, so is your optimization.
Understand Frames in Flutter
Flutter renders your UI frame by frame, each with a limited time budget: approximately 16 milliseconds on 60 Hz devices and 8 milliseconds on 120 Hz devices. If a frame exceeds this budget, it gets dropped, which users perceive as stutter or jank.
The key mindset about frames is that they are divided into two main responsibilities:
- UI Thread: builds widgets, runs layout, and executes Dart code;
- Raster Thread: paints pixels and composes the scene.
When something feels sluggish, the real question is which part of the frame is using budget. Without this distinction, it’s difficult to pinpoint the problem.
Using Flutter DevTools to answer the right question
Opening DevTools for the first time can be overwhelming, with lots of data about each frame and a vast list of parameters.
The biggest mistake you can make is trying to understand everything at once. Instead, you can treat it as a diagnostic tool with a single goal: find a bad frame and figure out why it is slow.
Approach it this way:
1: Open the Performance view. 2: Start recording. 3: Perform the interaction you want to debug. 4: Stop recording. 5: Look for irregularities in the frame char.
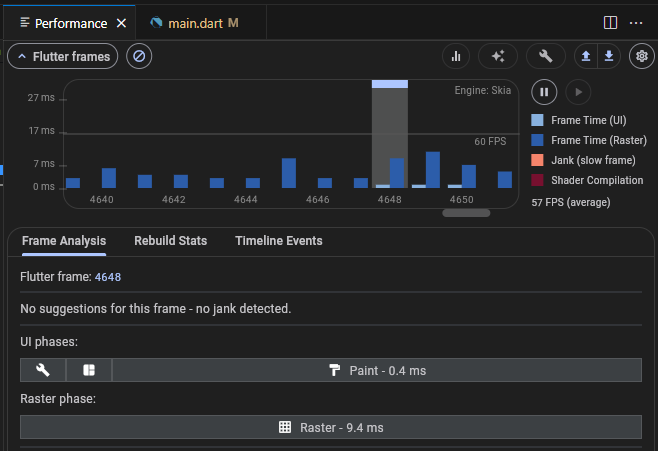
Once you find a red frame, select it and check the time spent in the UI thread and the Raster thread.
At this stage, it’s crucial to apply fixes one at a time, focusing on the slower thread. Applying multiple fixes will only complicate matters. After applying a fix, repeat the test process and note any differences. Without measuring after a fix, you can’t truly assess whether you’ve made any improvements.
DevTools offers many more panels, such as timeline events, flame charts, and CPU profiler, but you don’t need them all right away. Don’t worry, though, we’ll cover them in future articles.
A real example: Investigating a janky list
Let’s make this explanation clear with a simple scenario. You have a screen with a list of items, and everything looks fine at first. But as soon as you start scrolling, the UI stutters. Let’s apply the workflow instead of guessing.
Step 1: Reproduce and profile
- Run the app in profile mode
- Use a real device
- Open DevTools → Performance view
- Scroll the list for a few seconds
Step 2: Find a bad frame
Looking at the chart, you notice some red frames; let’s select one. Now check the breakdown:
- The UI thread is taking most of the time.
- The raster thread looks relatively stable.

Step 3: Form a hypothesis
Given that the issue happens during scrolling and the UI thread is busy, a likely cause is:
- Too many widgets are being built at once.
- Rebuilding more than necessary.
Step 4: Inspect the code
You look at the list implementation and find something like:
- a
Columnwith many children or large scrollable content - or a
ListViewwithout a builder - or a list where each item is doing heavy work in
build()
This confirms the hypothesis: The UI thread is overloaded because we’re building too much during scroll.
Step 5: Apply one fix
You replace the implementation with a lazy version, for example:
- switch to
ListView.builder - ensure items are lightweight
- avoid unnecessary rebuilds inside each item.
Step 6: Measure again
Run the same profiling steps and look at the frame chart again.
This time:
- frame times are more consistent
- no spikes
- UI thread work is significantly reduced
Conclusion
Most Flutter performance issues are not difficult to fix; they’re difficult to identify correctly. Once you follow this approach, performance work becomes faster, more predictable, and far less frustrating.
And that’s it; no magic tricks, just a better way to approach performance. Thanks for sticking through the article, and see you in the next one 👋
Some sources you might find interesting:
- Flutter performance profiling
- Performance best practices
- DevTools Performance view
- Why premature optimization is the root of all evil
If you liked this article, follow OverApp or visit our website.
by Sandro Tola, Mobile Developer at OverApp
메타데이터
- post_id
- cdbef7040795
- slug
- profiling-flutter-apps-part-1-a-practical-workflow-cdbef7040795
- url
- https://insights.overapp.com/profiling-flutter-apps-part-1-a-practical-workflow-cdbef7040795
- canonical_url
- https://insights.overapp.com/profiling-flutter-apps-part-1-a-practical-workflow-cdbef7040795
- author_url
- https://medium.com/@sandro.tola
- status
- ok
- fetched_at
- 2026-06-09 15:37:30