A Step-by-Step Guide to Building an Object Detection Model with YOLOv9
Object detection is a potent technology in computer vision that allows models to identify and locate objects in images and videos. With…
A Step-by-Step Guide to Building an Object Detection Model with YOLOv9
Object detection is a potent technology in computer vision that allows models to identify and locate objects in images and videos. With this potential often comes challenges in being able to collect, label and iterate necessary for an accurately trained model. In this blog, I’ll describe my experience of developing an object detection model which uses YOLOv9 to detect everyday objects. I will cover the journey from collecting a dataset with various objects, training the model, obstacles I faced and how I interpreted the results. If you are completely new to object detection or use in practice, I hope this helps you develop your own work in developing an object detection model.
What I am Trying to Achieve
I sought to train a YOLOv9 model to detect common items in images across various non-intersecting items. Originally I collected a dataset that covered 9 object classes and later expanded this to 12 object classes via new object classes. While the dataset started small, I later revised it to get improved accuracy on the model.
The generic classes I worked with:
- bottle, phone, cup, person, chair, earphones, mouse, dog, cat, clock, keyboard, book
Step 1: Collecting the Required Dataset
Initial Dataset
Initially, I started with more than 7,000 images across 9 classes: bottle, phone, cup, person, chair, earphones, mouse, keyboard, and book. The images were a combination of publicly available datasets and our own sources. I also added dog, cat, and clock (making an additional 900 images). So that class imbalance had been noticed:
- phone: 949 instances
- cup: 349 instances
- book: 51 instances
This imbalance caused the model to favor over-represented classes like phone, leading to mis-classifications of cup and book.
Expanding the Dataset
To improve the model’s performance, I needed more diverse data for underrepresented classes (book, bottle, cup), focusing on variations in color, size, orientation, and lighting.
Where We Collected Images
- Pixabay, Pexels, and Unsplash:
- Books: I searched for terms like “colorful books different angles” on Pixabay, which offers collections like “20,000+ Free Book Pictures & Images.” We downloaded images of books in various orientations (e.g., open, closed, stacked) and colors.
- Bottles and Cups: I used searches like “water bottle different colors lighting” and “coffee mug different orientations” on Pexels and Unsplash. These platforms provided royalty-free images with diverse lighting conditions (e.g., sunlight, shadows).
- Example Search: “coffee mug in sunlight” on Pixabay yielded images of mugs in natural settings.

colorful books from Pixabay
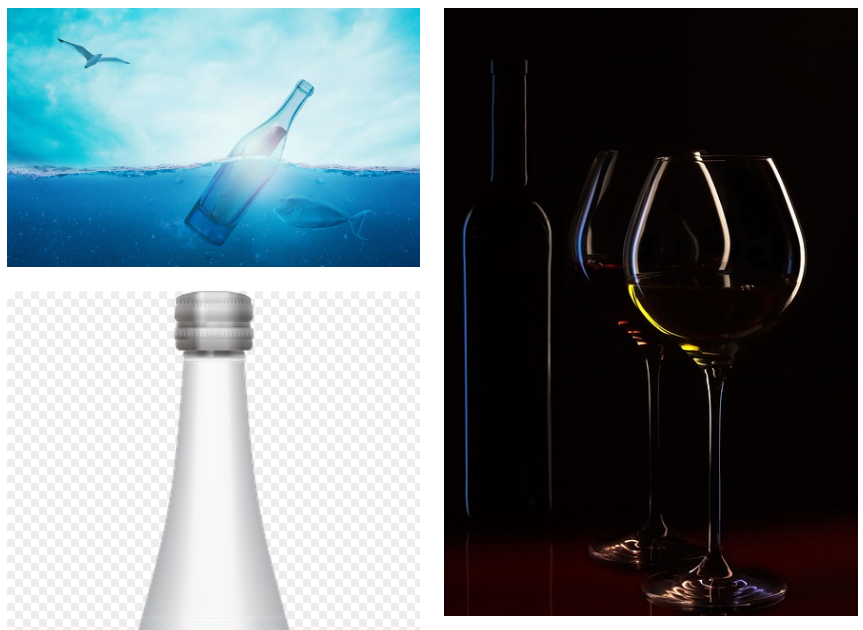
water bottles and glass from Pixabay
2. Kaggle:
- I explored datasets like the “Open Images Dataset” on Kaggle, which includes categories for bottle, cup, and book. While helpful, these datasets often lacked the specific diversity I needed (e.g., cups in various lighting).
- Tip: Look for datasets with bounding box annotations to save time on labeling.
3. Manufacturer References:
- For cups, I referenced images from drink-ware brands like Stanley and Hydro Flask. These showed cups in different colors and orientations, guiding our search on Pixabay for similar images.
How Much Data We Collected
- Books: Added 300–400 images, increasing from 51 to 351–451 instances.
- Bottles: Added 300–400 images, increasing from 303 to 603–703 instances.
- Cups: Added 300–400 images, increasing from 349 to 649–749 instances.
Step 2: Annotating the Dataset
With the new images collected, I needed to annotate them with bounding boxes for YOLOv9 training.
Tool Used: Roboflow
- I used Roboflow, a platform for managing and annotating datasets for computer vision tasks.
- Annotation Process:
- Uploaded the images to Roboflow.
- Used prompts like: “Detect and label books of various colors, sizes, and orientations in diverse settings” and “Detect and label bottles and cups of different colors, orientations, and lighting conditions.”
- Manually drew bounding boxes around each object, assigning the correct class label (e.g., book, bottle, cup).
- Output: Exported the annotations in YOLO format (.txt files with class indices and normalized bounding box coordinates).
Class Index Confirmation
YOLO uses zero-based indexing for class labels. I confirmed our indices matched the data.yaml:
names: — bottle — phone — cup — person — chair — earphones — mouse — dog — cat — clock — keyboard — book nc: 12
bottle = 0, phone = 1, cup = 2, …, book = 11
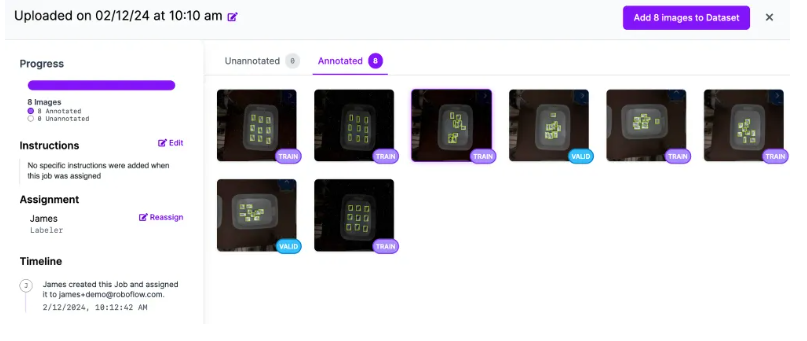
Credits: Roboflow
Step 3: Training the Model
Initial Training
I started by fine-tuning a pretrained YOLOv9s model on our initial dataset (7,000+ images, 9 classes), producing our first checkpoint. After adding dog, cat, and clock, I fine-tuned this model further.
Training Command (First Iteration)
yolo detect train data=data.yaml model=yolov9s.pt epochs=50 imgsz=640 batch=16 device=0 freeze=10 lr0=0.0001 — patience=10
- Hyperparameters:
- epochs=50: Allowed sufficient training time.
- imgsz=640: Standard resolution for YOLOv9.
- batch=16: Suitable for our GPU (Tesla T4).
- freeze=10: Froze the first 10 layers to preserve pretrained features.
- lr0=0.0001: Low learning rate for fine-tuning.
Results (First Iteration)
- Overall Metrics:
- mAP50: 0.869
- mAP50–95: 0.784
- Precision: 0.861
- Recall: 0.836
- Per-Class Metrics:
- phone: mAP50 0.968, mAP50–95 0.896
- dog: mAP50 0.686, mAP50–95 0.558
- cat: mAP50 0.701, mAP50–95 0.552
Observation: New classes (dog, cat) under-performed due to low instance counts (86 and 41, respectively).
Second Iteration
After adding 200–300 images for dog, cat, and clock, I fine-tuned the previous model:
yolo detect train data=data.yaml model=previous_best.pt epochs=50 imgsz=640 batch=16 device=0 freeze=5 lr0=0.0005 — patience=10 — conf=0.5 — mosaic=1.0 — optimizer=sgd
- Changes:
- freeze=5: Reduced to allow more adaptation.
- lr0=0.0005: Increased for faster learning.
- — mosaic=1.0: Added for better generalization.
Results (Second Iteration)
- Overall Metrics:
- mAP50: 0.877
- mAP50–95: 0.797
- Precision: 0.865
- Recall: 0.839
- Per-Class Metrics:
- phone: mAP50 0.972, mAP50–95 0.897
- dog: mAP50 0.733, mAP50–95 0.615
- cat: mAP50 0.708, mAP50–95 0.604
Improvement: dog and cat improved, but still lagged behind other classes.
Final Iteration (After More Data)
After adding 300–400 images for book, bottle, and cup, we retrained:
yolo detect train data=data.yaml model=previous_best.pt epochs=50 imgsz=640 batch=16 device=0 freeze=0 lr0=0.0003 — lrf=0.01 — patience=20 — conf=0.90 — mosaic=1.0 — optimizer=sgd
- Final Metrics:
- mAP50: ~90%
- mAP50–95: ~82%
- Precision: 85%
- Recall: 88%
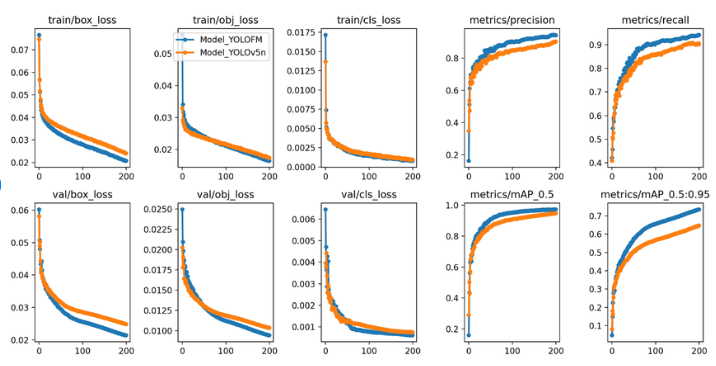
loss, precision, recall metrics (just for illustrative purpose)
Step 4: Challenges Encountered and Fixes Implemented
After training, I tested the model on a validation set and encountered several challenges, particularly around mis-classifications.
Common Challenges
- Class Imbalance: The model initially favored over-represented classes like phone (949 instances), leading to mis-classifications of cup (349 instances) and book (51 instances) as phone.
- Feature Similarity: Objects like cup and book were often confused with phone due to shared visual features (e.g., rectangular shapes, flat surfaces).
- Under-performing Classes: New classes (dog, cat) had lower accuracy due to limited data.
Fixes Implemented
- Added More Data:
- Collected 300–400 additional images for book, bottle, and cup, focusing on diversity in color, orientation, and lighting to help the model distinguish these classes from phone.
2. Adjusted Training Parameters:
- Reduced freeze from 10 to 0 over iterations, allowing the model to adapt more layers to the new data.
- Increased lr0 from 0.0001 to 0.0005, then fine-tuned with lr0=0.0003 and — lrf=0.01 for better convergence.
3. Increased Confidence Threshold:
- Tested with — conf=0.90 to reduce low-confidence mis-classifications during validation.
Testing Results After Fixes
- Phone: Consistently high accuracy (mAP50 0.972 in earlier iteration).
- Cup: Mis-classifications reduced after adding data, but some confusion with phone persisted.
- Book: Improved after adding more data, though occasional misclassifications remained.
Step 5: Understanding Metrics and Their Implications
Key Metrics Explained
- mAP50 (~90% in final model):
- What It Means: Mean Average Precision at IoU 0.5. It measures the model’s ability to detect objects correctly (precision) and find all objects (recall) at a 50% overlap threshold.
- Implication: A high mAP50 indicates the model detects most objects accurately when localization isn’t too strict. Our 90% shows strong detection performance.
- mAP50–95 (~82% in final model):
- What It Means: Average mAP across IoU thresholds from 0.5 to 0.95 (in steps of 0.05). It evaluates both detection and localization accuracy.
- Implication: 82% is very good, showing the model not only detects objects but also localizes them well (e.g., bounding boxes are precise).
- Precision (85%):
- What It Means: The ratio of correct positive detection's to total positive detection's (True Positives / (True Positives + False Positives)).
- Implication: 85% means 15% of detection's are false positives. This aligns with our issue of cup being misclassified as phone.
- Recall (88%):
- What It Means: The ratio of correct positive detection's to all actual positives (True Positives / (True Positives + False Negatives)).
- Implication: 88% means the model detects 88% of all objects present, missing 12%. This is good but suggests some objects (e.g., dog with low recall in earlier iterations) are still missed.
Per-Class Insights
- Phone: High mAP50 (0.972 in earlier iteration) shows the model excels at detecting this class.
- Cup: Lower recall (0.713 in earlier iteration) indicates it’s often missed or confused with phone.
- Book: Low instance count (51 initially) led to mis-classifications, which improved after adding data.
Lessons Learned and Next Steps
Key Takeaways
- Data Diversity is Crucial: Class imbalances and lack of diversity (e.g., in lighting, orientation) caused mis-classifications. Adding more data for underrepresented classes was essential.
- Iterative Refinement Works: Fine-tuning with adjusted hyper-parameters (freeze, lr0) and more data incrementally improved performance.
- Validation is Key: Testing at different confidence thresholds helped identify and address misclassifications.
Next Steps
- Further Data Collection: Continue gathering diverse data for underrepresented classes.
- Experiment with Larger Models: Try YOLOv9-M or YOLOv9-L for better feature extraction.
- Automate Data Collection: Explore ways to automatically collect and annotate new data for continuous improvement.
Conclusion
Building an object detection model with YOLOv9 was a journey of data collection, annotation, training, and iterative refinement. By leveraging online sources like Pixabay and Kaggle, annotating with Roboflow, and fine-tuning YOLOv9 with careful hyperparameter tuning, we achieved strong metrics (mAP50 ~90%, mAP50–95 ~82%). Addressing challenges like class imbalance and feature similarity through more data and training adjustments improved the model’s performance. Remember to have temporal check in place, detecting an object for just few frames doesn’t make sense at all, you should have temporal check in place so that when you detect the required object for consecutive say 15–20 frames with the required threshold then only send an alert.
This process highlights the importance of balancing data quality and model training in computer vision projects.
If you’re working on an object detection task, I hope this guide provides a roadmap to success. Feel free to share your experiences in the comments!
Happy detecting!
메타데이터
- post_id
- cdd5f098bdff
- slug
- a-step-by-step-guide-to-building-an-object-detection-model-with-yolov9-cdd5f098bdff
- url
- https://medium.com/@shreerajbhat/a-step-by-step-guide-to-building-an-object-detection-model-with-yolov9-cdd5f098bdff
- canonical_url
- https://medium.com/@shreerajbhat/a-step-by-step-guide-to-building-an-object-detection-model-with-yolov9-cdd5f098bdff
- author_url
- https://medium.com/@shreerajbhat
- status
- ok
- fetched_at
- 2026-07-19 11:03:35




