Building a Self-Healing Incident Response System with Elasticsearch Agent Builder and Vector Search
Author: Padmanabhan Rajendrakumar

Building QuantumState: A Self-Healing Incident Response System with Elasticsearch Agent Builder and Vector Search
Author: Padmanabhan Rajendrakumar | LinkedIn
Published: February 24, 2026
Disclaimer: This blog post was submitted to the Elastic Blogathon Contest and is eligible to win a prize.
Abstract
Production systems need more than noisy alerts. This post walks through building a fully autonomous incident response system using Elastic’s Agent Builder and ELSER vector search. By combining ES|QL, semantic search, and workflow execution, it drops MTTR from an hour to under four minutes in a simulated environment.
Introducing Elastic’s Agent Builder
Setting up observability agents usually means wrestling with external orchestration tools and managing multiple integrations. You end up moving data out of Elasticsearch, storing embeddings somewhere else, and triggering actions in yet another system. It adds latency, increases operational overhead, and makes the whole architecture fragile.
Elastic Agent Builder changes the game by letting you build agents right where your logs, metrics, and indices already live. You can tap into native tools like ES|QL and the built-in Index Search tool, which handles vector search via ELSER. You do not need a separate vector database or an external retrieval pipeline.
Agents can query live data, pull semantic context across your indices, and kick off Elastic Workflows in one unified spot.

Agent Builder — Home Screen

Agent Builder — Creating a New Agent Through Kibana UI
Agent Builder Official Documentation
The Problem: Production Incidents and Manual Remediation
We have all been there. A backend service is humming along fine, but memory usage slowly creeps up. Eventually it crosses a critical threshold, latency spikes, and error rates climb. At 3:00 AM, the pager goes off.
An SRE wakes up and has to:
- Check dashboards
- Query logs
- Correlate recent deployments
- Identify the root cause
- Decide whether to restart, rollback, or scale
- Verify the system actually recovered
Even with perfect observability, MTTR stays high because a human still has to interpret the data and act. The bottleneck is no longer detection — it is execution.
Introducing QuantumState

QuantumState is an autonomous incident response system built on top of Elastic’s Agent Builder. It uses four specialized AI agents to handle different phases of an incident lifecycle, and every query or decision happens right where the data sits.
The differentiator is semantic search. Standard monitoring relies on rigid thresholds and exact keyword matches. QuantumState indexes both historical incidents and runbooks using ELSER sparse embeddings for hybrid search that combines BM25 lexical scoring with semantic relevance.
Unlike dense embeddings, ELSER assigns weights only to semantically significant tokens, so hybrid scoring over Elasticsearch’s inverted index needs no separate vector store.
For example, if a current alert says “JVM heap climbing under load,” the system can pull up a past incident labeled “GC pressure from retained connection pool objects.” The wording is entirely different, but the root cause is the same. It applies the exact same logic to grab the right runbook procedure based on operational context, rather than relying on hardcoded mappings.
QuantumState takes an incident from detection all the way to verified recovery. The loop looks like this:
- Detect: Catch metric anomalies before failure
- Investigate: Correlate metrics, logs, and past incidents to find the root cause
- Execute: Check the runbooks and trigger a fix when confidence is high
- Verify: Make sure system health is back to normal
The Agent Swarm

The Agent Swarm
🔭 Cassandra: Detect
Cassandra monitors system metrics in real time. It uses dynamic baselines rather than static thresholds to catch patterns like memory leaks, latency drift, or error spikes early. When it spots an anomaly, Cassandra generates a structured context block describing the issue and its severity.
🔍 Archaeologist: Investigate
Archaeologist takes that anomaly, correlates it with logs and recent system activity to build a root cause hypothesis, and runs a semantic search across historical incidents to surface similar failures regardless of terminology.
⚕️ Surgeon: Resolve
Surgeon retrieves the most relevant procedures from a semantically searchable runbook library and, once confident, triggers a remediation workflow. The action is written to Elasticsearch, where the MCP Runner picks it up to execute the infrastructure operation.
🛡️ Guardian: Verify
Guardian verifies that system health has returned to baseline after the fix. If recovery conditions look good, the incident resolves; if not, it escalates.
The MCP Runner

The MCP Runner
The MCP Runner is the component that physically executes the fix. It continuously polls Elasticsearch for approved actions written by the agents and then performs the required operation. That could mean restarting a container, triggering a rollback, or scaling a dependency.
- No webhooks
- No external orchestration engines
- No separate automation platforms
Elasticsearch acts as the coordination layer and message bus. This keeps the architecture incredibly simple, auditable, and fully contained within the Elastic ecosystem.
Architecture & Pipeline Flow
Here is how the data flows at a high level:
- Metrics and logs stream continuously into Elasticsearch.
- The Agent Pipeline orchestrates the four specialized agents.
- When a fix is approved with a confidence score of 0.8 or higher, an Elastic Workflow triggers.
- The Workflow records the action to maintain an audit trail.
- The MCP Runner executes the infrastructure action.
- The Guardian agent verifies recovery and closes the incident.

Detection → Root Cause → Remediation → Verification → Closure
The result is a unified control plane: observability, decision-making, and execution in a single architecture.
Implementation: Building QuantumState
I recommend following along with the video guide as you work through this section:
[embed]QuantumState — Implementation & Setup Guide
QuantumState includes a React SRE Incident Control Panel that interacts with Agent Builder via the Kibana API to visualize agent reasoning in real time. There is also a local infrastructure stack that runs microservices, injects controlled faults, and generates live observability data.
The steps below walk through the full setup, from Elastic Cloud to a live remediation run.
We use the uv python package manager. Ensure you have uv installed on your system. Docs — Installation : uv
The full source code is on GitHub: github.com/padmanabhan-r/QuantumState
git clone https://github.com/padmanabhan-r/QuantumState.git
cd QuantumState
uv sync
Before running any of the scripts below, make sure your virtual environment is activated: source .venv/bin/activate. If you’re on Windows, use the equivalent commands
Step 1: Elastic Cloud Setup
The easiest way to get started is with an Elastic Cloud trial. It is free for 14 days and gives you a fully managed Elasticsearch and Kibana stack.
Once provisioned:
From the Elastic Cloud home page, find the Connection details section on your deployment and click Create API key and copy the key once generated. In the same panel, open the Endpoints tab and toggle Show Cloud ID and copy that value too. Add both to your .env file. The Kibana URL is derived automatically from the Cloud ID, so you do not need to set it separately. You will add a third field (REMEDIATION_WORKFLOW_ID) after Step 4.
ELASTIC_CLOUD_ID=My_Project:base64encodedstring==
ELASTIC_API_KEY=your_api_key_here==
Before running any setup scripts, enable both of these features in Kibana. In the left pane, go to Admin and Settings → Advanced Settings:
workflows:ui:enabled
agentBuilder:experimentalFeatures
After saving, reload the page.
Step 2: The Indices
QuantumState uses seven specific indices, all created automatically during setup. Here is what gets created and why:
**metrics-quantumstate** — Time-series CPU, memory, error rate, latency
**logs-quantumstate** — Application logs and deployment events
**incidents-quantumstate** — Full incident lifecycle records with ELSER semantic field
**agent-decisions-quantumstate** — Agent decision audit trail
**remediation-actions-quantumstate** — Action queue polled by the MCP Runner
**remediation-results-quantumstate** — Guardian verdicts and post-fix metrics
**runbooks-quantumstate** — Semantically searchable remediation procedure library
Step 3: Deploy ELSER
QuantumState uses ELSER to power semantic search for the Archaeologist’s historical incident lookup and the Surgeon’s runbook retrieval.
python elastic-setup/setup_elser.pyThis provisions the .elser-2-elasticsearch sparse embedding endpoint on your cluster. Run this before creating agents — two tools use ELSER-indexed Index Search, and Kibana validates those indices at tool creation time. The script is safe to re-run.
Step 4: Deploy the Remediation Workflow
python elastic-setup/workflows/deploy_workflow.pyThis script deploys elastic-setup/workflows/remediation-workflow.yaml to Kibana and prints the created workflow ID. Add that ID to your .env file. You can also just create the workflow manually in the Kibana UI by importing the yaml file.
REMEDIATION_WORKFLOW_ID=workflow-xxxxxxxx-xxxx-xxxx-xxxx-xxxxxxxxxxxxStep 5: Start the Application and Seed Baseline Data
cd frontend && npm install && cd ..
./start.sh
Open http://localhost:8080 and navigate to Simulation & Setup → Run Setup. This creates all seven Elasticsearch indices and seeds 100 historical incidents and 8 runbooks in a single pass. Both indices must exist before moving to the next step. Runbook seeding happens automatically here because ELSER was deployed in Step 3. If ELSER is not deployed, the two semantic indices will silently fail to create and runbooks will not be seeded.
In a real environment, a larger incident history and runbook library would give ELSER significantly more signal during semantic retrieval.

Simulation and Setup Control Panel
Step 6: Create the Agents and Tools
python elastic-setup/setup_agents.pyThis sets up all 13 tools and all 4 agents via the Kibana API in one run. Out of the 13 tools, 10 are ES|QL queries, 2 are semantic Index Search tools powered by ELSER, and 1 is the Workflow trigger. This script is also safe to re-run.
If you want to create the agents manually, you can find every agent ID, system prompt, tool assignment, and ES|QL query documented in agents-definition.md.
Verify in Kibana: Open Kibana → Agent Builder and confirm that all four agents appear with the correct tools assigned.
To tear everything down, just run:
python elastic-setup/setup_agents.py --delete
Agents Defined in Agent Builder
Step 7: Injecting Real Faults (Recommended)
Prerequisites: Docker must be installed and running before proceeding.
The infra/ directory contains a full local microservice environment wired together using Docker Compose. It includes four FastAPI services, a Redis dependency, a metrics scraper, and the MCP runner.
By running this stack, the data Cassandra analyzes is entirely real: actual container memory allocation, real error logs, and a real stop-and-restart to bring memory back down.
cd infra && docker compose up --buildOnce running, the scraper writes live health readings to metrics-quantumstate every 10 seconds.
You can inject a fault using the Local control panel:
uv run python infra/control.pyThe UI shows live health for all four services. Press 1 to inject a memory leak into the payment-service, 2 for an error spike into the auth-service, or 0 to reset.

Local Microservices Environment
If you inject a memory leak, the payment-service starts allocating 4MB every 5 seconds in its Python heap. The service emits error logs immediately on injection, then continues every 30 seconds as memory climbs.
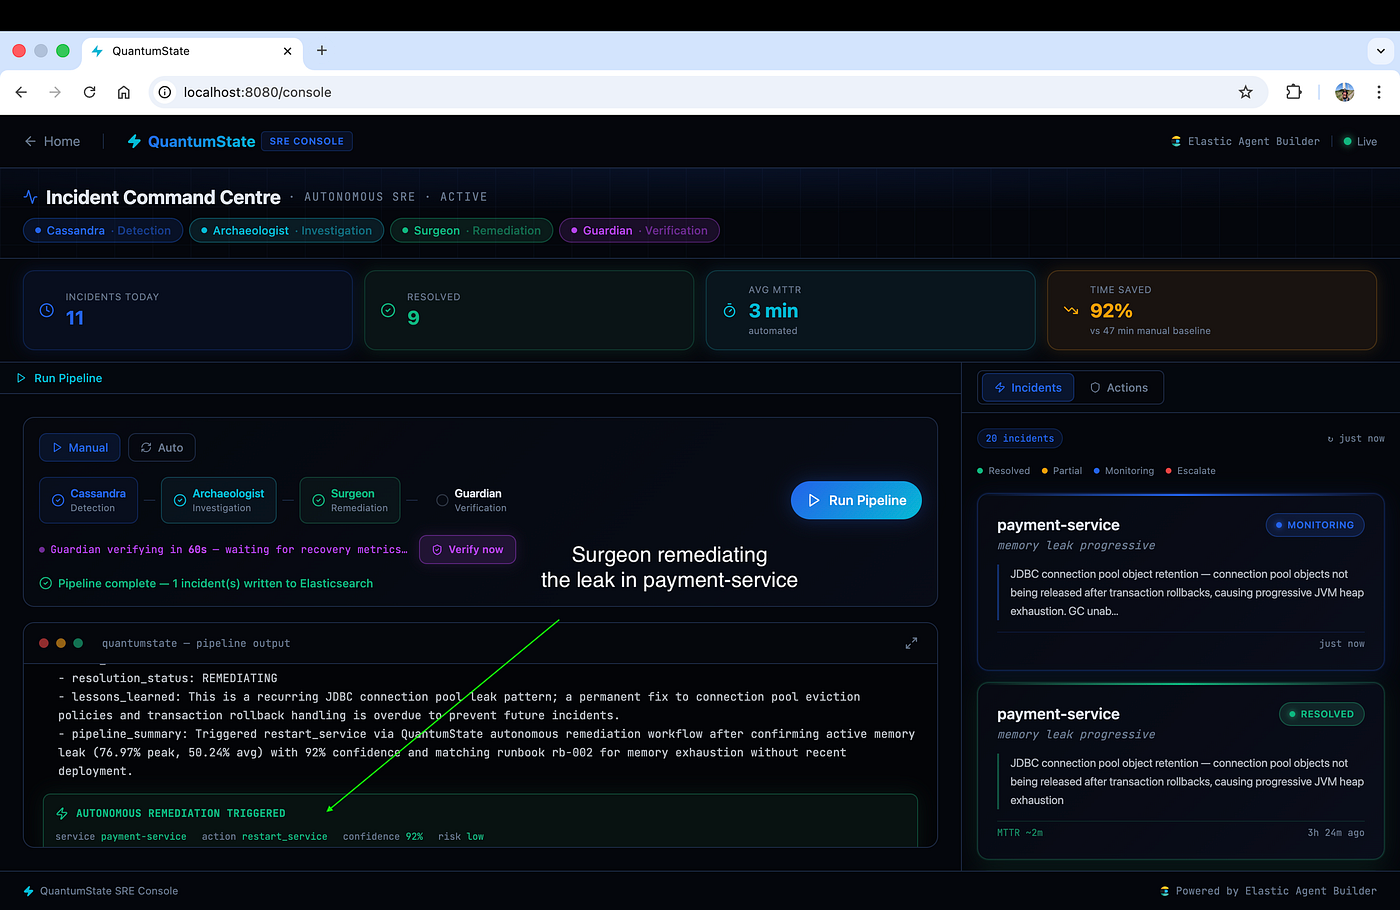
Surgeon will trigger remediation, the MCP Runner will stop and restart payment-service, and memory will drop back down. Finally, Guardian will verify the recovery using the post restart metrics.
No Docker? You can use the web console at http://localhost:8080 → Simulation & Setup to inject simulated anomalies without running the containers.
Step 8: Running the Pipeline
From the Console tab, click Run Pipeline. This kicks off the sequence: Cassandra → Archaeologist → Surgeon → Guardian. You can watch the agent reasoning stream live to the console.
Recommended sequence for testing:
- Start the Docker stack
- Wait 2 minutes for baseline metrics to gather
- Inject a fault
- Wait 60 to 90 seconds
- Click Run Pipeline

A Live Leak in payment-service
Surgeon Remediation

Guardian Verification

MCP Runner Restarting The Service
The pipeline runs end to end without human intervention.
Conclusion and Takeaways
QuantumState demonstrates that a fully autonomous incident response system can be built entirely within Elastic. No external LLM API keys. No separate vector database. No orchestration middleware.
Three capabilities make this possible: ES|QL for precise anomaly detection directly over live metrics; ELSER for semantic reasoning that matches meaning rather than keywords; and Agent Builder to coordinate the entire pipeline as native Kibana agents.
Key Takeaways:
- ELSER hybrid search eliminates brittle keyword matching for both incident recall and runbook retrieval: “heap exhaustion” matches “GC pressure” without any custom synonym configuration
- Agent Builder removes the need for external frameworks; the entire pipeline lives inside Elastic
- Elasticsearch serves simultaneously as data store, knowledge base, action queue, and audit trail
- The full architecture is reproducible against any Elastic Cloud deployment.
메타데이터
- post_id
- ce13d30a6d30
- slug
- building-a-self-healing-incident-response-system-with-elasticsearch-agent-builder-and-vector-search-ce13d30a6d30
- url
- https://medium.com/@padmanabhan-r/building-a-self-healing-incident-response-system-with-elasticsearch-agent-builder-and-vector-search-ce13d30a6d30
- canonical_url
- https://medium.com/@padmanabhan-r/building-a-self-healing-incident-response-system-with-elasticsearch-agent-builder-and-vector-search-ce13d30a6d30
- author_url
- https://medium.com/@padmanabhan-r
- status
- ok
- fetched_at
- 2026-06-26 03:39:16



