The Staircase That Lied About π
What a staircase can teach you about infinity, and the hidden assumptions behind limits
The Staircase That Lied About π
What a staircase can teach you about infinity, and the hidden assumptions behind limits
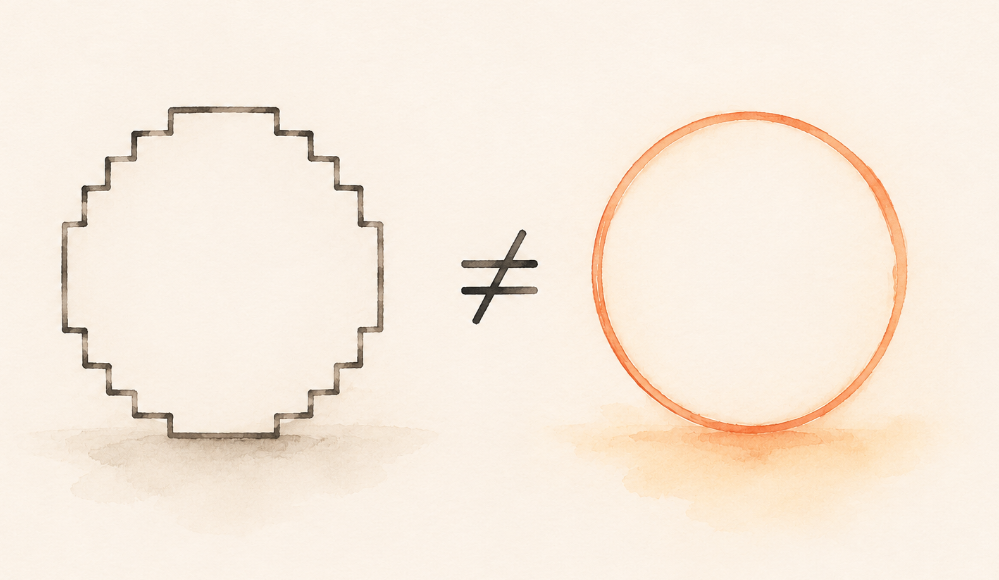
Photo generated with ChatGPT
Part 1: The “Proof” Most of us learn π early and never question it. It is the ratio of a circle’s circumference to its diameter, approximately 3.14159. It has been computed to trillions of decimal places. It might be, in some sense, one of the most well-verified numbers in human history.
So it is a little unsettling when a simple geometric argument suggests it might equal 4.
Take a circle with diameter 1. Its circumference is, by definition, π. Now place it snugly inside a square. The square has side 1, so its perimeter is exactly 4.
We fold the four corners of the square inward, toward the circle. The shape becomes a jagged staircase. But here is the key observation: we have not added or removed any material. We simply rearranged the same horizontal and vertical segments. The perimeter is still exactly 4.
We fold again. More steps, each one smaller. Still 4.
And again. Still 4.
As we keep folding, the staircase begins to hug the circle more and more tightly. At n = 48, the two shapes are visually indistinguishable to the naked eye.

And yet at every single step, the perimeter of the staircase was exactly 4. If the staircase becomes the circle in the limit, then the circle must also have perimeter 4. And since the circle has diameter 1, that means π = 4.
Something has gone badly wrong. But what?
Part 2: The Same Trick, Twice Before we look for the error, it is worth noticing that the argument we just made has a dangerous quality: it feels airtight. We did not divide by zero. We did not make an algebraic slip. Each individual step was completely legitimate. And yet we arrived at nonsense.
This is a sign that something is wrong at a deeper level. And the best way to see it is to notice that the exact same argument can be used to prove something even more absurd.
Consider any smooth curve you like; let’s say a sine wave and approximate it with a staircase, exactly as we did with the circle. At each step, the staircase is made entirely of horizontal and vertical segments. Horizontal segments have zero slope. Vertical segments have infinite slope. As n grows, the staircase converges to the curve. So, by the same logic we used before, the curve must also have zero slope everywhere. In other words: every smooth curve is secretly a flat horizontal line.
This is obviously false. But the argument is identical in structure to our π = 4 proof. Which tells us something important: the error is not specific to circles or to π. It is a general trap, one that appears whenever we assume that a property of a sequence must also be a property of its limit. The staircase converges to the circle. But that does not mean everything about the staircase converges to the corresponding thing about the circle.
The question is: which properties survive the limit, and which do not? That is what we turn to next.
Part 3: Two Ways to Measure Distance Before we return to the circle, let us think about something simpler. Imagine you want to travel from point A to point B on a flat plane. The straight line between them has length 5, a simple application of Pythagoras, with horizontal distance 3 and vertical distance 4, giving √(3²+4²) = 5. But now imagine you can only move horizontally or vertically, like a rook in chess. You go right 3, then up 4. Total distance: 7.
And what about breaking the journey into smaller steps? Right 1.5, up 2, right 1.5, up 2. Still 7. You could take a thousand steps, each microscopic. Still 7. No matter how fine your grid becomes, the total horizontal-plus-vertical distance is always exactly 3 + 4 = 7.

This is not a coincidence. It reveals something fundamental: horizontal-and-vertical distance and straight-line distance are measuring different things entirely. Mathematicians call them different metrics. The straight-line distance, known as Euclidean distance, measures the shortest possible path, the line you would draw with a ruler. The horizontal-plus-vertical distance, known as Manhattan distance and named after the grid-like streets of New York, measures total horizontal displacement plus total vertical displacement, added separately. The key difference is this: Euclidean distance exploits diagonal shortcuts via Pythagoras. Manhattan distance cannot. You are forever confined to the grid.
Now return to the circle. Every staircase perimeter is a Manhattan measurement, a sum of horizontal and vertical segments. That total is always exactly 4, regardless of how many steps we take. The circumference of the circle, π, is a Euclidean measurement. It is the actual length of a curved path, full of diagonal shortcuts that the staircase can never take.
These two quantities are simply measuring different things. No matter how closely the staircase looks like the circle, no matter how many steps we add, the staircase will always give 4 and the circle will always give π. The visual convergence is real. The convergence of perimeters is an illusion.
This is the error in our proof. It is not a calculation mistake, nor a sleight of hand, but a conceptual one: we assumed that because two shapes become identical, every property of those shapes must also become identical. In the language of mathematics, we confused the limit of the perimeters with the perimeter of the limit. These are not the same thing, and the difference between them is the subject of the final part of this article.
Part 4: Limits Have Limits So what exactly went wrong in our proof? Not arithmetic. Not a hidden assumption buried in a footnote. The error is conceptual, and it has a name: we confused the limit of the perimeters with the perimeter of the limit. In plain English, we assumed that because the staircases converge to the circle, their perimeters must converge to the circle’s perimeter.
This feels completely reasonable. And it is completely false.
To see why, think about what the staircase is actually doing at each step. As n grows, the staircase gets closer and closer to the circle in terms of position, with every point on the staircase within a tiny distance of the circle. But the staircase never stops being a staircase. At n = 1000, you have 4000 tiny horizontal and vertical segments. At n = 1,000,000, you have four million even tinier ones. The shape looks smooth. But zoom in far enough, and it is always jagged. The direction of travel, what a mathematician would call the derivative, never converges to the circle’s direction.
A brief note on derivatives, for those who, like me, have not touched calculus in a while.
Think of driving along a curve. The derivative at any point is simply the direction you are facing at that moment, nothing more. On a smooth curve like a circle, your direction rotates continuously and smoothly as you drive. On a staircase, you face either directly right or directly up, and at every corner you turn abruptly by exactly 90 degrees. No matter how small the steps become, you are always making sharp right-angle turns. You never face diagonally. The staircase driver and the circle driver are having completely different experiences, even when their paths look identical from above.
The thing here is that arc length cares deeply about direction. A path that constantly jerks between horizontal and vertical covers more ground than one that flows diagonally, even if the two paths visit almost exactly the same points. This is precisely the gap between 4 and π.
This is not a curiosity unique to circles. The same error would allow you to “prove” that any smooth curve has a flat derivative everywhere, that sine waves are straight lines, that parabolas are constant. Any smooth curve can be approximated visually by staircases. But the derivative of a staircase is always zero or undefined, never the smooth rotating derivative of the curve it approximates. Visual convergence and derivative convergence are simply different things, and confusing them leads to nonsense every time.
Mathematicians have a precise way of saying this. For the perimeter to be preserved in the limit, you need not just the curves to converge, but their derivatives to converge too. This is called C¹ convergence. Our staircase achieves the first and fails the second, completely, at every step, no matter how large n becomes.
Mathematics is full of moments like this, where intuition leads confidently in the wrong direction. The lesson is not to distrust intuition, but to interrogate it. When you say “in the limit”, you have to specify: limit of what, in what sense, and which properties are guaranteed to survive the journey.
The staircase looks like the circle. In one precise sense, it is the circle. In another equally precise sense, it is as different from the circle as a grid of Manhattan streets is from a line drawn with a ruler.
And that, in the end, is what makes mathematics both maddening and beautiful. The words “getting closer” are not enough. You have to say what you mean, exactly.
Appendix: Down below you can see the code used to generate the above articles. Feel free to use them in any IDE and reproduce and play around with the parameters.
import numpy as np
import matplotlib.pyplot as plt
import matplotlib.patches as patches
from matplotlib.lines import Line2D

def build_staircase(cx, cy, R, n):
    """Build staircase approximation of circle with n steps per quadrant."""
    pts_x, pts_y = [], []
    for q in range(4):
        for k in range(n):
            t0 = (q * n + k) * np.pi / (2 * n)
            t1 = (q * n + k + 1) * np.pi / (2 * n)
            x0 = cx + R * np.cos(t0)
            y0 = cy + R * np.sin(t0)
            x1 = cx + R * np.cos(t1)
            y1 = cy + R * np.sin(t1)
            if len(pts_x) == 0:
                pts_x.append(x0)
                pts_y.append(y0)
            dA = np.sqrt((x1 - cx)**2 + (y0 - cy)**2)
            dB = np.sqrt((x0 - cx)**2 + (y1 - cy)**2)
            if dA >= dB:
                pts_x.append(x1); pts_y.append(y0)
            else:
                pts_x.append(x0); pts_y.append(y1)
            pts_x.append(x1); pts_y.append(y1)
    pts_x.append(pts_x[0]); pts_y.append(pts_y[0])
    return np.array(pts_x), np.array(pts_y)

panels = [
    (1,  "n = 1",  "4 steps"),
    (4,  "n = 4",  "16 steps"),
    (12, "n = 12", "48 steps"),
    (48, "n = 48", "192 steps"),
]

fig, axes = plt.subplots(2, 2, figsize=(6, 7))  # 2x2, σχεδόν τετράγωνο
fig.patch.set_facecolor('white')

R = 1.0
cx, cy = 0.0, 0.0
BLUE       = "#185FA5"
AMBER      = "#BA7517"
AMBER_FILL = "#FAEEDA"

for ax, (n, title, subtitle) in zip(axes.flatten(), panels):
    ax.set_aspect('equal')
    ax.set_xlim(-1.35, 1.35)
    ax.set_ylim(-1.55, 1.35)
    ax.axis('off')
    ax.set_facecolor('white')

    # staircase
    sx, sy = build_staircase(cx, cy, R, n)
    ax.fill(sx, sy, color=AMBER_FILL, alpha=0.6, zorder=1)
    ax.plot(sx, sy, color=AMBER, linewidth=2.0 if n <= 4 else 1.2, zorder=2)

    # circle
    theta = np.linspace(0, 2 * np.pi, 500)
    ax.plot(np.cos(theta), np.sin(theta), color=BLUE, linewidth=2, zorder=3)

    # border box
    rect = patches.FancyBboxPatch(
        (-1.32, -1.52), 2.64, 2.74,
        boxstyle="round,pad=0.05", linewidth=0.8,
        edgecolor="#cccccc", facecolor="none", zorder=0
    )
    ax.add_patch(rect)

    # labels
    ax.text(0, -1.18, title, ha='center', va='center',
            fontsize=13, color='#555555')
    ax.text(0, -1.32, subtitle, ha='center', va='center',
            fontsize=11, color='#888888')
    ax.text(0, -1.47, "perimeter = 4", ha='center', va='center',
            fontsize=12, color=AMBER, fontweight='bold')

# legend
legend_elements = [
    Line2D([0], [0], color=AMBER, linewidth=2, label='staircase (perimeter = 4, always)'),
    Line2D([0], [0], color=BLUE,  linewidth=2, label='circle (circumference = π ≈ 3.14159)'),
]
fig.legend(handles=legend_elements, loc='lower center', ncol=2,
           fontsize=11, frameon=False, bbox_to_anchor=(0.5, 0.0))

plt.tight_layout(rect=[0, 0.05, 1, 1])
plt.savefig("staircase_paradox.png", dpi=120, bbox_inches='tight', facecolor='white')
plt.show()

###############################################
###############################################
###############################################

fig, axes = plt.subplots(1, 2, figsize=(12, 5))
fig.patch.set_facecolor('white')

BLUE  = "#185FA5"
AMBER = "#BA7517"

for ax in axes:
    ax.set_xlim(-0.5, 4.5)
    ax.set_ylim(-0.5, 5)
    ax.set_aspect('equal')
    ax.axis('off')
    ax.set_facecolor('white')

Ax, Ay = 0, 0
Bx, By = 3, 4

# ---- LEFT: Euclidean ----
ax = axes[0]

ax.annotate("", xy=(Bx, By), xytext=(Ax, Ay),
            arrowprops=dict(arrowstyle="-|>", color=BLUE, lw=2))

ax.annotate("", xy=(Bx, Ay), xytext=(Ax, Ay),
            arrowprops=dict(arrowstyle="<->", color='#aaaaaa', lw=1))
ax.text(Bx/2, -0.3, '3', ha='center', fontsize=11, color='#888888')

ax.annotate("", xy=(Bx, By), xytext=(Bx, Ay),
            arrowprops=dict(arrowstyle="<->", color='#aaaaaa', lw=1))
ax.text(Bx+0.25, By/2, '4', ha='left', fontsize=11, color='#888888')

sq = patches.Rectangle((Bx-0.18, Ay), 0.18, 0.18,
                        linewidth=0.8, edgecolor='#aaaaaa', facecolor='none')
ax.add_patch(sq)

ax.plot(Ax, Ay, 'o', color=BLUE, markersize=8, zorder=5)
ax.plot(Bx, By, 'o', color=BLUE, markersize=8, zorder=5)
ax.text(Ax-0.3, Ay, 'A', fontsize=13, fontweight='bold', color=BLUE, va='center')
ax.text(Bx+0.15, By, 'B', fontsize=13, fontweight='bold', color=BLUE, va='center')
ax.text(Bx/2 - 0.45, By/2 + 0.2, '√(3²+4²) = 5', fontsize=11,
        color=BLUE, rotation=53, ha='center')

ax.set_title('Euclidean distance = 5', fontsize=13, color=BLUE, pad=12)

# ---- RIGHT: Manhattan ----
ax = axes[1]

xs = [0, 1, 1, 2, 2, 3, 3]
ys = [0, 0, 4/3, 4/3, 8/3, 8/3, 4]

ax.plot(xs, ys, color=AMBER, lw=2.5, zorder=3)
ax.annotate("", xy=(xs[-1], ys[-1]), xytext=(xs[-2], ys[-2]),
            arrowprops=dict(arrowstyle="-|>", color=AMBER, lw=2.5))

ax.text(0.5, -0.3, '1', ha='center', fontsize=11, color='#888888')
ax.text(1.5, -0.3, '1', ha='center', fontsize=11, color='#888888')
ax.text(2.5, -0.3, '1', ha='center', fontsize=11, color='#888888')
ax.text(3.25, 4/3/2, '4/3', ha='left', fontsize=10, color='#888888')
ax.text(3.25, 4/3 + 4/3/2, '4/3', ha='left', fontsize=10, color='#888888')
ax.text(3.25, 8/3 + 4/3/2, '4/3', ha='left', fontsize=10, color='#888888')

ax.plot(0, 0, 'o', color=AMBER, markersize=8, zorder=5)
ax.plot(3, 4, 'o', color=AMBER, markersize=8, zorder=5)
ax.text(-0.3, 0, 'A', fontsize=13, fontweight='bold', color=AMBER, va='center')
ax.text(3.15, 4.15, 'B', fontsize=13, fontweight='bold', color=AMBER, va='center')
ax.text(1.0, 4.6, '3 + 4 = 7  (always, regardless of steps)', fontsize=11,
        color=AMBER, ha='center')

ax.set_title('Manhattan distance = 7', fontsize=13, color=AMBER, pad=12)

plt.suptitle('Two ways to measure distance from A to B',
             fontsize=14, color='#333333', y=1.01)
plt.tight_layout()
plt.savefig("ab_distance.png", dpi=180, bbox_inches='tight', facecolor='white')
plt.show()
메타데이터
- post_id
- ce5b2e9de1d2
- slug
- the-staircase-that-lied-about-π-ce5b2e9de1d2
- url
- https://medium.com/think-art/the-staircase-that-lied-about-%CF%80-ce5b2e9de1d2
- canonical_url
- https://medium.com/think-art/the-staircase-that-lied-about-%CF%80-ce5b2e9de1d2
- author_url
- https://medium.com/@ownedbyphysics
- status
- ok
- fetched_at
- 2026-07-15 10:47:00