How I Analysed a Healthcare Dataset Using Power BI
INTRODUCTION
How I Analysed a Healthcare Dataset Using Power BI
Photo by National Cancer Institute on Unsplash
INTRODUCTION
The analysis focuses on key healthcare performance indicators such as patient demographics, prevalent medical conditions, hospital performance, treatment costs, revenue patterns, and service efficiency. By leveraging Power BI’s data visualization and analytical capabilities, the report identifies trends, patterns, and areas requiring improvement within the healthcare system.
The findings from this analysis are intended to support healthcare administrators, policymakers, and medical professionals in making data-driven decisions that enhance service delivery, improve patient satisfaction, and strengthen overall healthcare performance. Through clear visual representation and actionable insights, this report demonstrates how business intelligence tools like Power BI can contribute to more effective healthcare management and strategic planning.
Objectives
- To analyze patient demographics (age, gender) and understand population distribution across healthcare services
- To identify prevalent medical conditions and assess their impact on overall healthcare demand
- To evaluate hospital performance and admission trends across different facilities
- To examine treatment costs and revenue patterns to uncover financial insights
- To detect patterns and correlations between age groups, conditions, and healthcare utilization
- To provide data-driven insights and actionable recommendations for improving healthcare planning and decision-making
Work-done
1. Data Collection
- Imported dataset into Power BI Desktop from available sources
- Verified structure of patient, hospital, and financial data fields
2. Data Cleaning (Power Query Editor)
- Used Power Query to handle missing values, duplicates, and inconsistent entries
- Changed data types (e.g., dates, currency, categorical fields)
- Renamed columns and ensured data consistency across tables
3. Data Transformation (Power Query)
- Created custom columns (e.g., age groups, calculated durations)
- Performed column splitting, merging, and formatting where necessary
- Applied filtering and grouping to refine the dataset
- Loaded the cleaned and transformed data into the model
4. Data Modeling
- Established relationships between tables (where applicable)
- Created calculated columns and DAX measures (e.g., Total Revenue, Average Cost, Patient Count)
5. Data Analysis (DAX & Visual Exploration)
- Used DAX functions to compute KPIs and aggregations
- Analyzed trends by age group, gender, and medical conditions
- Explored cost variations and hospital performance metrics
6. Data Visualization
I created 2 dashboards to showcase the analysis done:
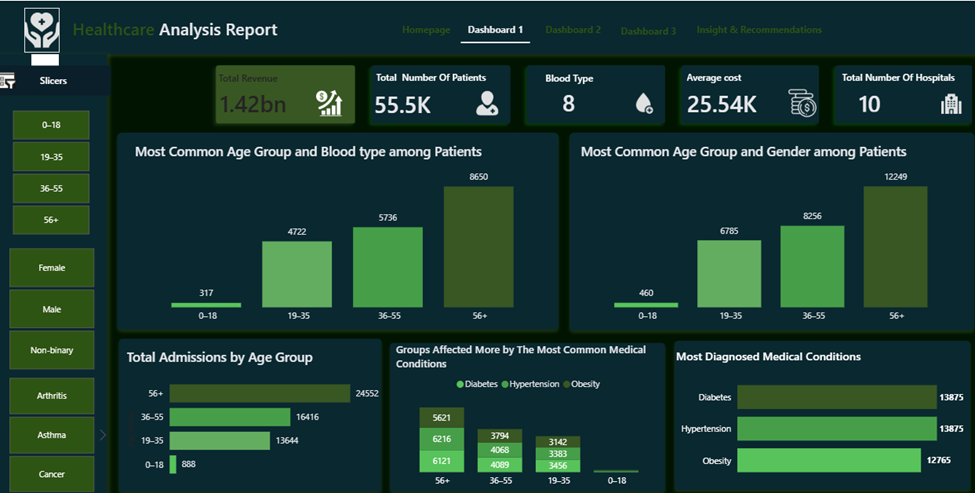

Dashboard 1 & 2
7. Insights
Population Drives Healthcare Demand
The 56+ age group has the highest admissions (24,552) and patient count across charts.
Chronic Diseases Dominate Diagnoses
Diabetes and Hypertension (13,875 cases each) are the most diagnosed conditions, followed by Obesity (12,765).
Middle-to-Older Age Groups Are Most Affected
Ages 36–55 and 56+ show the highest prevalence across Diabetes, Hypertension, and Obesity.
Gender Distribution Shows Higher Female Representation in Older Groups The female population peaks at 12,249 in the 56+ group, higher than other segments.
7. Recommendations
Prioritize geriatric care services, including chronic disease management programs, specialized staff training, and expanded elderly-friendly facilities to handle growing demand.
Implement preventive healthcare initiatives such as lifestyle education, early screening programs, and community wellness campaigns to reduce long-term treatment costs.
Develop targeted intervention programs (e.g., routine checkups, fitness plans, dietary counseling) specifically for these age brackets to curb disease progression.
Design gender-sensitive healthcare policies, including screenings and awareness programs tailored to women’s health needs, especially in older age groups.
Thank you for reading through, you can contact me to know more about this project or if you would like to know more about my services.
You can send me a mail directly here
메타데이터
- post_id
- ceea3b4f7fd9
- slug
- how-i-analysed-a-healthcare-dataset-using-power-bi-ceea3b4f7fd9
- url
- https://medium.com/@koladeabu05/how-i-analysed-a-healthcare-dataset-using-power-bi-ceea3b4f7fd9
- canonical_url
- https://medium.com/@koladeabu05/how-i-analysed-a-healthcare-dataset-using-power-bi-ceea3b4f7fd9
- author_url
- https://medium.com/@koladeabu05
- status
- ok
- fetched_at
- 2026-06-09 15:37:30




