Designing an Isolated SOC Lab (Part 3): SIEM Engineering and Custom Data Parsing in Splunk
In the first two phases of this lab build, we engineered an isolated virtual network, deployed Suricata at the perimeter, and successfully…
Designing an Isolated SOC Lab (Part 3): SIEM Engineering and Custom Data Parsing in Splunk

In the first two phases of this lab build, we engineered an isolated virtual network, deployed Suricata at the perimeter, and successfully blocked simulated reconnaissance from an external threat actor. However, having a firewall drop a malicious packet is only half the battle in modern security operations.
Security appliances like firewalls and IPS engines are designed to route traffic and enforce rules; they are not designed for long-term data storage or complex querying. If an analyst cannot see, search for, and correlate those dropped packets with historical data, the defense is essentially flying blind. To transition from basic network administration to true security operations, we must ingest our perimeter telemetry into a centralized database.
This final article details how I engineered a remote logging pipeline, shipped unstructured pfSense data into Splunk Enterprise, and utilized Regular Expressions (Regex) to transform raw firewall logs into structured, searchable fields.
Building the Syslog Forwarding Pipeline
To get telemetry off the firewall and into our SIEM, we need a lightweight, continuous data stream. pfSense manages its firewall telemetry through a native FreeBSD utility called filterlog. To push this data across the network, I utilized the syslog protocol.
- The pfSense Emitter: Inside the pfSense GUI (Status > System Logs > Settings), I enabled remote logging. I configured the firewall to stream all core filter and package events to the internal IP address of our Ubuntu Splunk VM (192.168.1.101). I opted to send this data over UDP port 514. UDP is a connectionless protocol, meaning it doesn't require a 3-way handshake or acknowledgment for every log sent. This drastically reduces processing overhead on the firewall.
- The Splunk Receiver: On the SIEM side, I opened the Splunk web interface, navigated to Settings > Data Inputs > UDP, and configured a new listener on port 514, assigning the incoming stream the standard syslog sourcetype.
Troubleshooting Data Ingress: Initially, the Splunk search interface remained blank. To determine where the pipeline was broken, I dropped into the Ubuntu server’s terminal and ran a packet capture using sudo tcpdump -i ens33 udp port 514. The capture proved that the firewall logs were physically reaching the Ubuntu Network Interface Card (NIC), indicating that pfSense was doing its job.
The issue was the host operating system. Ubuntu’s Uncomplicated Firewall (UFW) was active and silently dropping the packets before Splunk could index them. Running a simple bypass command: sudo ufw allow 514/udp, opened the local port, and raw logs immediately began streaming into the SIEM dashboard.
The Challenge of Unstructured Data
Getting the data into Splunk is just the infrastructure phase. Once the logs arrived, a major analytical obstacle emerged. Splunk recognized the outer syslog wrapper, it accurately parsed the event timestamp and the firewall’s internal LAN IP (192.168.1.1) as the host.
However, the actual meat of the log payload was completely unstructured. A standard pfSense filterlog message is formatted as a dense, comma-separated string that looks like this:

Splunk had no native understanding of what those internal commas meant. The firewall generates these fields in a strict order: Rule Number, Interface, Action, Direction, IP Version, Protocol, Source IP, Destination IP, Source Port, Destination Port.
Because Splunk didn’t know this schema, the critical indicators of compromise (IoCs), specifically our Kali Linux Attacker’s IP (192.168.154.131) and the target Gateway IP (192.168.154.137) were trapped as plain text. Without structured fields, you cannot run aggregations, build dashboards, or filter out noise.
Custom Field Extraction via Regular Expressions (Regex)
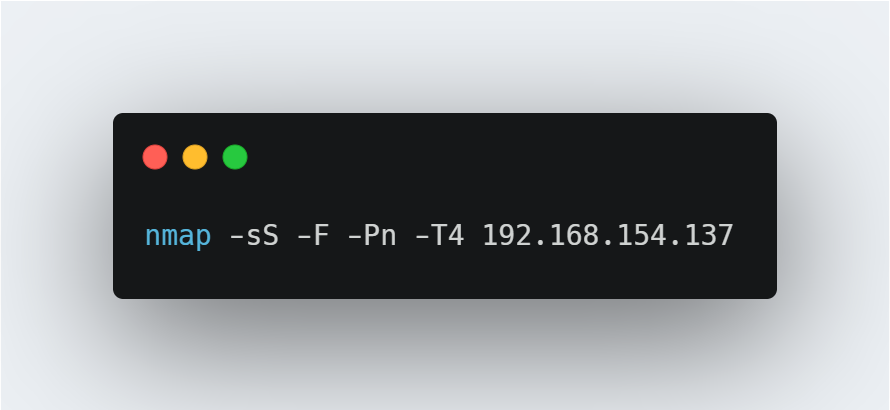
To resolve this, I needed to teach Splunk how to read a pfSense firewall log. I opened Splunk’s built-in Interactive Field Extractor (IFX), selected an attack log generated by our Nmap scan, and utilized Regular Expressions (Regex) to map out the exact token positions within the comma-delimited string.

Rather than relying on Splunk to guess, I generated capture groups to isolate the specific comma positions. I trained Splunk to permanently extract two custom keys across the entire syslog index:
- src_ip: The originating threat actor (grabbing the 19th position in the CSV string).
- dest_ip: The target gateway interface (grabbing the 20th position).
Once I saved the extraction rules, the data transformation was immediate. Splunk applied this logic at search time to every single log in the database.
Operational Data Analytics: Splunk Processing Language (SPL)
With our fields properly structured, we are no longer limited to basic keyword searches. We can now use Splunk Processing Language (SPL) to generate high-level security metrics and threat intelligence.
During a live incident investigation, an analyst doesn’t have time to read thousands of raw lines of text. They need immediate answers. Here are two examples of how structuring our data allows for rapid operational analytics:
1. Identifying the Most Aggressive Threat Actors To generate a top-down leaderboard of active adversaries hitting the perimeter, I executed:
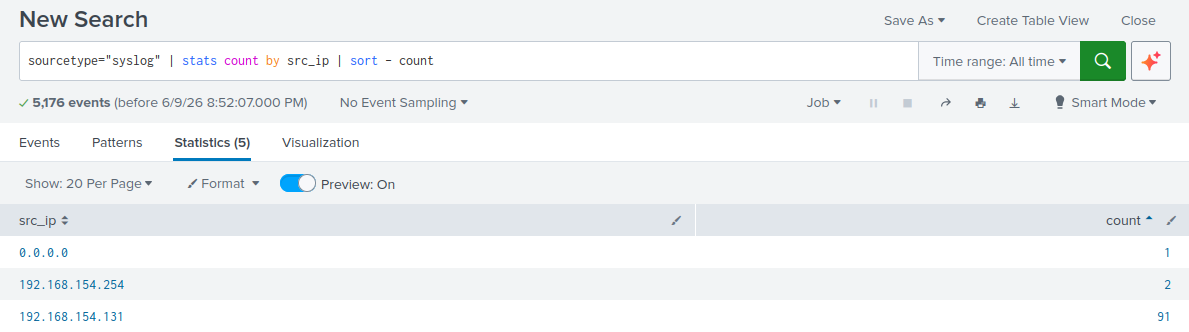
Because of our custom Regex, Splunk filters the entire dataset by the src_ip token, calculates the exact event frequency for each unique address, and outputs a clean table of the loudest attackers on the network.
2. Tracking Target Destinations To understand exactly which of our internal assets the attacker is trying to reach, we can pivot the search:
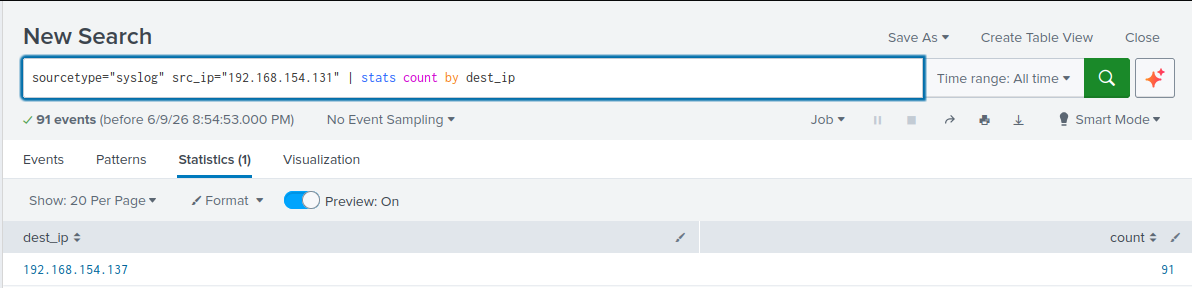
This isolates the behavior of a specific malicious IP, revealing exactly which internal servers or gateway interfaces they are prioritizing in their scans.
Final Retrospective
Building this end-to-end security lab provided a thorough, practical breakdown of modern defensive operations. By architecting the virtual infrastructure, configuring the IPS perimeter, and engineering the SIEM data ingestion pipeline, I experienced the real-world technical hurdles that security teams navigate daily.
This project reinforced three core engineering truths:
- Routing is foundational: You cannot analyze security telemetry if the underlying Layer 2 and Layer 3 architecture is broken.
- Firewalls are literal: They execute rules exactly as defined. Misinterpreting default behaviors (like RFC 1918 rules) can completely blind your defensive tools.
- Data requires structure: Accumulating massive quantities of log data is functionally useless unless you properly parse, extract, and refine that data into searchable intelligence.
This sandbox now stands as a permanent, scalable testbed for writing custom IDS alerts, analyzing advanced network payloads, and developing complex SIEM dashboards.
메타데이터
- post_id
- cf0aafa656ea
- slug
- designing-an-isolated-soc-lab-part-3-siem-engineering-and-custom-data-parsing-in-splunk-cf0aafa656ea
- url
- https://medium.com/@bharhanu/designing-an-isolated-soc-lab-part-3-siem-engineering-and-custom-data-parsing-in-splunk-cf0aafa656ea
- canonical_url
- https://medium.com/@bharhanu/designing-an-isolated-soc-lab-part-3-siem-engineering-and-custom-data-parsing-in-splunk-cf0aafa656ea
- author_url
- https://medium.com/@bharhanu
- status
- ok
- fetched_at
- 2026-06-17 10:21:25