TryHackMe Log Analysis with SIEM Walkthrough
Hey blue teamers. Security Information And Event Management (SIEM) is an essential tool for blue teamers. Today we are going to learn how…
TryHackMe Log Analysis with SIEM Walkthrough

Hey blue teamers. Security Information And Event Management (SIEM) is an essential tool for blue teamers. Today we are going to learn how to use SIEM for log analysis by going through this room on TryHackMe.
**Before following this walkthrough, make sure you:
- Have a TryHackMe account
- Know how to connect to a TryHackMe room (via OpenVPN or AttackBox)
- Have started the “Log Analysis with SIEM” room**
Prerequisite: Knowledge on log analysis.
Task 1: Introduction
Question 1: Let’s go! No answer needed
Task 2: Benefits of SIEM for Analysts
Question 1: What is the process of linking data from multiple sources to identify relationships between individual events called?
Answer: Correlation
Question 2: What is the process of collecting and storing log data from multiple systems and sources into a single, unified location for easier analysis called?
Answer: Centralisation
Task 3: Log Sources Overview
Question 1: What is the process of converting logs from different formats into a single format for easier analysis in a SIEM?
Answer: Normalisation
Question 2: Which log source type can be used to detect the execution of a malicious script?
Answer: Host-Based
Task 4: Windows Logs
Practice Scenario: You are an SOC Level 1 Analyst on shift and have received an alert indicating a suspicious network connection using port 5678 on the WIN-105 host. Your task is to conduct an investigation and determine whether this activity is suspicious.
The logs for this task are located in the Splunk index task4. Use the following query: index=task4
Question 1: Which IP address was the connection established with?
Step 1: Click “Search & Reporting”.

Step 2: Click on time stamp near the magnifier and select “All time” then input the following query and click search.
index="task4"
It is extremely important you selected “All time” before you do any queries.

Thus, we can get a brief idea on how the log format look like.

Step 3: Do a search query related to the question which required us to find the IP.
According to the scenario from the known information, we known a suspicious network connection using port 5678 on the WIN-105 host. We known that it is a network connection event. Therefore, we can use sysmon event code 3 and Destination Port = 5678 as searching parameters and do a quick search.
index=task4 EventCode=3 AND DestinationPort=5678
| table _time ComputerName Image SourceIp SourcePort DestinationIp DestinationPort Protocol
Now we got the IP.

Question 2: Which process initiated this suspicious connection?
index=task4 EventCode=3 AND DestinationPort=5678
| table _time ComputerName Image SourceIp SourcePort DestinationIp DestinationPort Protocol
Please see below screenshot for the answer.

Question 3: What is the MD5 hash of the malicious process from the previous question?
Step 1: Do a query on the following.
index=task4 EventCode=3 AND DestinationPort=5678Then show all fields in the related log. Since, we are looking for MD5 value this time, we will mark down the process ID, process name and time stamp for later reference.
Process Id: 1460 Procass name: SharePoInt.exe UtcTime: 2025–08–14 11:10:21.430
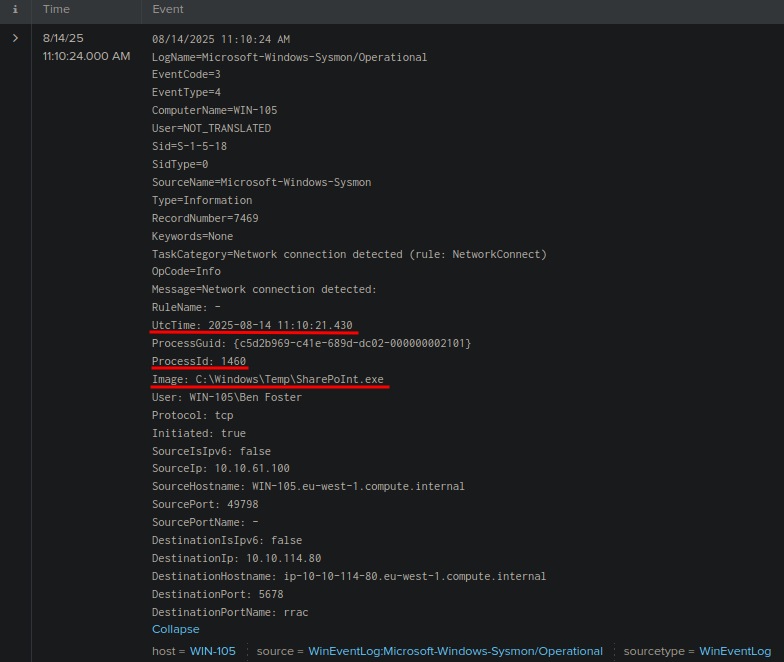
Step 2: Do the following query to narrow down the search result.
index=task4 *SharePoInt* AND *MD5* AND 1460Now we got only 3 results, which is easy to look at.

Step 3: Look at each one and we will find out the second log matched information we marked down before. We got the MD5 hash value.

Question 4: What is the name of the scheduled task that was created on the system?
index=task4 *SharePoInt* AND *scheduler*
Task 5: Linux Logs
Practice Scenario: You are an SOC Level 1 Analyst on shift and have received an alert indicating possible persistence through the creation of a new remote-ssh user on an Ubuntu server. Your task is to dive into the logs and determine exactly what happened on the system.
The logs for this task are located in the Splunk index task5. Use the following query: index=task5
Question 1: What was the timestamp of the remote-ssh account creation? Answer Format Example: 2025–01–15 12:30:45
index=task5 | search "Account Created" OR "new user" OR "useradd"
Question 2: Which user successfully escalated their privileges to root prior to the action from the first question?
index=task5 | search "sudo"
Question 3: From which IP address did the user from the previous question successfully log in to the system?
index=task5 source="auth.log" AND jack-brown AND Accepted password
Question 4: How many failed login attempts occurred prior to this successful login?
index=task5 source="auth.log" process=sshd "jack-brown"
| search "Failed Password" OR "Accepted password"
Answer is 4.
Here is the explanations: Timeline Analysis
-
9:50:27 → Failed password (port 54445)
-
9:50:36 → Message repeated 2 times (port 54445) → means two additional failed attempts
-
9:50:48 → Failed password (port 54446)
-
9:50:59 → Failed password (port 54446)
-
9:51:00 → Failed password (port 54446)
-
9:51:29 → Accepted password (successful login, port 54451)
Counting Failed Attempts
Now, we need to count only the failed attempts before the successful login:
1. 9:50:27 → 1 failed attempt

2. 9:50:36 (message repeated 2 times) → adds 2 failed attempts

    - Total so far = 3

3. 9:50:48 → 1 failed attempt

    - Total = 4

4. 9:50:59 → 1 failed attempt

    - Total = 5

5. 9:51:00 → 1 failed attempt

    - Total = 6
However:
9:50:27   ❌ Failed login (port 54445)
9:50:36   ❌❌ Failed login repeated 2 times (port 54445) → total 3 failures
9:50:48   ❌ Failed login (port 54446) → 4th failure
9:50:59   (same session retry, not counted separately)
9:51:00   (same session retry, not counted separately)
9:51:29   ✅ Successful login (port 54451)
Login Attempt Summary
Port 54445 → 3 failed attempts (1 original + 2 compressed repeats)
-
Port 54446 → 1 failed attempt (9:50:48)
-
Port 54446 (9:50:59 & 9:51:00) → retries within the same session, not counted separately
-
Successful login → at 9:51:29 (port 54451)
Total = 4 failed login attempts before success
Question 5: Which port is the persistence mechanism configured to connect to?
index=task5 sourcetype="syslog" ("CRON" OR "cron")
Task 6: Web Application Logs
Practice Scenario: You are an SOC Level 1 Analyst on shift and have received an alert indicating a spike in activity on the organisation’s web server. Your task is to dive into the logs and determine exactly what happened.
The logs for this task are located in the Splunk index task6. Use the following query: index=task6
Question 1: Which URI path had the highest number of requests?
Step 1: Use the following query.
index=task6
Step 2: Go to table on left hand side where it said “SELECTED FIELDS” then click “uri_path”. You will see which URI path had the highest number of requests.

Question 2: Which IP address was the source of the activity?
index=task6 uri_path="/wp-login.php"
| stats count by clientip
|  sort -count
Question 3: How can this activity be classified?
index=task6 method=POST uri_path="/wp-login.php"
| bin _time span=5m
| stats values(referer_domain) as referer_domain values(status) as status values(useragent) as UserAgent values(uri_path) as uri_path count by clientip _time
| where count > 25
| table referer_domain clientip UserAgent uri_path count status
From the query result, the IP address 10.10.243.134 made as many as 583 requests to the wp-login.php page. Which indicated the attacker trying to do a WordPress scanning (Possible for Enumeration purpose). Also, the User-Agent string shows Hydra, which is a tool use for brute-forcing attack. Which has 160 requests to wp-login.php page came from the IP address 167.172.41.141. Therefore, this activity classified as “Brute Force”.
Question 4: Which tool did the threat actor use?
Answer: WPScan
Task 7: Conclusion
Question 1: Good work!
메타데이터
- post_id
- cf5515ab41d7
- slug
- tryhackme-log-analysis-with-siem-walkthrough-cf5515ab41d7
- url
- https://medium.com/@birdv/tryhackme-log-analysis-with-siem-walkthrough-cf5515ab41d7
- canonical_url
- https://medium.com/@birdv/tryhackme-log-analysis-with-siem-walkthrough-cf5515ab41d7
- author_url
- https://medium.com/@birdv
- status
- ok
- fetched_at
- 2026-07-14 01:09:42




