Using IOT-Tree Message Flow InfluxDB Module Node for Tag Data Time-Series Storage
IOT-Tree Server is an open-source IoT software that can serve as SCADA software for automation systems. It provides various capabilities…
Using IOT-Tree Message Flow InfluxDB Module Node for Tag Data Time-Series Storage
IOT-Tree Server is an open-source IoT software that can serve as SCADA software for automation systems. It provides various capabilities including device access, data organization and management, control logic, and human-machine interaction. The IOT-Tree message flow feature, after organizing data from various connected devices, provides intuitive and fast function block composition support, allowing you to quickly implement data processing in most scenarios — storage, conversion, sending, etc.
If you are not familiar with IOT-Tree Server, please refer to the following documentation:
- https://github.com/bambooww/iot-tree
- Using IOT-Tree Server to Connect Mitsubishi Q Series PLC via MC Protocol
- Using IOT-Tree Server to Connect Siemens PLC S7–300/1200/1500
- Using IOT-Tree Server to Connect Siemens PLC S7–200 via PPI (RS485)
- The series also includes articles covering the complete process of using IOT-Tree to complete a specific project, very detailed, as follows:
- Hands-on Guide to Computer Room Automation Monitoring — 10 Project Completion Summary
1 Time-Series Database InfluxDB and Corresponding Message Flow Module Node
A Time Series Database (TSDB) is a database system optimized for processing time-stamped data, suitable for monitoring, IoT, financial analysis, and other scenarios. Its core features include efficient writing, compressed storage, and fast time-range queries. Characteristics include:
- Time Index Optimization: Data is automatically sorted by timestamp, supporting efficient range queries.
- High Write Throughput: Designed for high-frequency writes (e.g., sensor data), supporting batch insertion.
- Data Compression: Uses columnar storage and compression algorithms (e.g., Gorilla, Delta encoding) to reduce storage space.
- Downsampling and Aggregation: Supports time-window aggregation (e.g., per-minute averages) to speed up analytical queries.
The IOT-Tree message flow has added support for the InfluxDB module node, the most mainstream time-series database. For basic concepts and explanations about InfluxDB, please refer to the official website or other online resources — this article will not expand on them.
2 Detailed Configuration Process
2.1 InfluxDB Data Source Configuration
In IOT-Tree, data source configuration is not within a project — the same data source can be used by all projects. After logging into IOT-Tree as an administrator, you can see a data source management section on the main management interface:

The data source supports multiple database types. For this case, simply select the InfluxDB type.

When editing the data source, fill in the configuration according to your InfluxDB address, port, token, org, bucket, and other parameters:

After completion, click the “Test” button for the corresponding data source in the list. If prompted with success, the data source configuration is correct.

2.2 Measurement (Database Table) Configuration
With the data source above, we can now configure the periodic storage of tag data into InfluxDB within the project message flow.
In your IOT-Tree project management interface, add a message flow from the lower left corner. Click to see the message flow configuration interface. Select the “InfluxDB V2” node under the “Storage” category from the left list, and drag it to the configuration area. The node is added as shown below:

2.2.1 Configure Data Source to this Node
Double-click the added “InfluxDB V2 1” node to open its detailed configuration interface. Select the previously configured data source.

2.2.2 Configure Measurement (Analogous to a Table in a Relational Database)
Select the “InfluxDB V2 1” node. On the left node list area, the associated sub-nodes of this module will be displayed. Select the “Measurement” node and drag it to the editing area. The node is added as shown below:

Double-click the “Measurement 1” node. In the popup window, fill in the Measurement name and title. No other content needs modification, as shown below:

With this, we have prepared the InfluxDB database and the Measurement for storing real-time tag data.
2.3 Sync Data Node Configuration
With the configured InfluxDB database and Measurement for real-time tag data storage ready, we can configure writing tag data. From the left node list, select the “Tag Filter Store to Time-Series Database (Tags To TSDB)” node under the “Devices” category and drag it to the editor. This node is specifically designed by IOT-Tree to support writing project tag real-time data to a time-series database, as shown below:

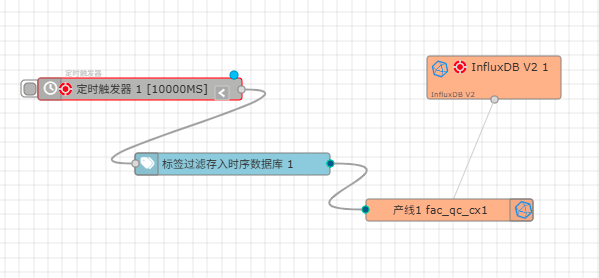
Whenever this node receives any message on its left input, it performs a write operation of the tag real-time data to the time-series database Measurement. However, the right output resource terminal must be connected to a Measurement node. We simply need to connect this output terminal to the previously configured node.
Obviously, we typically do not need to store all tag data from the project into InfluxDB. This storage node supports filtering to select only the required tags. Double-click the node, and in the opened window, you can see the following:

The “Project Tags” section shows the currently selected tags to be written. Click to open the project tag list for selection and modification. After completing the above settings, the basic configuration is done (InfluxDB will automatically create the Measurement and other content).
2.4 Add a Timer Trigger — Supporting Scheduled Data Writes
As mentioned above, the “Tag Filter Store to Time-Series Database” node needs an input message to trigger the write operation. The simplest way is to add a timer node to the current flow. You can set the synchronization interval as needed, as shown below:

The entire configuration process is easily completed and should take no more than 5 minutes.
3 Final Result
Start this project. If running normally, you will see the configured Measurement automatically created in your InfluxDB management interface, with new records being continuously written at the configured time interval.
메타데이터
- post_id
- cf6ca459ac52
- slug
- using-iot-tree-message-flow-influxdb-module-node-for-tag-data-time-series-storage-cf6ca459ac52
- url
- https://medium.com/@jasonzhu8888/using-iot-tree-message-flow-influxdb-module-node-for-tag-data-time-series-storage-cf6ca459ac52
- canonical_url
- https://medium.com/@jasonzhu8888/using-iot-tree-message-flow-influxdb-module-node-for-tag-data-time-series-storage-cf6ca459ac52
- author_url
- https://medium.com/@jasonzhu8888
- status
- ok
- fetched_at
- 2026-06-17 15:18:21