How I Built an AI-Powered Observability Platform on Amazon EKS with OpenTelemetry
Collect metrics, logs, and traces from Amazon EKS using OpenTelemetry, Terraform, ArgoCD, and New Relic—and use AI to explore and troubleshoot your Kubernetes cluster.
How I Built an AI-Powered Observability Platform on Amazon EKS with OpenTelemetry
A GitOps driven observability stack using Terraform, ArgoCD, OpenTelemetry Collector, and New Relic.
Why This Setup?
Before getting into the architecture, a few quick notes. Telemetry goes to both New Relic and Honeycomb to test OpenTelemetry’s backend-independence promise and compare the two. New Relic wins on day-to-day usability — dashboards, APM, and alerts work intuitively. Honeycomb takes more getting used to, but its MCP server is where it genuinely shines: connected to Claude, you can ask plain-English questions against live telemetry — no NRQL or PromQL required. That’s the part worth ***jumping to 👇* first if you’re short on time.
Introduction
Observability has become a critical part of operating modern cloud-native applications. While application metrics, logs, and traces provide valuable insights, true observability also requires visibility into the Kubernetes platform itself.
In this project, I built a complete observability platform on Amazon EKS using OpenTelemetry, ArgoCD, Traefik, New Relic, and Honeycomb. The goal was to learn OpenTelemetry end-to-end while implementing GitOps practices and collecting telemetry from both applications and Kubernetes infrastructure.
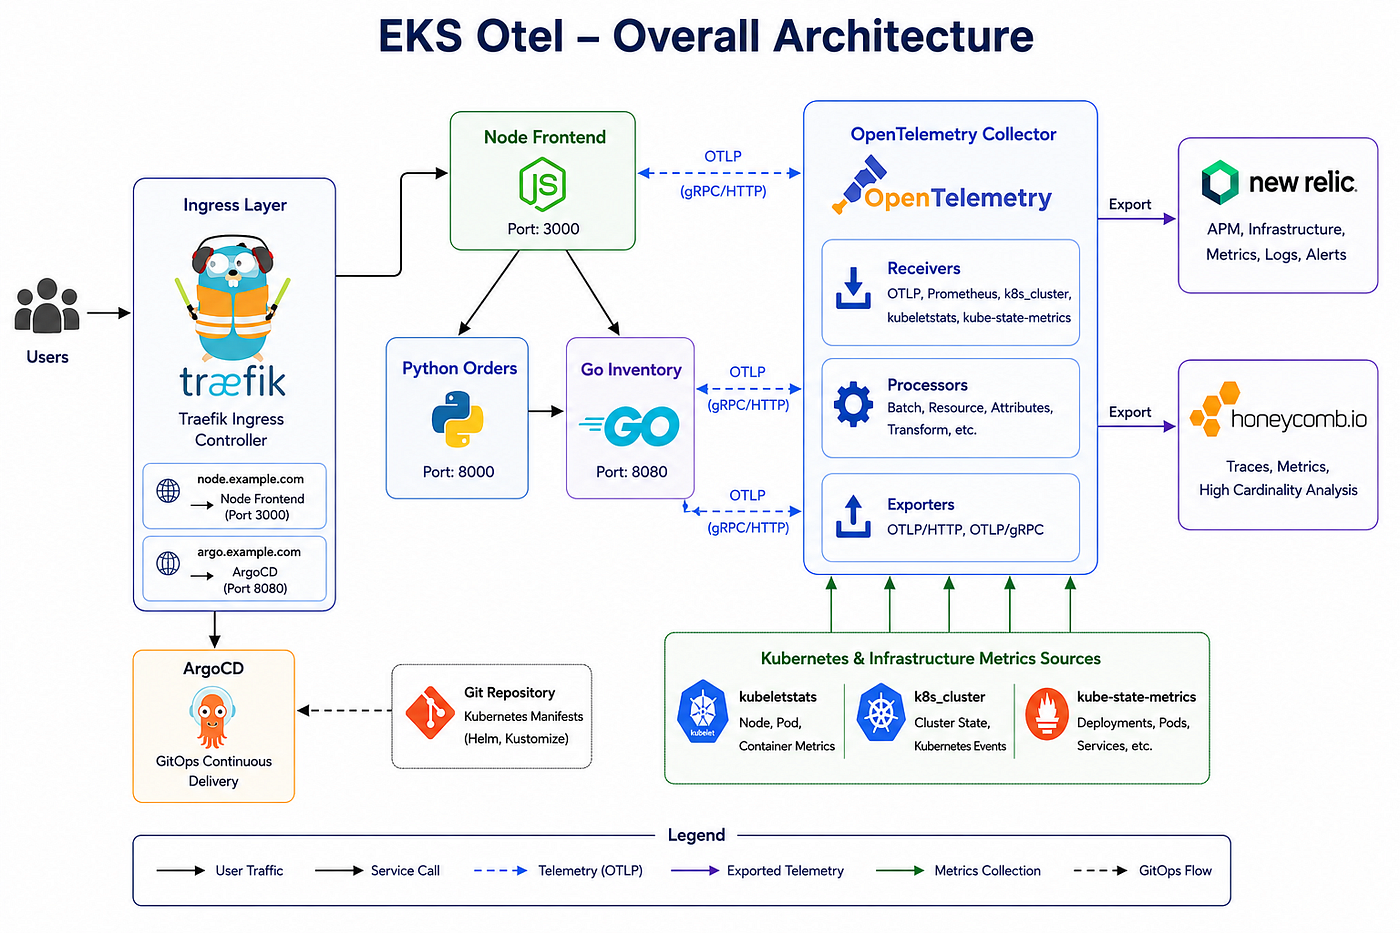
Architecture Overview
The platform consists of:
- Amazon EKS
- ArgoCD
- Traefik Ingress Controller
- OpenTelemetry Collector
- kube-state-metrics
- Node Frontend Service
- Python Orders Service
- Go Inventory Service
- New Relic
- Honeycomb
The OpenTelemetry Collector acts as the central telemetry pipeline and exports data to multiple observability backends.
Project Structure
The project is split into two repositories.
The first repository, otel-labs , contains the application source code, OpenTelemetry instrumentation, Dockerfiles, and GitHub Actions workflows.
The second repository, otel-labs-platform , contains the infrastructure and Kubernetes platform configuration required to run those applications on Amazon EKS.
This separation follows a common GitOps pattern where application development and platform management are handled independently.
otel-labs
│
├── Source Code
├── Dockerfiles
├── OpenTelemetry Instrumentation
└── GitHub Actions

otel-labs-platform
│
├── Terraform
│   ├── VPC
│   ├── Amazon EKS
│   ├── Node Groups
│   └── Bootstrap Configuration
│
└── Kubernetes
    ├── ArgoCD Applications
    ├── Traefik
    ├── OpenTelemetry Collector
    ├── kube-state-metrics
    └── Application Manifests
Application Repository (otel-labs)
The application repository contains three microservices:
- Node Frontend
- Python Orders
- Go Inventory
Each service is instrumented using OpenTelemetry SDKs and exports telemetry using the OTLP protocol.
The repository also contains a GitHub Actions workflow that builds container images and publishes them to GitHub Container Registry (GHCR). Images are tagged with both a short commit hash and a latest tag, although the Kubernetes manifests always reference the immutable commit-based tag.
After publishing an image, the workflow updates the image tag in the platform repository’s kustomization.yml using sed. The workflow then commits and pushes the change to the platform using the GitHub Actions bot account. ArgoCD detects the Git change during its next sync cycle and automatically deploys the new version. No manual kubectl apply commands are required, and Git remains the single source of truth.
Code Change
     │
     ▼
GitHub Actions
     │
     ▼
Build Container Images
     │
     ▼
Push Images to GHCR
     │
     ▼
Update Image Tag in
otel-labs-platform
This means the application repository is responsible only for producing deployable artifacts, while the platform repository remains responsible for deployment.
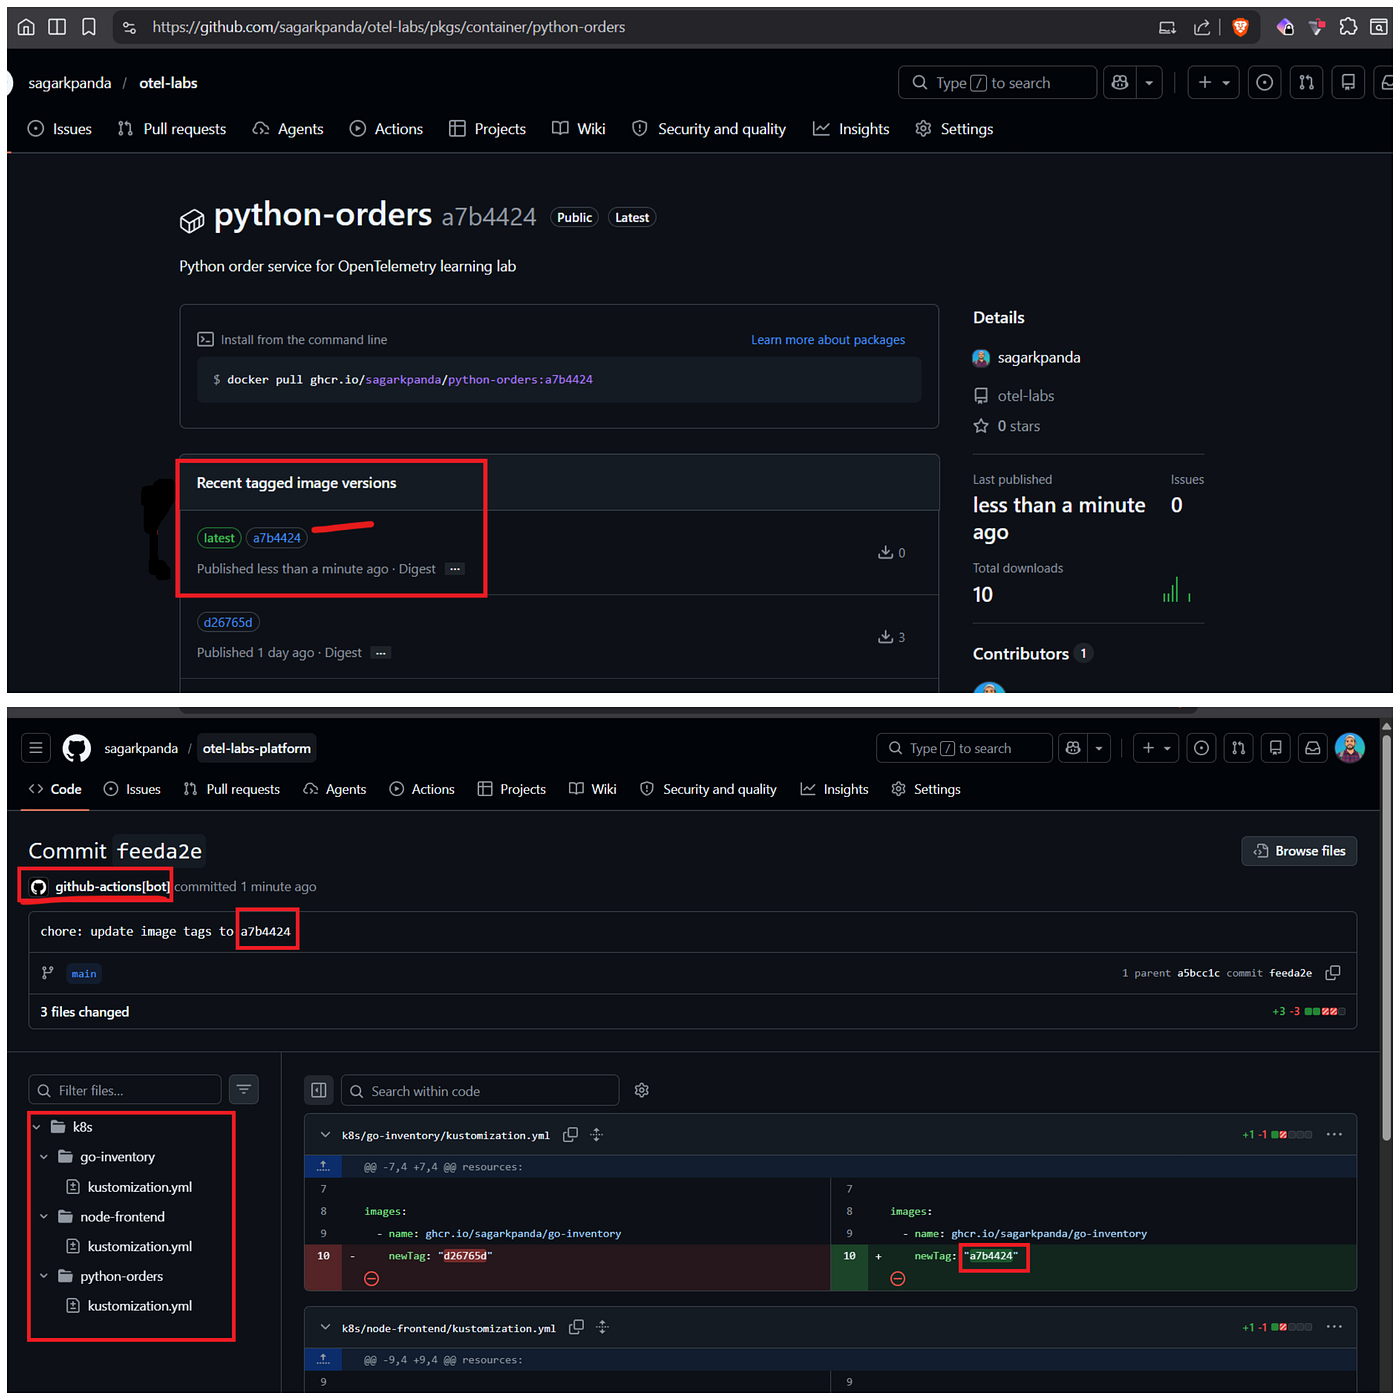
GitHub Actions updates the tag in the platform repo
For local development, the entire application stack can be started using Docker Compose.
After creating a .env file from .env.example, run:
docker compose up --build -dThis launches all services together with the OpenTelemetry Collector, allowing telemetry to be exported to the configured observability backends.
Platform Repository (otel-labs-platform)
The platform repository contains everything required to run the applications on Kubernetes.
terraform/
├── eks.tf
├── addons.tf
├── bootstrap.sh
└── ...

k8s/
├── argo-apps/
├── node-frontend/
├── python-orders/
├── go-inventory/
├── otel-collector/
└── kustomization.yml
Terraform is responsible for infrastructure provisioning, while Kubernetes manifests are managed using GitOps through ArgoCD.
This separation allows infrastructure, platform services, and application workloads to evolve independently while remaining declarative.
Setup AWS EKS with Terraform
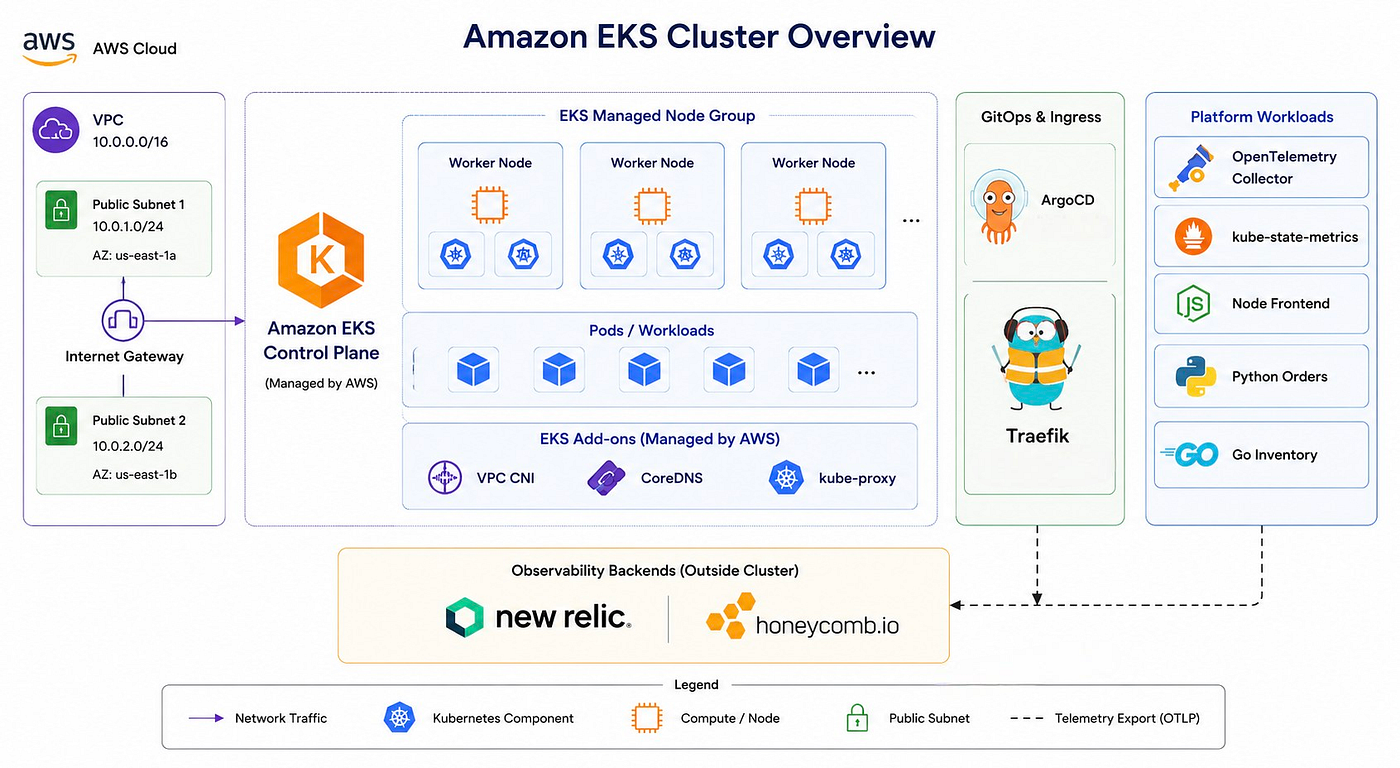
The Kubernetes platform is hosted on Amazon EKS and provisioned entirely using Terraform.
The deployment creates:
- VPC
- Public Subnets
- Amazon EKS Control Plane
- Managed Node Group
- EKS Managed Addons
The managed addons installed are:
- VPC CNI
- CoreDNS
- kube-proxy
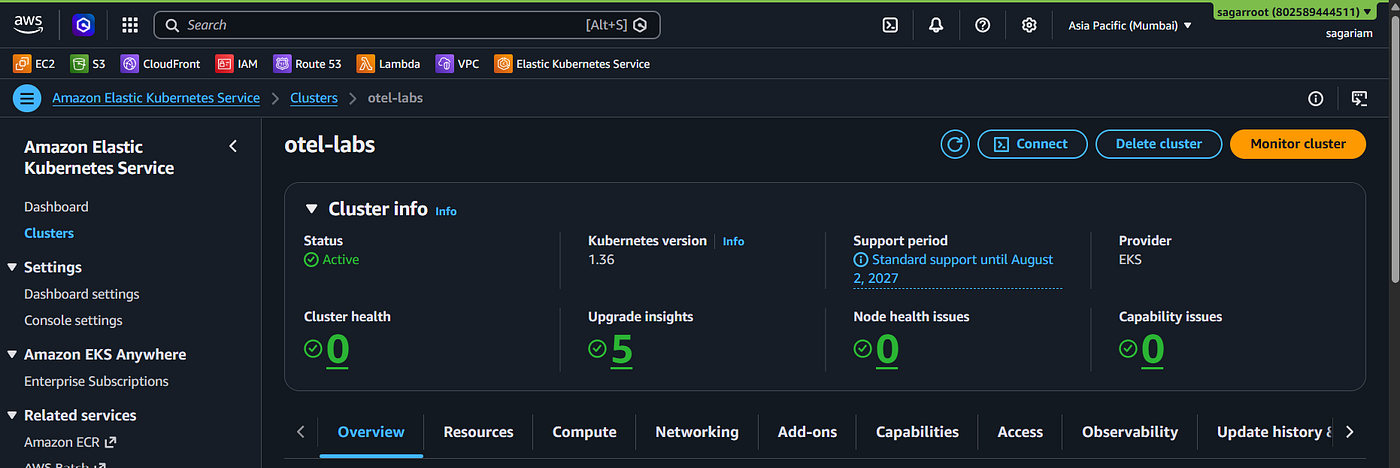
EKS Cluster Overview
Using EKS managed addons simplifies upgrades and reduces operational overhead.
After Terraform finishes provisioning the cluster, it invokes a bootstrap script which performs the initial platform setup.
The bootstrap process:
- Updates the local kubeconfig.
- Creates the ArgoCD namespace.
- Installs ArgoCD using Helm.
- Creates the application namespace.
- Applies observability secrets required by the OpenTelemetry Collector.
Terraform Apply
       │
       ▼
Amazon EKS Created
       │
       ▼
bootstrap.sh
       │
       ├── Update kubeconfig
       ├── Install ArgoCD
       ├── Create Namespaces
       └── Apply Secrets
The secrets contain the credentials required by the OpenTelemetry Collector exporters to send telemetry to New Relic and Honeycomb.
A secrets.example.yml file is included in the repository as a reference, while the actual secrets file remains excluded from version control.
Installing ArgoCD
After the EKS cluster is provisioned, a GitOps controller is required to manage Kubernetes resources declaratively.
ArgoCD continuously monitors Git repositories and reconciles the cluster state to match the desired configuration stored in Git. This removes the need to manually apply manifests after every change and provides a centralized view of application deployments.
As part of the cluster bootstrap process, ArgoCD is installed automatically using Helm.
The bootstrap workflow performs:
- Update kubeconfig
- Create the ArgoCD namespace
- Add the Argo Helm repository
- Install ArgoCD
- Apply observability secrets
helm upgrade --install argocd \
  argo/argo-cd \
  -n argocd \
  --set configs.params."server\.insecure"=true
GitOps Deployment Approaches
ArgoCD supports multiple bootstrap patterns depending on how applications are organized and deployed.
Regardless of the approach used, ArgoCD remains responsible for continuously reconciling workloads and ensuring the cluster matches the desired state defined in Git.
Option 1: Individual Application Manifests
Each ArgoCD Application can be created independently.
kubectl apply -f traefik-app.yml
kubectl apply -f kube-state-metrics-app.yml
kubectl apply -f otel-collector-app.yml
kubectl apply -f node-frontend-app.yml
kubectl apply -f python-orders-app.yml
kubectl apply -f go-inventory-app.yml
Flow:
Application
     ↓
Workload
This approach provides maximum flexibility and is useful when deploying or troubleshooting applications individually.
Option 2: Root Application (App of Apps)
A parent application manages a collection of child applications.
Root Application
      |
      +---- Traefik
      +---- kube-state-metrics
      +---- OpenTelemetry Collector
      +---- Node Frontend
      +---- Python Orders
      +---- Go Inventory
Flow:
Install ArgoCD
      |
      v
Apply Root Application
      |
      v
ArgoCD Creates Child Applications
      |
      v
Applications Deploy Workloads
This pattern is commonly known as the App of Apps pattern and provides a single entry point for deploying an entire platform stack.
The root application itself can also be applied automatically during cluster bootstrap, allowing workloads to be deployed immediately after the cluster becomes available.
Option 3: Kustomize Bootstrap
The final implementation uses a Kustomize root directory that references all ArgoCD applications.
k8s/
├── argo-apps/
│   ├── traefik-app.yml
│   ├── kube-state-metrics-app.yml
│   ├── otel-collector-app.yml
│   ├── node-frontend-app.yml
│   ├── python-orders-app.yml
│   └── go-inventory-app.yml
Everything can be deployed using:
kubectl apply -k k8sFlow:
Install ArgoCD
      |
      v
Apply Kustomize Root
      |
      v
ArgoCD Applications Created
      |
      v
Applications Deploy Workloads
This approach removes the need for a dedicated root application while still providing a single deployment entry point for the entire platform.
Installing Traefik
A Kubernetes cluster requires an ingress controller to route external traffic to internal services.
Traefik is deployed through ArgoCD using the official Helm chart and automatically discovers Kubernetes Ingress resources. Whenever a new Ingress object is created, Traefik dynamically updates its routing configuration without requiring additional manual configuration.
source:
  repoURL: https://traefik.github.io/charts
  chart: traefik
Within this platform, Traefik acts as the entry point for external traffic and routes requests to services running inside the cluster.
The node-frontend is exposed via treafik ingress. To view the ingress dns name run kubectl get ing -A. Then map that dns records to a CNAME record with your domain registrar.
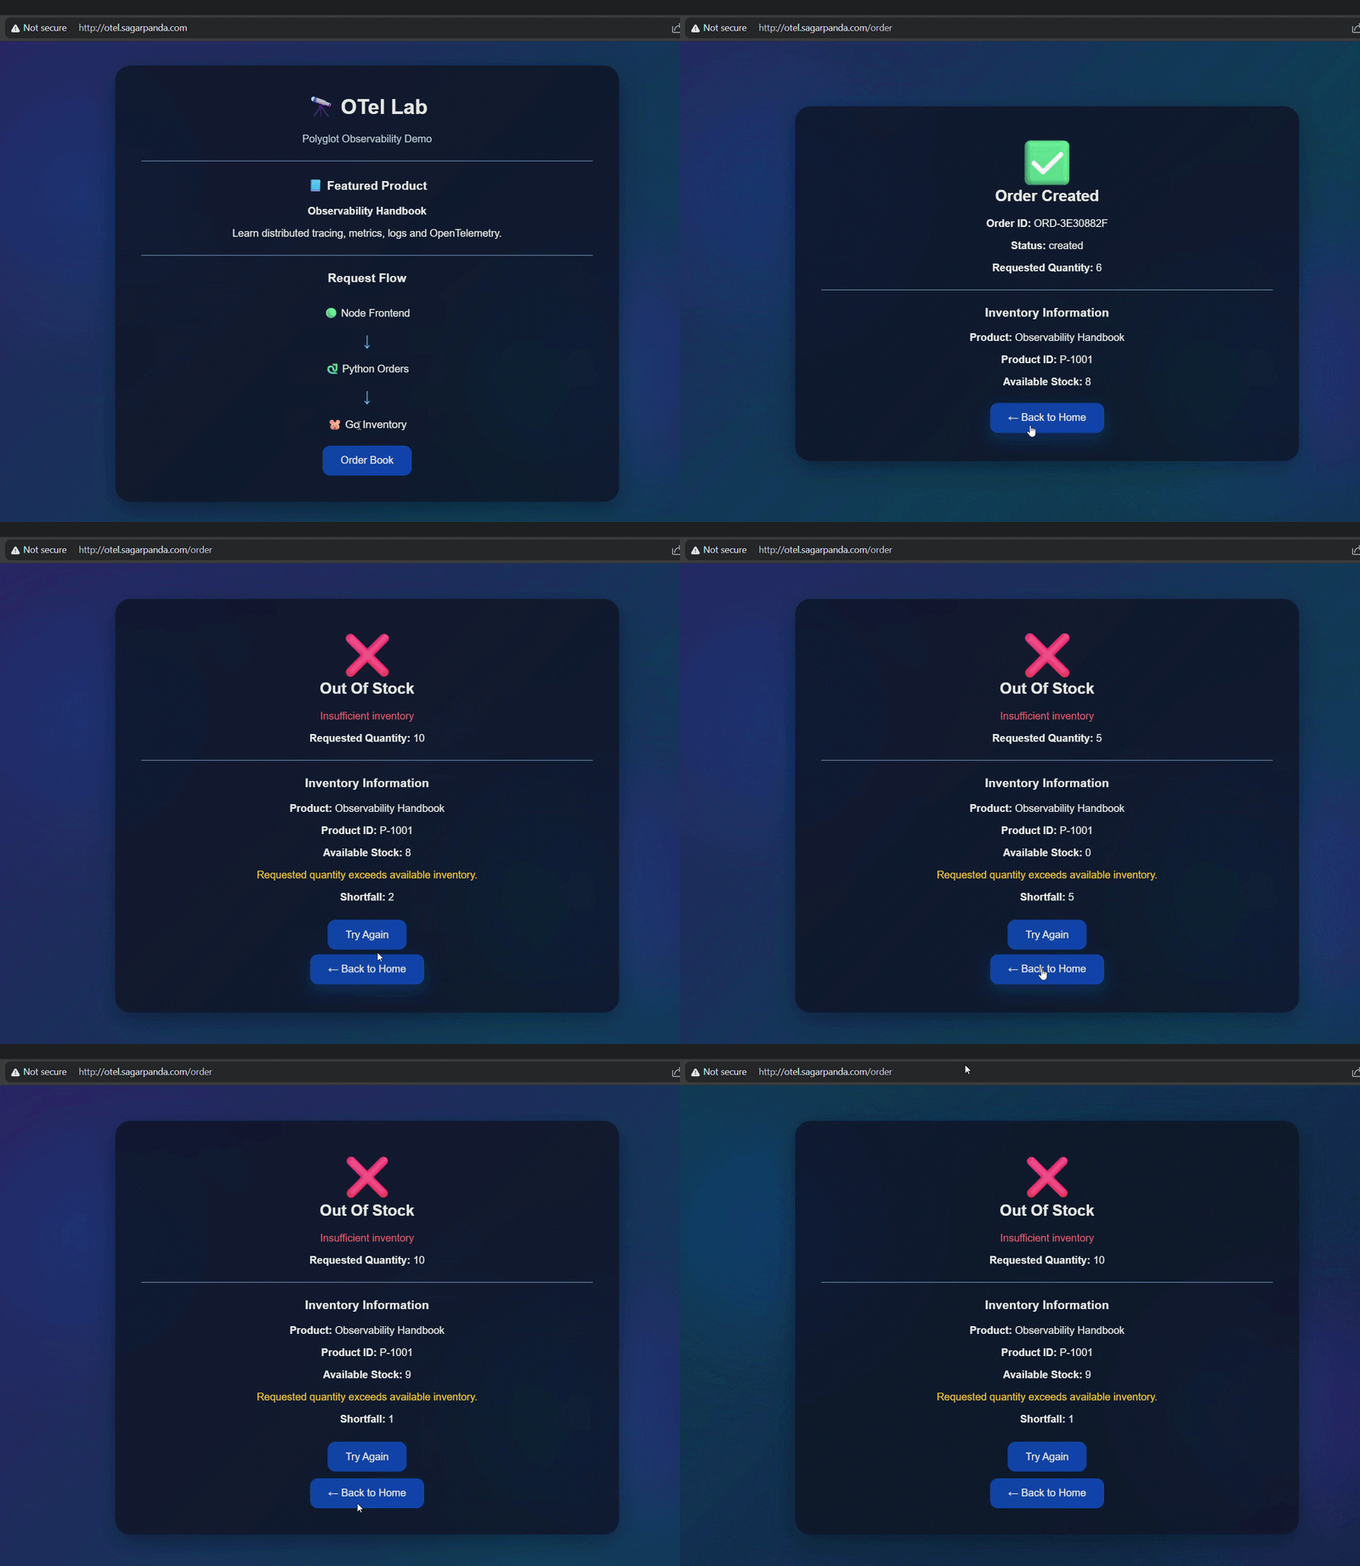
O11y Book ordering app
Exposing ArgoCD
After installation, the ArgoCD server is only accessible from within the cluster.
To provide browser access, a Kubernetes Ingress resource is created. Traefik detects the Ingress and automatically configures routing for the ArgoCD service. Apply the ingress resource under k8s/infra/argo/argo-ingress.yml, which also uses the same ingress created ealier for node app. Similarly create another CNAME record for argo ui.
apiVersion: networking.k8s.io/v1
kind: Ingress
Traffic flow:
Browser
    ↓
Traefik
    ↓
ArgoCD Server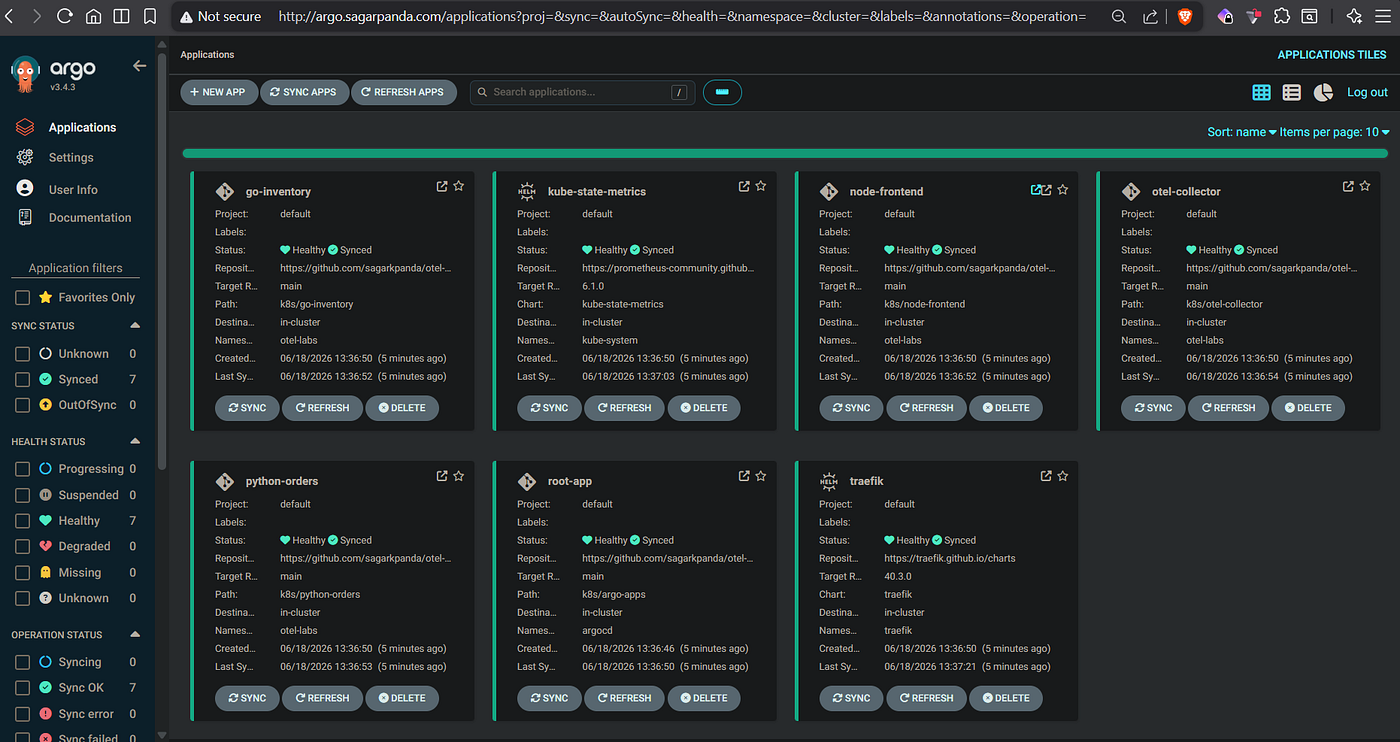
ArgoCD with apps, auto syncs when repo chnages
OpenTelemetry Collector
The OpenTelemetry Collector acts as the central telemetry pipeline for the platform. The collector is deployed as a DaemonSet to ensure node-local Kubernetes metrics are collected from every worker node in the cluster.
Instead of applications sending telemetry directly to observability platforms, traces, metrics, and logs are first sent to the collector. This provides a central location for processing, enrichment, filtering, and routing while keeping application instrumentation vendor-neutral.
The collector is responsible for:
- Receiving OTLP telemetry
- Collecting Kubernetes metrics
- Enriching telemetry with Kubernetes metadata
- Exporting telemetry to multiple backends
Telemetry flow:
Applications
      ↓
OTLP Receiver
      ↓
Processors
      ↓
Exporters
      ↓
New Relic / Honeycomb
The same telemetry stream can be exported to multiple destinations simultaneously without modifying application code.
Collecting Application Telemetry
The platform contains three sample services:
node-frontend
python-orders
go-inventory
Each service is instrumented using OpenTelemetry SDKs and exports telemetry using OTLP.
Whenever a request flows through the application, traces, metrics, and logs are generated and sent to the OpenTelemetry Collector.
Application
      ↓
OTLP
      ↓
OpenTelemetry Collector
By routing telemetry through the collector, applications remain independent of any specific observability vendor while still supporting multiple observability backends.
Kubernetes Observability
Application telemetry provides visibility into application behavior, but understanding the health of the Kubernetes platform requires additional telemetry sources.
The OpenTelemetry Collector gathers Kubernetes telemetry from multiple components and APIs to provide visibility into nodes, pods, deployments, services, and overall cluster state.
kubeletstats
Provides:
- Node Metrics
- Pod Metrics
- Container Metrics
kubelet
   ↓
kubeletstats receiver
k8s_cluster
Provides:
- Cluster State
- Kubernetes Events
Kubernetes API
       ↓
k8s_cluster receiver
kube-state-metrics
Provides:
- Deployments
- StatefulSets
- DaemonSets
- Services
- Replica Counts
- Pod Status
kube-state-metrics
        ↓
Prometheus Receiver
        ↓
OpenTelemetry Collector
Multi-Backend Observability
One of the primary benefits of OpenTelemetry is backend independence.
Telemetry can be exported to multiple observability platforms simultaneously while maintaining a single instrumentation strategy across applications and infrastructure.
In this platform, telemetry is exported to both New Relic and Honeycomb. Now we have telemetry data from both the apps and the k8s infrastructure and workloads.
Note: Create API keys for both platforms to be able to export data into them. For New Relic, create ingest license, for honeycomb create ingest api key
New Relic
New Relic provides a user-friendly interface with built-in dashboards, APM views, service maps, tracing, logging, and alerting capabilities. While Kubernetes metrics collected through OpenTelemetry are available and queryable using NRQL, some of New Relic's prebuilt Kubernetes experiences may require the New Relic Kubernetes integration for full functionality..
K8s Metrics works as usual via query. Or we can create our own dashboards by running NRQL on k8s metrics.
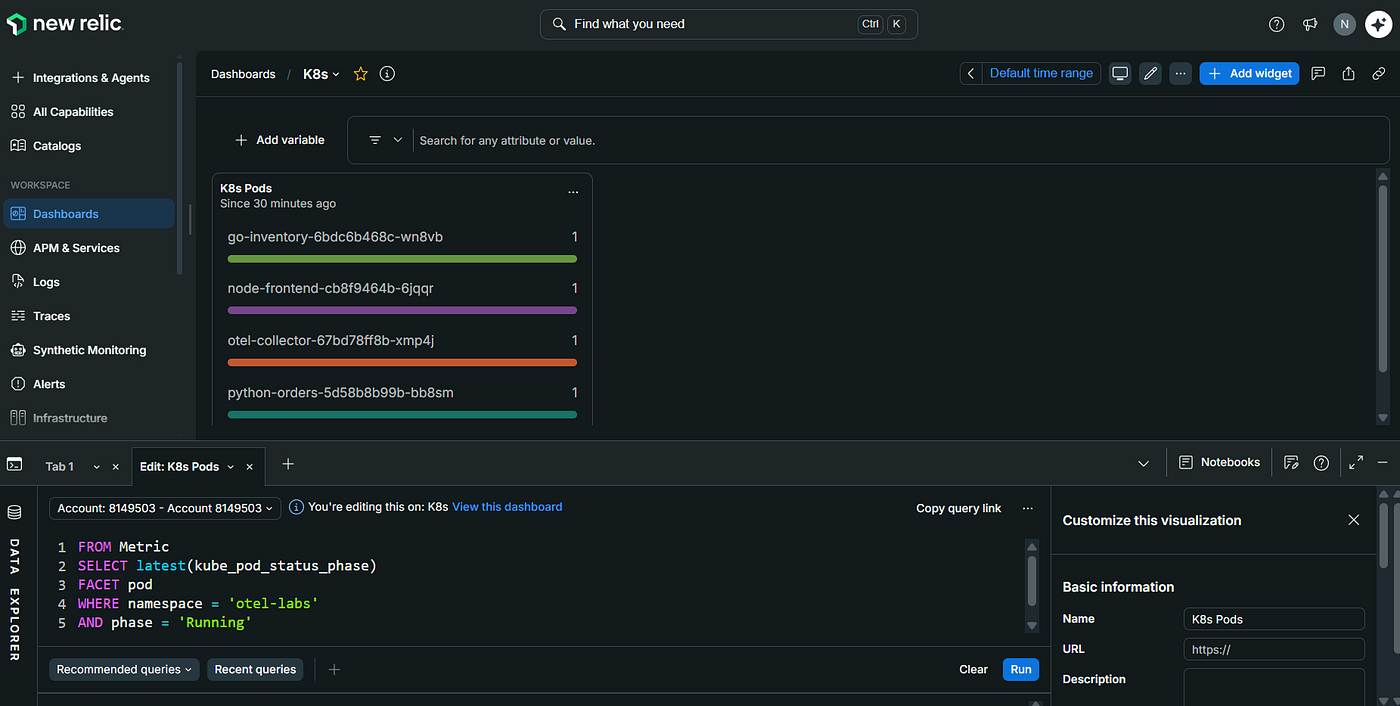
New Relic Dashboard Created using NRQL
NR free tier is pretty generous, it has built-in panels to view.
- APM
- Metrics and Logs
- Traces and Span correlation view
- Service Map and Dependency discovery
You can also configure alerts using NRQL, choose alert channel such as email, slack, MS teams or webhook. And when the condition is matched by threshold set, you will get the notification.
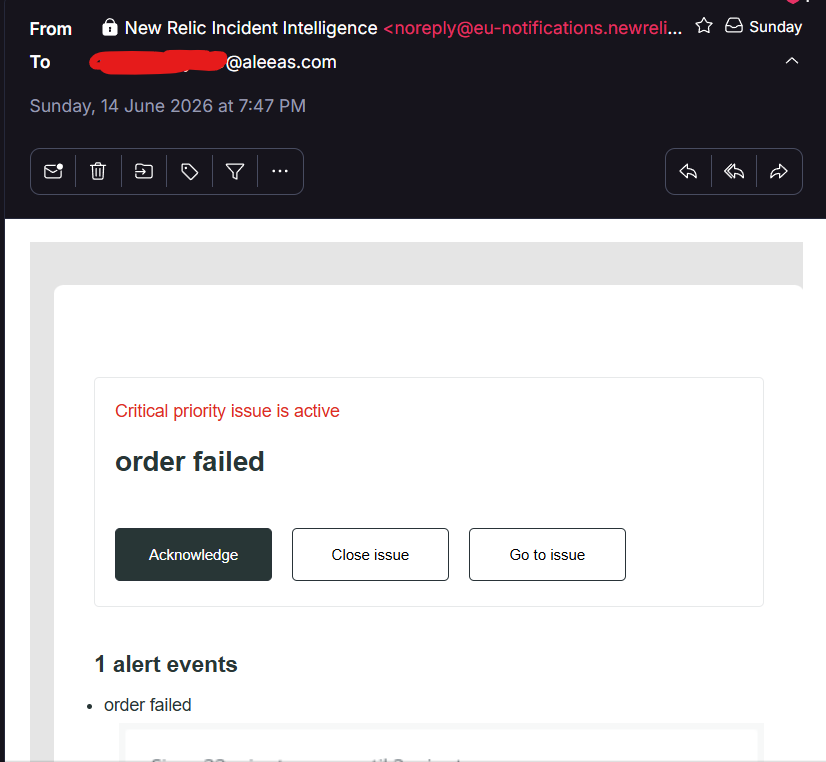
New Relic mail alert set for failed order
From the APM menu, pickup node app, go to distributed traces and checkout the GET/Order, and from there choose the latest one, view the trace spans, attributes, logs etc. Copy the trace id and match it with other service traces.
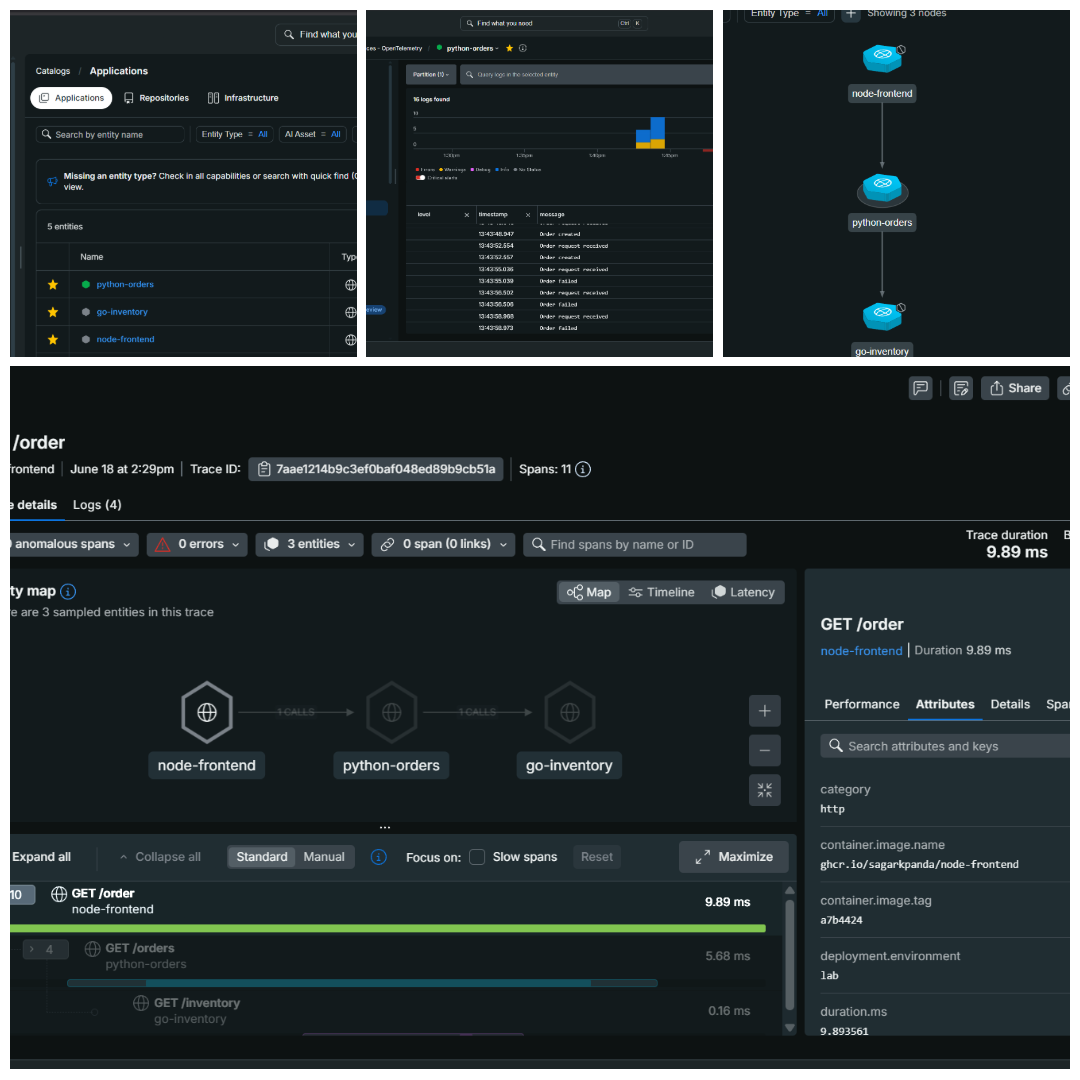
Overall View of NR
Honeycomb.io
Honeycomb is an observability platform built around OpenTelemetry with AI-assisted observability capabilities. Since both application and Kubernetes telemetry flow through the OTel Collector’s multi-exporter pipeline, the same data lands in Honeycomb without additional instrumentation.
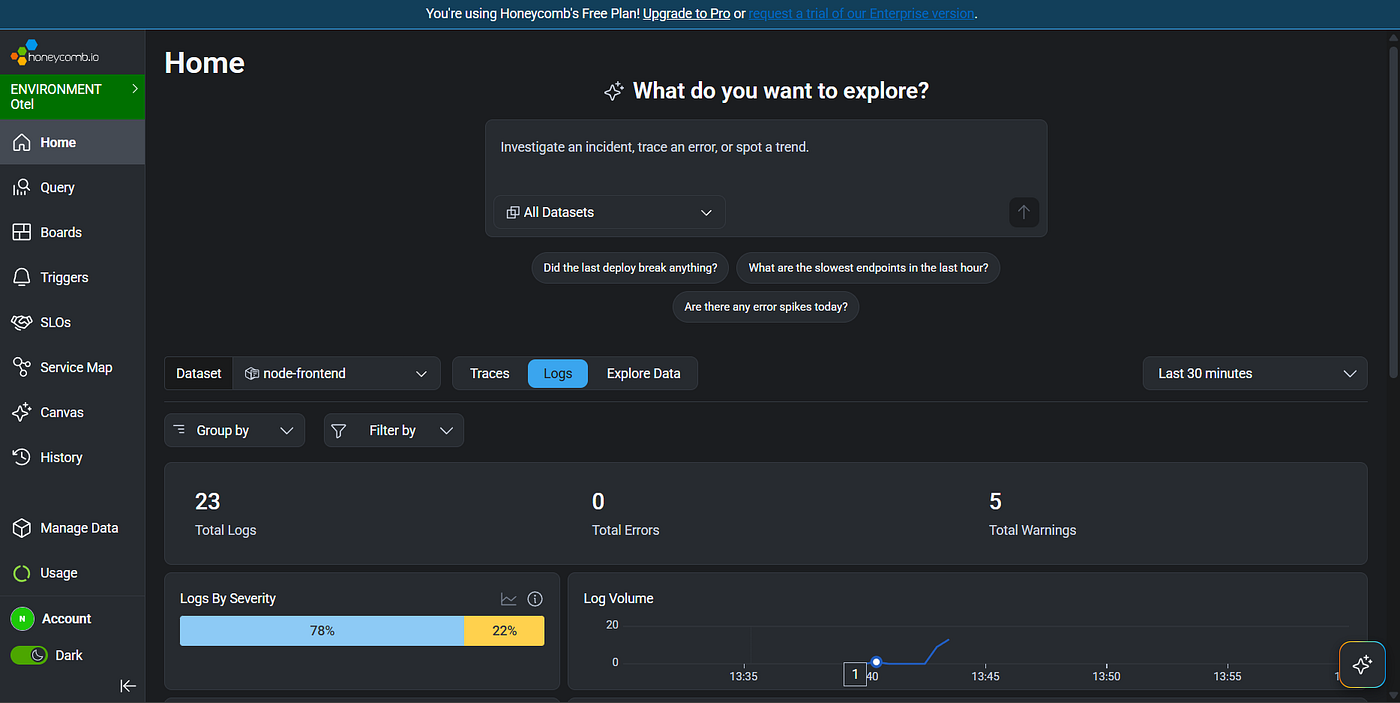
Honeycomb.io home view
The query builder is solid for slicing metrics and traces, but where Honeycomb stands out is the MCP server and Canvas — once connected to Claude, your telemetry becomes something you can interrogate in plain English rather than hand-writing queries.
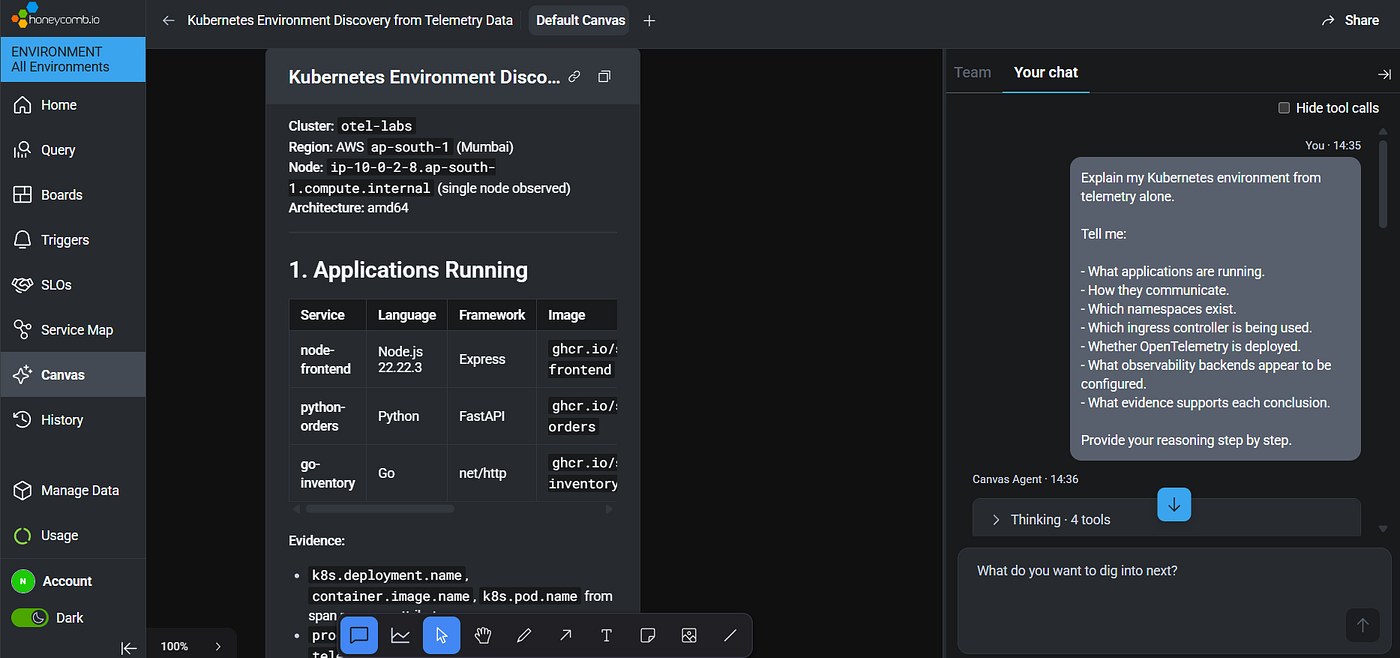
Asking questions in Canvas Interface
Ask Claude
Honeycomb also provides an MCP server. The integration is straightforward and can be connected directly to Claude using only an API key, without requiring additional JSON configuration or setup. This makes it possible to ask questions about application and Kubernetes telemetry using natural language. Similar questions can also be asked directly from the Honeycomb Canvas interface shown earlier.
For example, you can ask questions about application operations:
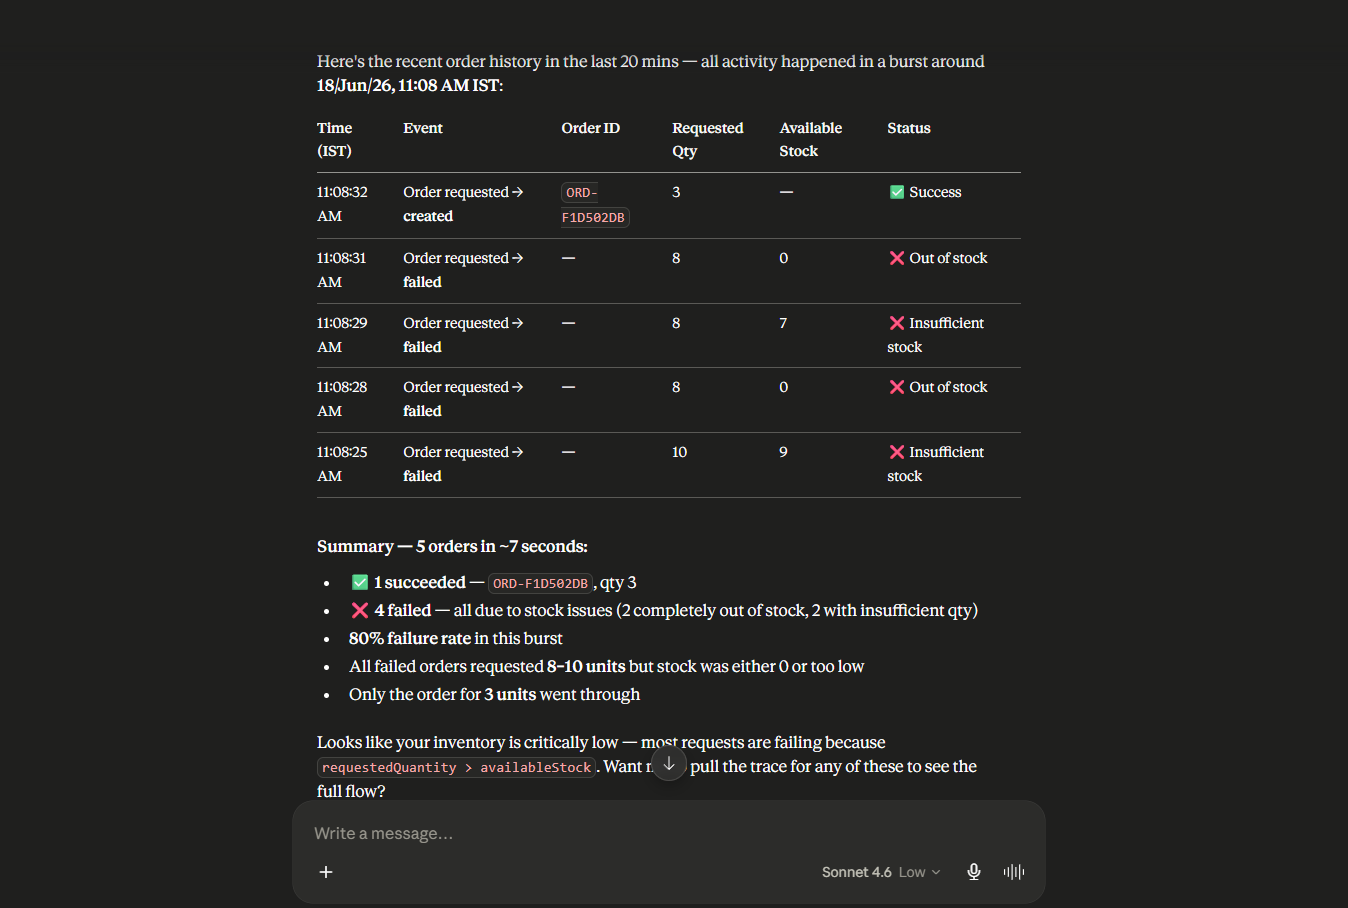
Ask claude about applcation operatons
You can also investigate cluster health, identify unhealthy pods, or ask other questions that help analyze application and Kubernetes behavior.
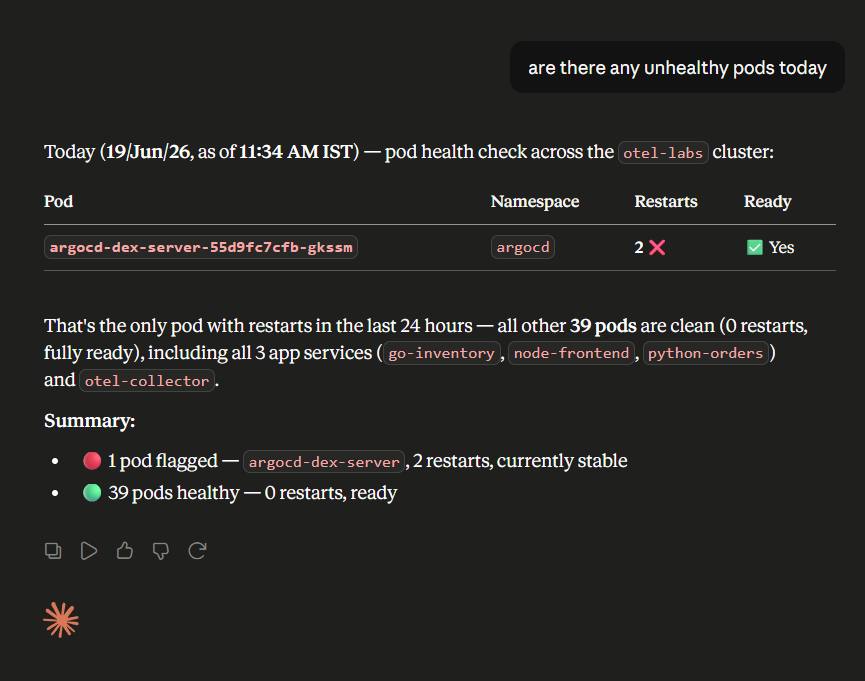
Claude informing about pos health status
Cleanup
To avoid issues during teardown, delete the ArgoCD applications first, remove the ingress resources, and then run terraform destroy to tear down the EKS infrastructure.
Delete ArgoCD Applications
        ↓
Delete Ingress Resources
        ↓
terraform destroy
Depending on the deployment approach used, remove the individual applications, root application, or Kustomize bootstrap before destroying the EKS infrastructure.
Wrap Up
At this stage, the platform is fully operational and telemetry is flowing from both the applications and the Kubernetes cluster into multiple observability backends. Continue exploring New Relic and Honeycomb to analyze traces, metrics, logs, and Kubernetes telemetry from different perspectives, or integrate the telemetry pipeline with other observability stacks such as LGTM, ELK, Splunk or Dynatrace and compare how they fit your needs.
Found this article helpful? Consider leaving a like if it added value or helped you learn something new. 👇
Previous article in this series:
**Checkout more Monitoring and Observability Articles →**
**Read more articles on Kubernetes →**
**Explore ArgoCD in Detail →**
Originally published at https://sagarpanda.com.
메타데이터
- post_id
- cfa3d3af174d
- slug
- seeing-inside-amazon-eks-with-opentelemetry-cfa3d3af174d
- url
- https://blog.devops.dev/seeing-inside-amazon-eks-with-opentelemetry-cfa3d3af174d
- canonical_url
- https://blog.devops.dev/seeing-inside-amazon-eks-with-opentelemetry-cfa3d3af174d
- author_url
- https://medium.com/@sagarkpanda
- status
- ok
- fetched_at
- 2026-06-26 03:39:16