How data analysis can optimize LNG shipment margins
Transportation and logistics account for 30–40% of LNG shipment costs, directly reducing per-shipment margins by tens of millions of…
How data analysis can optimize LNG shipment margins
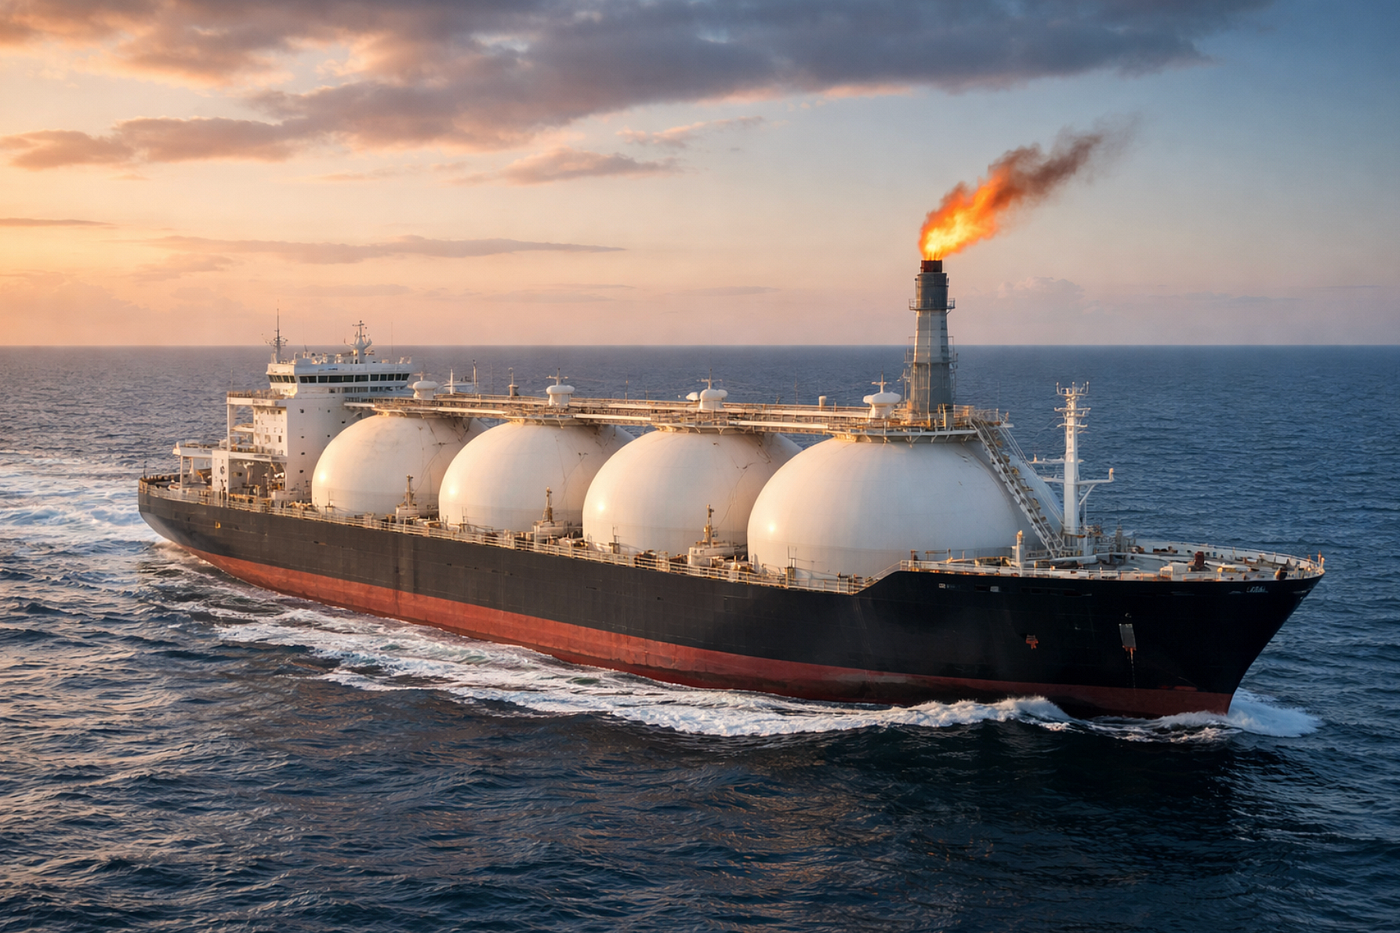
Transportation and logistics account for 30–40% of LNG shipment costs, directly reducing per-shipment margins by tens of millions of dollars annually. Inefficient routes, suboptimal vessel utilization, and seasonal variations amplify these losses.
Why it happens
- After supply chains shifted, logistics became the main driver of margin erosion, not production cost.
- Gas prices in Europe remain high, but producers don’t capture this upside — transportation absorbs it.
- Most companies still optimize for cost items, not for margin per m³.
What this analysis does
Instead of asking “How do we reduce costs?”, the core question becomes: “Which operational choices destroy or create margin?”
Using data from 800 shipments, the analysis quantifies how vessel type, port selection, seasonality and risk decisions translate directly into profit per cubic meter.
The dataset represents the logistics operations of a hypothetical LNG company with routes from the U.S. to key European markets.
The data is synthetic but reflects real market dependencies and is used to demonstrate the analysis methodology.
1. Where costs impact margin
Typically, analysis starts by breaking down costs by category: freight, fuel, port fees. But this does not answer the key question — where are we actually losing money?
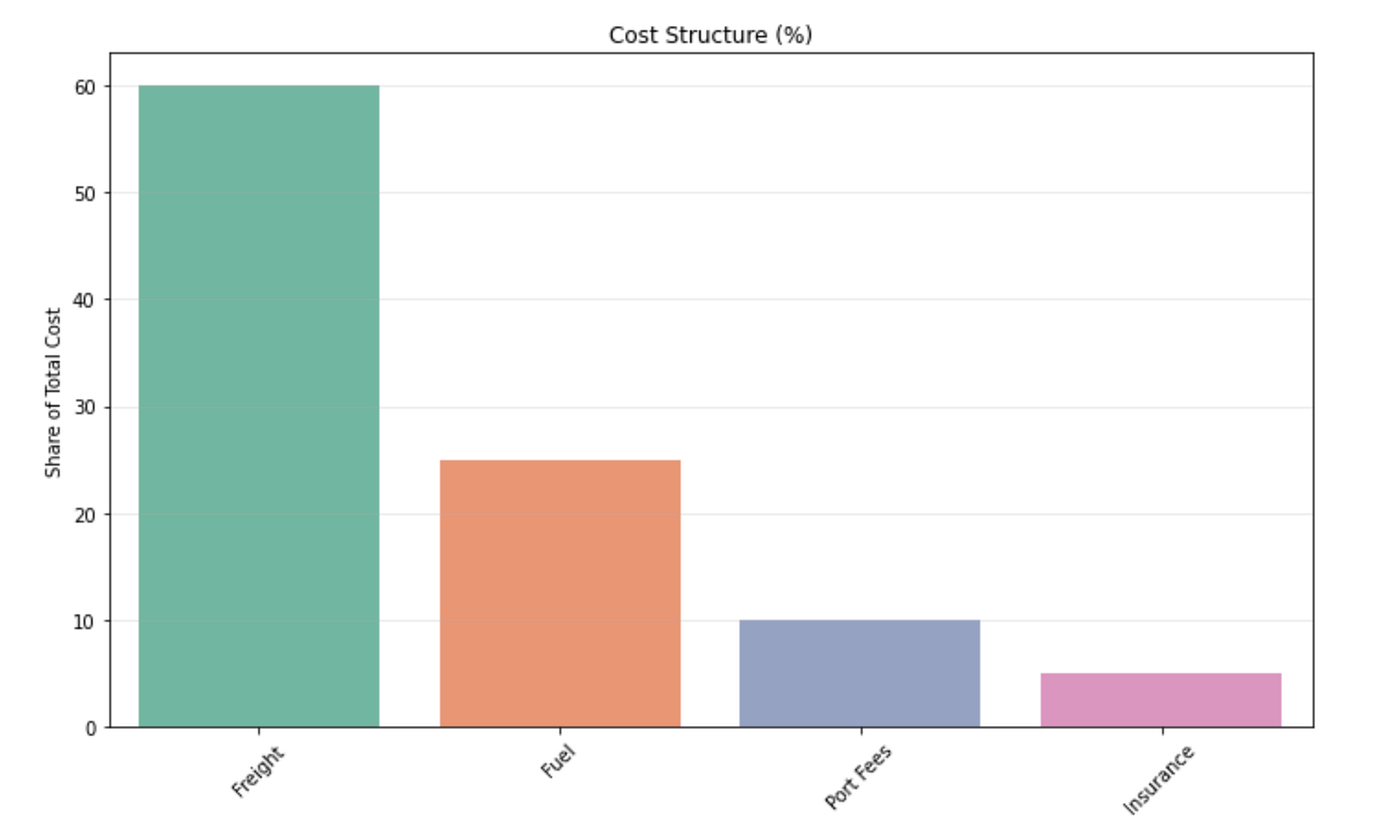
Instead of asking “What are our costs made of?” I asked “Which cost item most significantly reduces our margin?”
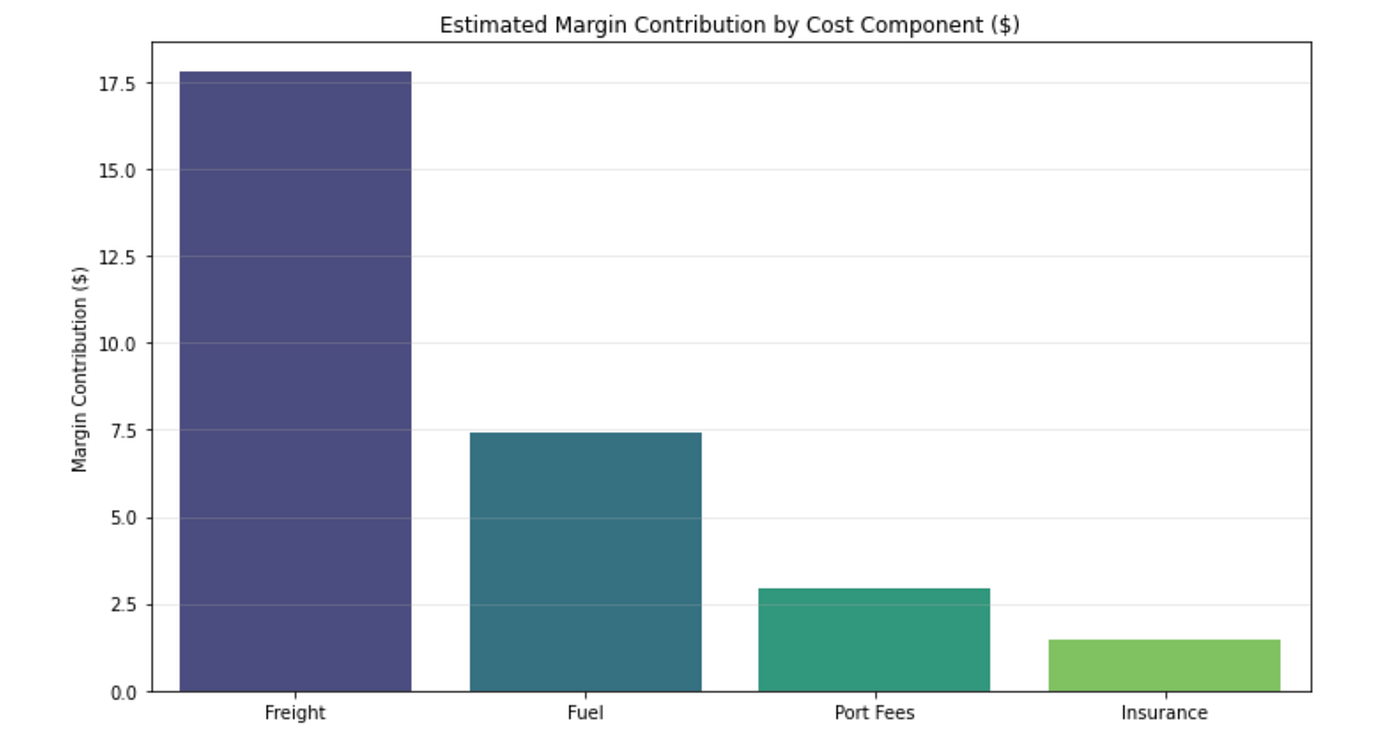
The greatest impact on overall margin comes from managing freight and shipment risks, rather than cutting secondary costs. Even though port fees and insurance appear small, optimizing them can provide local improvements, but on a global scale, the key levers are freight and routing.
2. Which routes are truly profitable
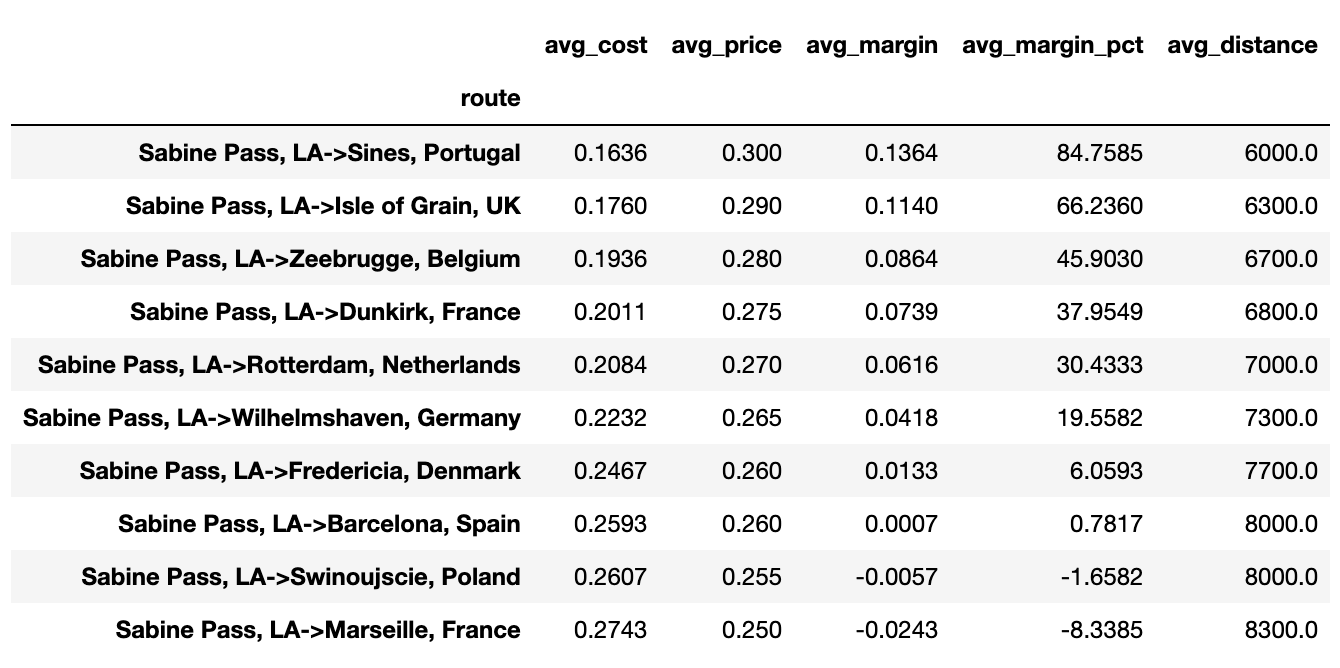
Let’s look at the data for shipments from Sabine Pass and see which routes generate the highest margins. The table below shows margins ($/m³) for the top 10 routes:
Insights
- Profit consistently decreases as distance increases. The data shows a near-perfect correlation between longer routes and lower margins.
- The most profitable routes are to Sines, Isle of Grain, and Zeebrugge. These three destinations consistently deliver the highest margins.
- A high price at port doesn’t guarantee profit. Shipments to Swinoujscie and Marseille are sold at a relatively high price, yet they are unprofitable.
3. Seasonality impact on margins — up to 30% lost
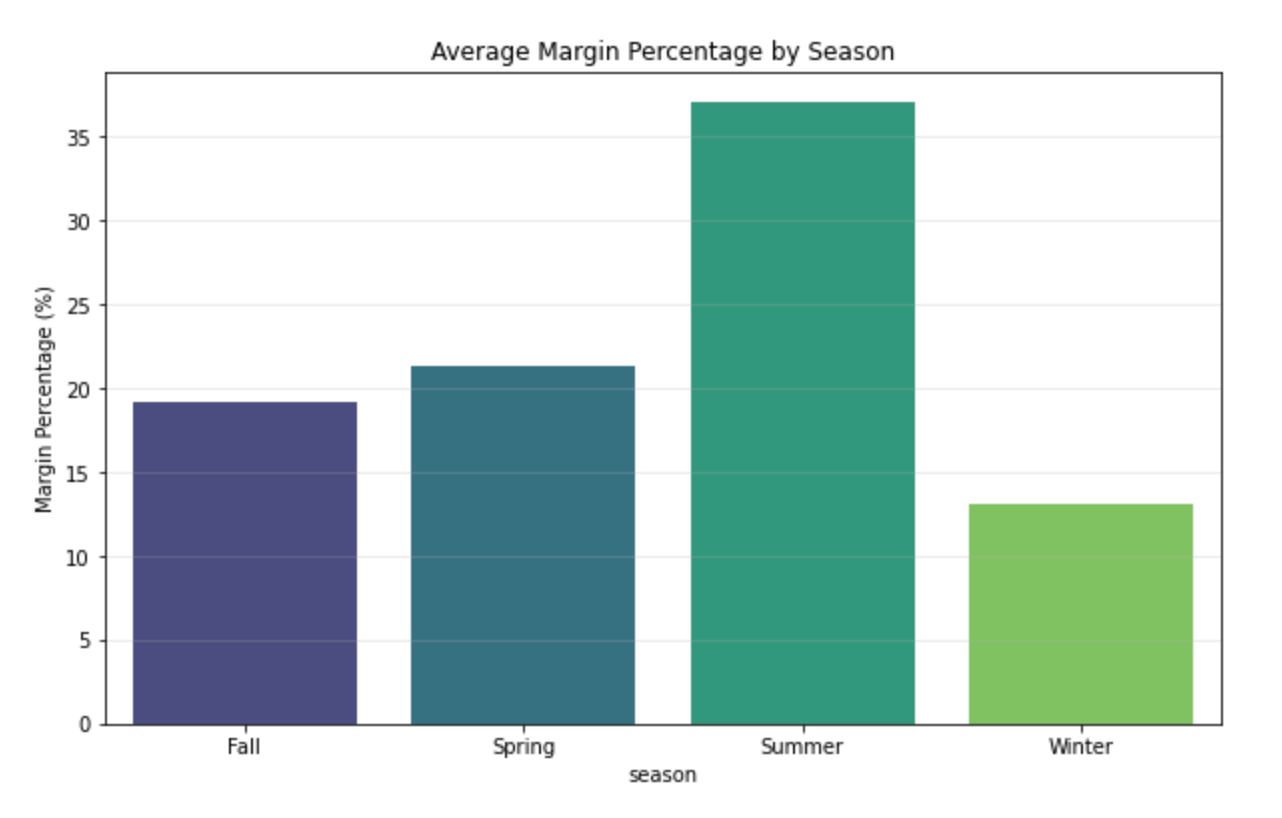
We look at seasonal data to understand how time of year impacts profitability. Shipping conditions, demand patterns, and operational constraints change across seasons, affecting costs and margins. This analysis highlights when logistics expenses are disproportionately high and when favorable conditions create higher effective margins.
Insights
Higher winter costs for freight and fuel are not offset by higher gas prices. In winter, we pay more for transportation but cannot pass these costs onto the final price. In summer, there is a “natural premium” — logistics costs are lower while selling prices remain close to winter levels. This is not just a seasonal fluctuation but a systemic distortion of margin throughout the year.
4. Impact of vessel size on margins
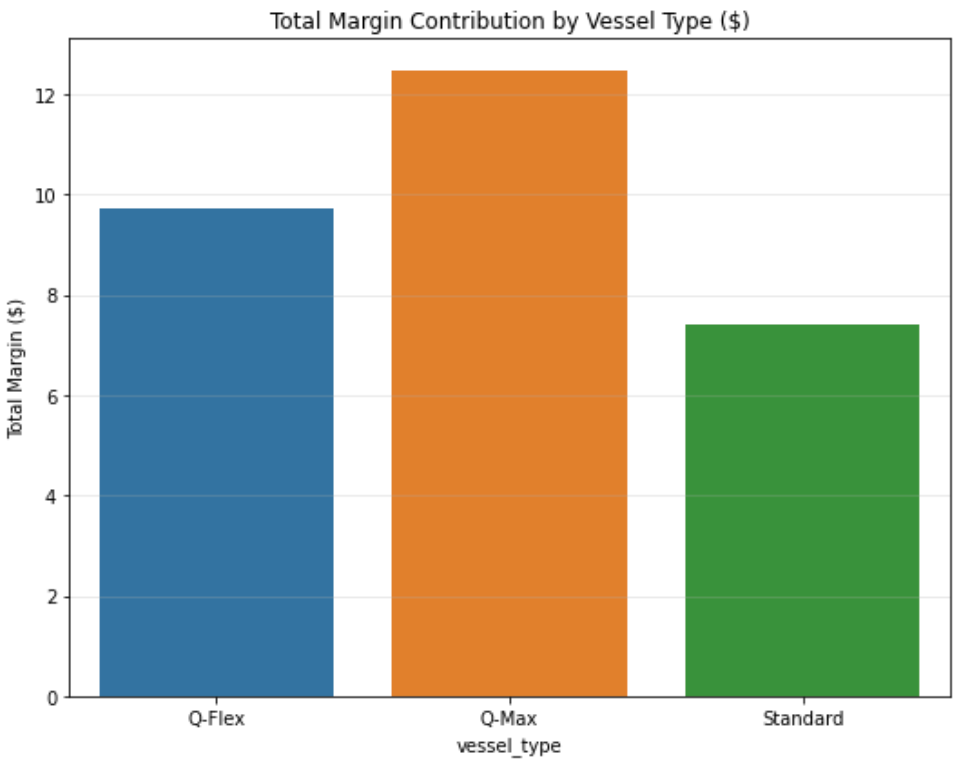
Vessel size directly shapes transport economics — freight rates, fuel consumption, and port fees grow slower than cargo volume. Larger tankers distribute fixed costs over more cubic meters, while the selling price per m³ stays nearly unchanged. So comparing vessel types reveals not just efficiency differences, but the real financial impact of scale.
Insights
The margin difference between Q-Max and Standard is 61%. At the scale of annual shipments measured in millions of cubic meters, this translates into tens of millions of dollars in additional profit.
5. Risk management as a financial lever
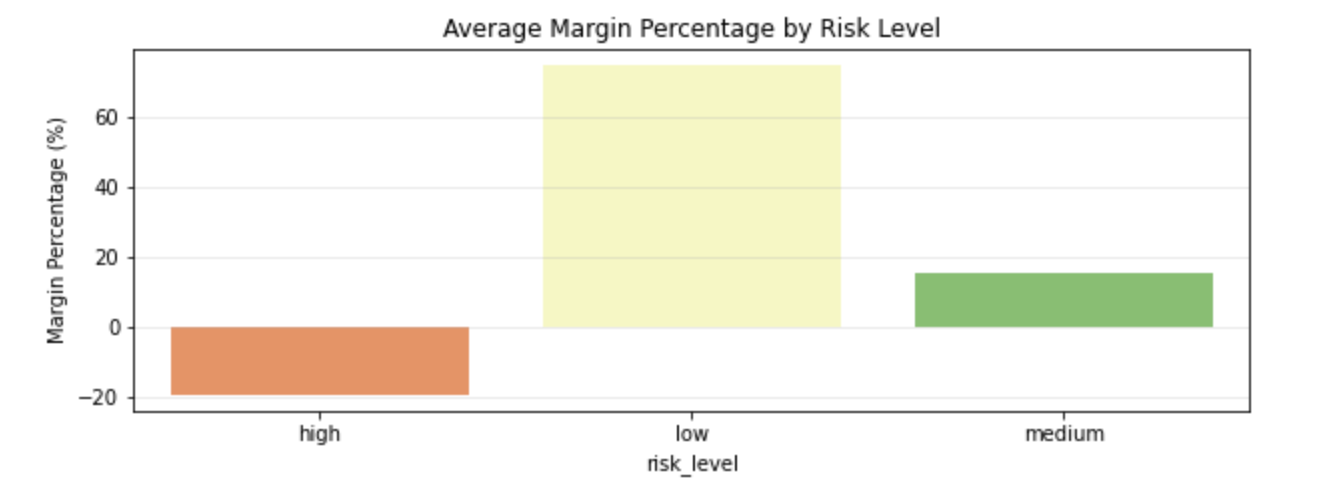
Risk is not a background variable — it directly determines whether a shipment makes money or loses it. Unlike fuel prices or charter rates, risk is partly controllable: routing decisions, port selection, contract terms, and insurance strategies define the financial outcome before the vessel even departs.
Insights
The margin gap of 0.1842 $/m³ shows that risk management generates more value than optimizing operational costs. Growth points are clear: avoid high-risk ports and weather windows, differentiate insurance strategies by route, structure contracts with risk-sharing clauses, and prioritize voyages with stable geopolitical and operational conditions.
Conclusions
Analysis of 800 LNG shipments shows that margin depends on port choice, seasonality, risk level, and vessel size. Maximizing profit is not about blind cost-cutting, it requires a structured approach that links operational decisions directly to financial outcomes, identifying the most impactful levers.
- Prioritizing ports by margin increases overall margin by 15–20% by reallocating shipments from unprofitable routes (Marseille, Świnoujście) to high-margin routes (Sines, Isle of Grain).
- Seasonal freight optimization cuts freight costs by 25–30% by securing time-charters for summer months and reducing spot shipments in winter, capturing the natural summer premium.
- Data-driven risk management reduces losses by 40–50% through implementing a risk scoring system and insuring only high-risk routes.
- Using large Q-Max tankers provides a margin increase of ≈0.016–0.017 $/m³ (+61%), translating into tens of millions of dollars at annual shipment volumes.
Maximizing margin requires a structured approach: analyze the data, connect operational choices to financial results, quantify each lever, and translate insights into concrete business actions.
We track this in real-time at oilradar.io For questions or discussion, reach out on LinkedIn.
메타데이터
- post_id
- cfcdc16ee518
- slug
- how-data-analysis-can-optimize-lng-shipment-margins-cfcdc16ee518
- url
- https://medium.com/@somewho/how-data-analysis-can-optimize-lng-shipment-margins-cfcdc16ee518
- canonical_url
- https://medium.com/@somewho/how-data-analysis-can-optimize-lng-shipment-margins-cfcdc16ee518
- author_url
- https://medium.com/@somewho
- status
- ok
- fetched_at
- 2026-07-11 21:05:18