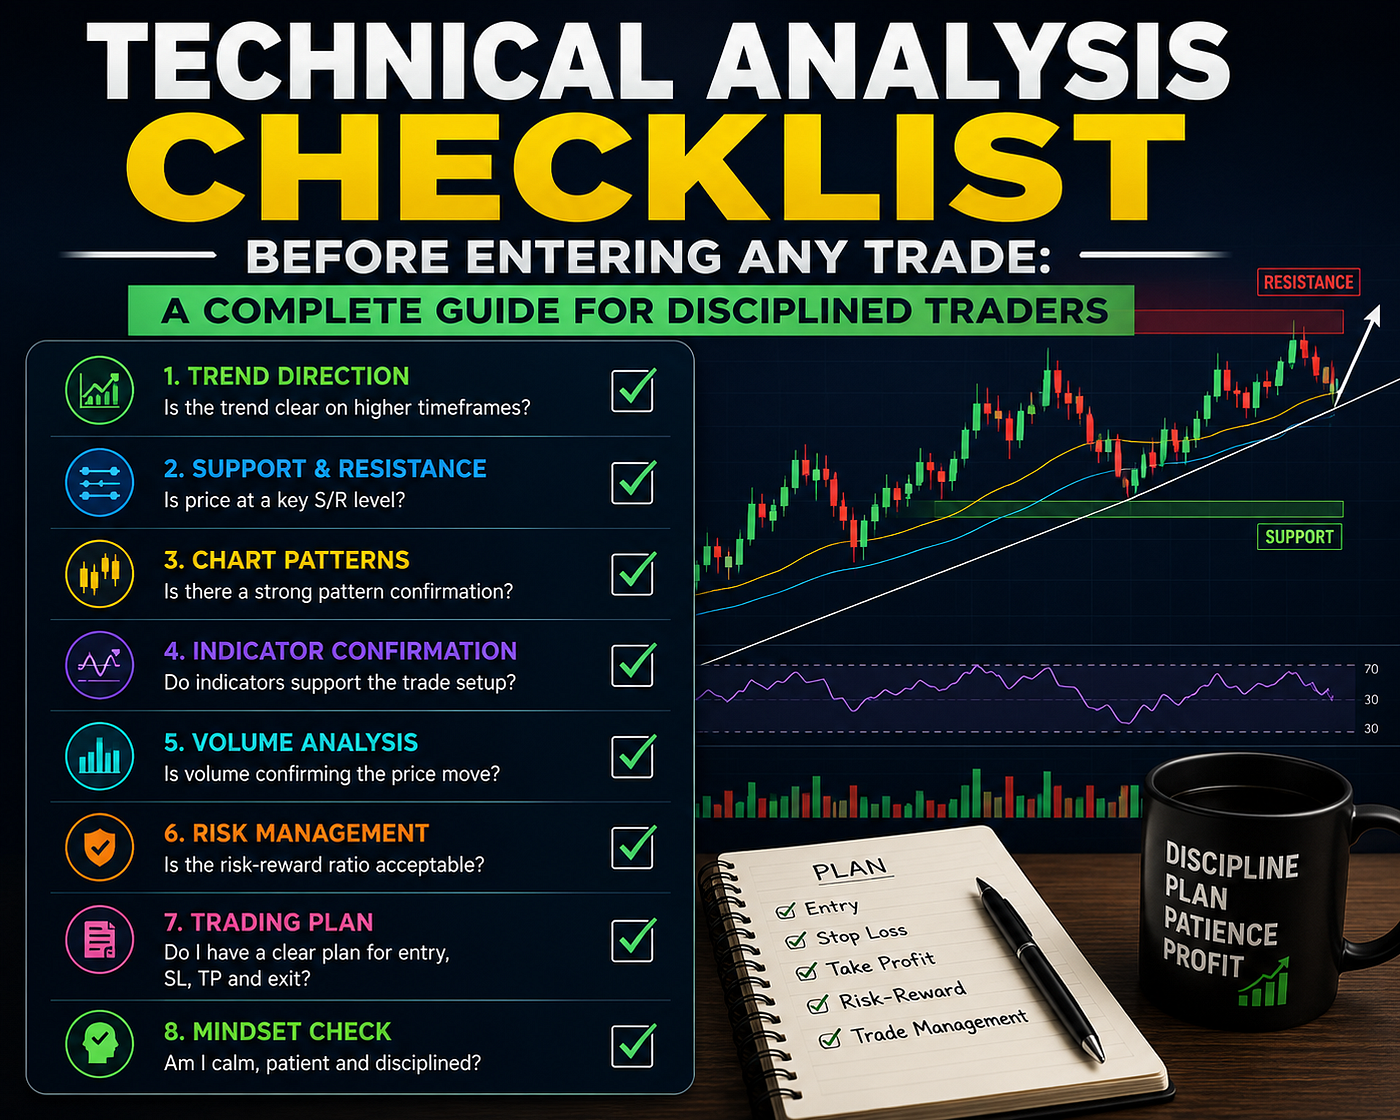
Technical Analysis for Beginners: How to Read Price Charts Like a Trader
Introduction
Technical Analysis for Beginners: How to Read Price Charts Like a Trader

Technical Analysis for Beginners
Introduction
Financial markets move every second. Prices rise, fall, consolidate, and break out based on market sentiment, economic events, and trader psychology. For beginners, these price movements may look confusing at first. However, experienced traders understand that charts tell a story. Learning how to read price charts is one of the most important skills in technical analysis.
Technical analysis helps traders study historical price movement to predict possible future market direction. Instead of relying only on news or emotions, traders use charts, trends, patterns, and indicators to make informed decisions.
Price charts reveal the battle between buyers and sellers. They show market momentum, trend strength, support zones, and resistance levels. Once beginners understand how charts work, they can identify trading opportunities with greater confidence.
This guide explains the fundamentals of technical analysis, how to read price charts like a professional trader, important chart patterns, indicators, trend analysis, and practical techniques beginners can use to improve market understanding.
What Is Technical Analysis?
Technical analysis is the process of studying price charts and market data to predict future price movement.
Traders analyze:
- Price action
- Volume
- Trends
- Support and resistance
- Chart patterns
- Technical indicators
The main idea behind technical analysis is simple: historical price behavior often repeats itself because market psychology remains consistent.
Why Technical Analysis Matters
Technical analysis helps traders make structured decisions instead of emotional guesses.
Key Benefits of Technical Analysis
Better Market Understanding
Charts help traders understand whether markets are bullish, bearish, or sideways.
Improved Trade Timing
Technical analysis provides better entry and exit opportunities.
Risk Management
Support and resistance levels help traders define stop-loss and target zones.
Market Psychology Analysis
Charts reflect fear, greed, optimism, and uncertainty among traders.
Understanding Price Charts
Price charts visually represent market activity over time.
Every chart contains two key elements:
- Price
- Time
Charts help traders analyze how an asset behaves during different market conditions.
Main Types of Price Charts
Line Chart
A line chart connects closing prices over a specific period.
Advantages
- Simple to understand
- Good for beginners
- Helps identify overall trend direction
Limitations
- Limited price detail
- Does not show intraday movement
Bar Chart
Bar charts provide more information than line charts.
Each bar shows:
- Opening price
- High price
- Low price
- Closing price
Bar charts help traders study price volatility more effectively.
Candlestick Chart
Candlestick charts are the most popular chart type in technical analysis.
Each candlestick displays:
- Open price
- High price
- Low price
- Close price
Why Traders Prefer Candlestick Charts
Candlesticks provide clear visual signals and market psychology insights.
Understanding Candlestick Structure
Bullish Candlestick
A bullish candle forms when the closing price is higher than the opening price.
It indicates buying pressure.
Bearish Candlestick
A bearish candle forms when the closing price is lower than the opening price.
It indicates selling pressure.
Wick or Shadow
The wick shows the highest and lowest prices reached during a trading session.
Long wicks often indicate volatility or rejection from certain price levels.
Important Candlestick Patterns for Beginners
Doji Pattern
A doji forms when the open and close prices are nearly equal.
Meaning
Market indecision.
Importance
Often appears before reversals.
Hammer Pattern
The hammer appears after a downtrend.
Signal
Potential bullish reversal.
Key Feature
Long lower wick with small candle body.
Shooting Star Pattern
The shooting star appears after an uptrend.
Signal
Possible bearish reversal.
Engulfing Pattern
An engulfing candle completely covers the previous candle.
Bullish Engulfing
Signals upward reversal.
Bearish Engulfing
Signals downward reversal.
Understanding Market Trends
Trend analysis is one of the most important concepts in technical analysis.
Uptrend
An uptrend forms when price creates:
- Higher highs
- Higher lows
This indicates strong buyer control.
Downtrend
A downtrend forms when price creates:
- Lower highs
- Lower lows
This indicates strong selling pressure.
Sideways Market
A sideways market moves within a range without a clear trend.
Traders often wait for breakouts during these conditions.
Support and Resistance Explained
Support Level
Support is a price zone where buyers usually enter the market.
Price often bounces upward from support areas.
Resistance Level
Resistance is a zone where selling pressure increases.
Price often struggles to move above resistance.
Why Support and Resistance Matter
These levels help traders:
- Identify entry points
- Plan stop-loss levels
- Set profit targets
- Predict breakout zones
Chart Patterns Every Beginner Should Know
Head and Shoulders Pattern
This pattern signals potential bearish reversal.
Structure
- Left shoulder
- Head
- Right shoulder
- Neckline
Double Top Pattern
A bearish reversal pattern formed after two failed attempts to break resistance.
Double Bottom Pattern
A bullish reversal pattern formed after two strong support bounces.
Triangle Patterns
Triangles indicate consolidation before breakout.
Types
- Ascending triangle
- Descending triangle
- Symmetrical triangle
Flag Pattern
Flags are continuation patterns appearing during strong trends.
Technical Indicators for Beginners
Technical indicators help traders confirm market direction and momentum.
Relative Strength Index (RSI)
RSI measures momentum and overbought or oversold conditions.
RSI Levels
- Above 70 = Overbought
- Below 30 = Oversold
Moving Averages
Moving averages smooth price data to identify trends.
Common Moving Averages
- 20-day moving average
- 50-day moving average
- 200-day moving average
MACD Indicator
MACD helps traders analyze trend strength and momentum shifts.
Traders Use MACD For
- Bullish crossovers
- Bearish crossovers
- Trend confirmation
Bollinger Bands
Bollinger Bands measure market volatility.
Trading Uses
- Breakout identification
- Volatility expansion
- Trend continuation signals
Volume Analysis in Technical Trading
Volume measures trading activity.
Strong volume often confirms price movement strength.
Why Volume Matters
Breakout Confirmation
Strong volume increases breakout reliability.
Trend Strength
High volume during trends signals market participation.
Reversal Signals
Sudden volume spikes may indicate reversals.
How to Read Price Action Like a Trader
Price action refers to raw market movement without relying heavily on indicators.
Professional traders focus on:
- Candle structure
- Market momentum
- Support and resistance
- Trend behavior
Multi-Timeframe Analysis
Experienced traders analyze multiple timeframes before entering trades.
Example
- Weekly chart for trend direction
- Daily chart for setup
- Hourly chart for entry timing
This improves trading accuracy.
Risk Management for Beginners
Technical analysis alone is not enough.
Risk management protects traders from major losses.
Important Risk Management Rules
Use Stop-Loss Orders
Stop-losses help control downside risk.
Avoid Overtrading
Focus only on high-quality setups.
Control Position Size
Never risk too much on one trade.
Maintain Discipline
Emotional decisions often lead to losses.
Common Mistakes Beginners Make
Ignoring Trend Direction
Trading against strong trends increases risk.
Using Too Many Indicators
Too many indicators create confusion.
Keep analysis simple.
Emotional Trading
Fear and greed often lead to poor decisions.
Entering Trades Without Confirmation
Always wait for proper breakout or reversal confirmation.
Psychological Side of Technical Analysis
Trading psychology plays a huge role in market success.
Charts reflect human emotions such as:
- Fear
- Greed
- Hope
- Panic
Understanding market psychology helps traders stay disciplined.
Importance of Practice in Technical Analysis
Technical analysis improves with experience.
Beginners should:
- Study charts daily
- Practice pattern recognition
- Review past trades
- Learn from mistakes
Consistency builds confidence over time.
Modern Technology and Technical Analysis
Trading technology has evolved rapidly.
Today, traders use:
- Real-time charting platforms
- Mobile trading apps
- AI-powered scanners
- Automated alerts
- Advanced technical indicators
These tools make market analysis faster and more efficient.
Why Technical Analysis Remains Popular
Technical analysis continues growing because it works across multiple markets:
- Stocks
- Forex
- Cryptocurrency
- Commodities
- Indices
It provides traders with a structured framework for understanding price behavior.
Tips for Beginners to Improve Chart Reading Skills
Start With Simple Charts
Avoid unnecessary complexity.
Focus on Trend Analysis
Trend direction is critical.
Learn Basic Patterns First
Master simple setups before advanced strategies.
Practice Patience
Good trades take time to develop.
Maintain a Trading Journal
Track setups, mistakes, and lessons learned.
Conclusion
Technical analysis is one of the most powerful tools traders use to understand financial markets. Learning how to read price charts like a trader can improve decision-making, market timing, and risk management significantly.
From candlestick patterns and trend analysis to support-resistance zones and technical indicators, every concept plays a role in understanding price behavior. Successful traders focus on discipline, patience, and continuous learning instead of emotional decision-making.
For beginners, the journey starts with understanding basic chart structures and gradually building trading experience through practice and observation. With time, technical analysis becomes an essential skill for navigating financial markets confidently.
메타데이터
- post_id
- d03cb4a09bbe
- slug
- technical-analysis-for-beginners-how-to-read-price-charts-like-a-trader-d03cb4a09bbe
- url
- https://medium.com/@astroduinaaai/technical-analysis-for-beginners-how-to-read-price-charts-like-a-trader-d03cb4a09bbe
- canonical_url
- https://medium.com/@astroduinaaai/technical-analysis-for-beginners-how-to-read-price-charts-like-a-trader-d03cb4a09bbe
- author_url
- https://medium.com/@astroduinaaai
- status
- ok
- fetched_at
- 2026-06-09 15:37:30